PRY
OF
AHOMQ
t
.y
__I
'
I,1
ISSN 0256-1859 Vol. 8, No. 5-6, 1987
General Aspects of Mortality in the Americas
Life Expectancy at Birth
In adopting the Plan of Action for implementa-tion of the Regional Strategies to attain health for all by the year 2000, the Member Governments of the Pan American Health Organization (PAHO) defined a minimum goal stating that by the end of the century no country in the Americas would have a life expectancy at birth of less than 70 years.
Life expectancy is an indicator calculated on the basis of a life table, which in turn is prepared on the basis of age-specific mortality rates. Life expectancy at birth is the reciprocal of the crude mortality rate from the life table, and sums up in one figure the mortality experience of all the age groups in a population; it is the average number of years that a newborn child may expect to live if the rates used to calculate the life table hold constant during its life. In addition to serving as an indicator of the level of mortality, it is quite frequently used to characterize the level of welfare and hence the degree of social development of a country.
Deficiencies in mortality and population data compromise the validity of the mortality rates, the life table, and all the indicators derived from it, including life expectancy at birth. However, there are demographic analysis procedures that can be used to construct life tables based only on census data and on techniques derived from population theory. The analyses that follow are based on figures
for life expectancy at birth calculated, projected and published by the United Nations Population Division.
The countries of Latin America and the Carib-bean are expected to achieve during the period 2000-2005 the level of life expectancy at birth that existed in the countries of North America during the period 1950-1955. Similarly, the average expectancy of 70 years, which the latter countries attained in 1960, will not be achieved until after the year 2010.
Table 1 indicates that there exist major differences between countries, some of which had already raised their life expectancy at birth to more than 70 years during the period 1980-1985. According to recent projections of the UN Population Division, other countries should attain the minimum goal by the end of the century, but 11 countries will have to make special efforts to reduce their mortality levels. Moreover, these national values are averages and shed no light on differences between population subgroups within a country,just as regional averages do not reflect differences between countries.
The life expectancy at birth of women is consist-ently greater than that of men, and it is striking that this difference is greater in the countries of North America, where it reaches about eight years -almost double the difference seen in the countries of Latin America and the Caribbean (Table 1).
Another obvious fact is that the higher the life expectancy at birth, the more slowly it continues to
IN THIS ISSUE...
* General Aspects of Mortality in the Americas * Analysis of Some Aspects of Mortality in Canada
* Diseases Subject to International Health Regulations
O0
· AIDS Drug Treatment· United Nations: A Resolution on Prevention and Control
of the Acquired Immune Deficiency Syndrome (AIDS) * Publications
· AIDS Surveillance in the Americas
* National Center for Health Statistics Joins CDC * To Our Readers
i iL L i I i , I
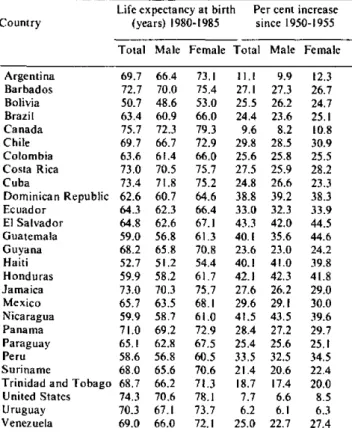
Table 1. Life-expectancy at birth in the period 1980-1985, by sex, and percentage increase since the period 1950-1955,
in selected countries of the Americas.
Life expectancy at birth Per cent increase Country (years) 1980-1985 since 1950-1955
Total Male Female Total Male Female
Argentina 69.7 66.4 73.1 11.1 9.9 12.3 Barbados 72.7 70.0 75.4 27.1 27.3 26.7 Bolivia 50.7 48.6 53.0 25.5 26.2 24.7 Brazil 63.4 60.9 66.0 24.4 23.6 25.1
Canada 75.7 72.3 79.3 9.6 8.2 10.8
Chile 69.7 66.7 72.9 29.8 28.5 30.9 Colombia 63.6 61.4 66.0 25.6 25.8 25.5 Costa Rica 73.0 70.5 75.7 27.5 25.9 28.2
Cuba 73.4 71.8 75.2 24.8 26.6 23.3
Dominican Republic 62.6 60.7 64.6 38.8 39.2 38.3 Ecuador 64.3 62.3 66.4 33.0 32.3 33.9 El Salvador 64.8 62.6 67.1 43.3 42.0 44.5 Guatemala 59.0 56.8 61.3 40.1 35.6 44.6 Guyana 68.2 65.8 70.8 23.6 23.0 24.2 Haiti 52.7 51.2 54.4 40.1 41.0 39.8 Honduras 59.9 58.2 61.7 42.1 42.3 41.8 Jamaica 73.0 70.3 75.7 27.6 26.2 29.0 Mexico 65.7 63.5 68.1 29.6 29.1 30.0 Nicaragua 59.9 58.7 61.0 41.5 43.5 39.6 Panama 71.0 69.2 72.9 28.4 27.2 29.7 Paraguay 65.1 62.8 67.5 25.4 25.6 25.1
Peru 58.6 56.8 60.5 33.5 32.5 34.5
Suriname 68.0 65.6 70.6 21.4 20.6 22.4 Trinidad and Tobago 68.7 66.2 71.3 18.7 17.4 20.0 United States 74.3 70.6 78.1 7.7 6.6 8.5
Uruguay 70.3 67.1 73.7 6.2 6.1 6.3
Venezuela 69.0 66.0 72.1 25.0 22.7 27.4
Source: United Nations. World Popularion Prospects: Estimates and Proje(tionsas Assessedin 1984. ST/ ESA/SER.A/98. New York. 1986.
rise; it is harder for a country to gain a year when its life expectancy at birth is already high because it has already eliminated many of the problems for which the knowledge and proper techniques for their solu-tion are available. The percentage increase is much greater for countries of low life expectancy at birth, some of which raised their expectancies more than 30% during the period considered. It is also true that some countries have raised their life expectancy faster than anticipated and others much more slowly.
General Mortality and Causes of Death
PAHO requests mortality data from Member Countries by means of an annual questionnaire. These data from the returned questionnaires are collated, edited, and processed. Every effort is made to produce timely data, but many delays are inherent in this process. For example, the most recent final mortality statistics available at PAHO from any country in the Region of the Americas are for 1984. Summary statistics such as crude death rates, are
frequently available before more detailed data are obtained by PAHO.
At the time this analysis was prepared, age- and sex-specific mortality data classified according to the Ninth Revision of the International Classifica-tion of Diseases were available at PAHO for 39 out of a total of 49 countries and other political units in the Region. The most recent available data for 7 countries pertained to 1982, for 7 countries to 1981, for 2 countries to 1980, and for 2 countries to 1979.
Any mortality analysis at the national, sub-regional, or regional level will be influenced by many variables: the extent of coverage of the population by death registries, which are the source of the statis-tics; the completeness of death registration within the population covered by the registries; the manner in which the data are collected and processed, including the accuracy of the coding; the complete-ness of medical certification of cause of death; and the accuracy of the final diagnosis. Data are not available with which to assess fully the influence of many of these variables.
In most countries death certification is required for interment. Hence, the total number of deaths registered is usually quite complete (greater than 90% of the events occurring). According to a United Nations study requesting countries to estimate the completeness of their data', of 43 countries respond-ing, 12 (28%) had less than 90% completeness, while 6 (14%) provided no specific information regarding completeness. Death registration for infants less than one year of age, deaths due to armed conflict, and deaths occurring in remote areas may be incom-plete. In this same study, 15 out of 43 countries (39%) reported less than 90% completeness of regis-tration of infant deaths. The magnitude of underreg-istration of these deaths is not stated and is probably unknown in many countries. Nevertheless, although deaths occurring in remote rural areas may go undetected, their number may not influence the totals very much since most of the population (over 70% in 1980) in the Region is located in urban areas where registration of death is more complete. While death registration may be reasonably complete, the same cannot be said for the accuracy of the informa-tion recorded. Records of age at the time of death, residence, and cause of death are frequently incorrect. The age may be incorrectly reported or rounded; residence at the time death occurred, rather than permanent residence, may be recorded. Errors in establishing the cause of death are a major problem, mainly due to the incompleteness of
Table 2. Percentage of medically certified deaths and of deaths due to symptoms, signs, and ill-defined conditions,
in selected countries.
Medically Deaths due to certified ill-defined Country (year) deaths (%) conditions (%)
Brazil (1980) 75.0 21.5
Chile (1979) 89.5 10.9
Colombia(1977) 75.2 8.6
Costa Rica (1979) 43.0 9.3
Dominican Republic (1979) 43.0 28.3a
Ecuador(1978) 57.0 16.5
El Salvador (1983) 46.5 21.5 b
Guatemala (1981) 30.0 23.8
Honduras (1983) 11.0 85.4
Panama (1978) 75.0 11.3`
Paraguayd (1979) 43.0 37.la
Peru (1980) 62.7 8.3
Suriname(1983) 88.6 30.2b
Uruguay (1984) 100.0 13.2
Venezuela (1981) 85.5 14.5
a Data for 1980. b Data for 1982. < Data for 1979. d Area of information.
medical certification of death and the inaccuracy of the final diagnosis. With or without medical certifi-cation, the final cause of death may be unclear and thus classified as due to "symptoms and ill-defined conditions," while in those cases where a defined cause is recorded, the accuracy of the final diagnosis may be questionable. Some indication of this prob-lem can be obtained by measuring the percentage of medically certified deaths. Table 2 summarizes data for selected countries. The percentage of deaths that are medically certified ranges from a low of 11% in
Honduras to a high of 100% in Uruguay.
While collection and collation of data may not be timely, coding of the information according to the Ninth Revision of the International Classification of Diseases is quite accurate, with no more than 2-5% error rates.
Crude and age-adjusted death rates
To compare death rates in different countries and in the same country over time, age-adjusted death rates are used since they permit comparisons between rates from populations with different age structures. Age-adjusted rates represent the mortal-ity rate that would be expected if a country's age-specific mortality rates had prevailed, and if its population had an age distribution equal to that of a
standard population. In calculating adjusted rates, PAHO uses a standard population derived from an estimated age distribution of the entire Latin
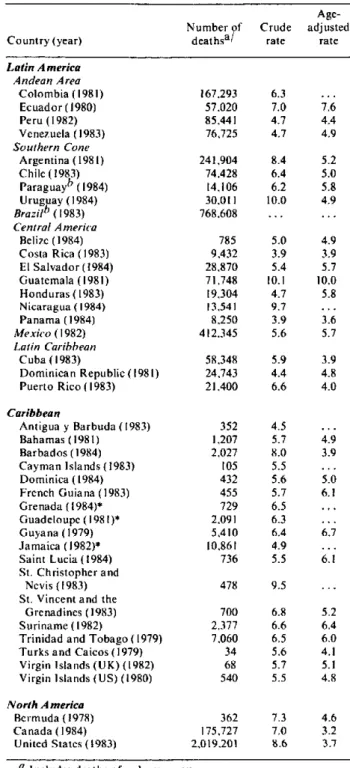
American population around the year 1960. Table 3 summarizes both crude and age-adjusted rates for 41 countries.
No data were available for Bolivia or Haiti. Age-adjusted mortality rates range from a low of 3.2 per
Table 3. Number of deaths and crude and age-adjusted rates, per 1,000 population, around 1984.
Age-Number of Crude adjusted
Country (year) deathsa/ rate rate
Latin A merica Andean Area
Colombia (1981) Ecuador (1980) Peru (1982) Venezuela (1983) Southern Cone
Argentina (1981) Chile (1983) Paraguayb (1984) Uruguay (1984) Brazilb (1983) Central A merica
Belize (1984) Costa Rica(1983) El Salvador (1984) Guatemala (1981) Honduras (1983) Nicaragua (1984) Panama (1984) Mexico (1982)
Latin Caribbean Cuba (1983)
Dominican Republic (1981) Puerto Rico (1983)
Caribbean
Antigua y Barbuda (1983) Bahamas (1981) Barbados (1984) Cayman Islands (1983) Dominica (1984) French Guiana (1983) Grenada (1984)* Guadeloupe (1981)* Guyana (1979) Jamaica (1982)* Saint Lucia (1984) St. Christopher and
Nevis (1983) St. Vincent and the
Grenadines (1983) Suriname (1982)
Trinidad and Tobago (1979) Turks and Caicos (1979) Virgin Islands (UK) (1982) Virgin Islands (US) (1980)
North A merica Bermuda (1978) Canada (1984) United States (1983)
167.293 57.020 85.441 76.725 241.904 74.428 14.106 30.011 768.608 785 9.432 28.870 71.748 19,304 13.541 8.250 412.345 58.348 24.743 21.400 352 1.207 2.027 105 432 455 729 2,091 5.410 10.861 736 478 700 2.377 7.060 34 68 540 362 175.727 2.019.201 6.3 7.0 4.7 4.7 8.4 6.4 6.2 10.0 5.0 3.9 5.4 10.1 4.7 9.7 3.9 5.6 5.9 4.4 6.6 4.5 5.7 8.0 5.5 5.6 5.7 6.5 6.3 6.4 4.9 5.5 9.5 6.8 6.6 6.5 5.6 5.7 5.5 7.3 7.0 8.6 7.6 4.4 4.9 5.2 5.0 5.8 4.9 4.9 3.9 5.7 10.0 5.8 3.6 5.7 3.9 4.8 4.0 4.9 3.9 5.0 6.1 6.7 6.1 5.2 6.4 6.0 4.1 5.1 4.8 4.6 3.2 3.7
a Includes deaths of unknown sex. b Area of information.
1,000 in Canada to a high of 10.0 in Guatemala. Most countries (19) had adjusted rates in the 4-5.99 per 1,000 range, while seven (Ecuador, French Guiana, Guatemala, Guyana, Saint Lucia, Suriname and Trinidad and Tobago) had higher rates.
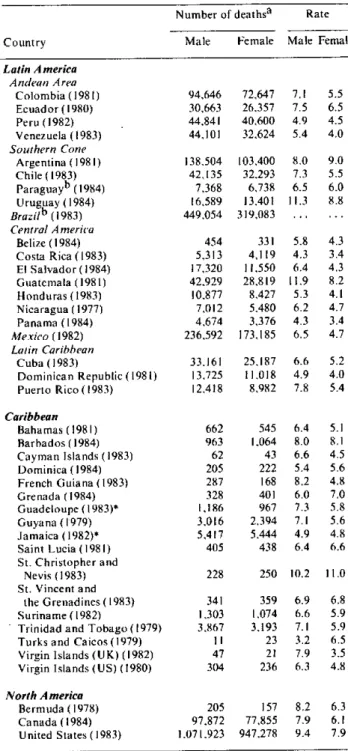
Sex and age-specific mortality rates
Table 4 shows the most recent data available on number of deaths by sex and the sex-specific death rates per 1,000 population for all countries except Antigua, Bolivia, Haiti, and Martinique. For males, the mortality rate ranges from a low of 3.2 per 1,000 population in Turks and Caicos to a high of 11.9 in Guatemala. In Argentina, Barbados, Bermuda, French Guiana, St. Christopher and Nevis, the United States and Uruguay, the male mortality rate was also relatively high i.e., 8.0 per 1,000 population or greater. Female mortality rates are generally lower and range from a low of 3.4 per 1,000 population in Costa Rica and Panama to a high of
11.0 in St. Christopher and Nevis.
Sex and age-specific death rates for six age groups (1-4, 5-14, 15-24,25-44,45-64, and 65+ years) from 36 countries are analyzed. Mortality rates were plotted versus age for the total population and separately for males and females. Four general patterns of mortality emerged based on the level of mortality in the 1-4 year age group and differences in sex-specific mortality rates.
Argentina, Bahamas, Canada, Chile, Puerto Rico and the United States had similar patterns in which childhood mortality is low. Adolescent and young adult mortality is equal and low for both sexes until the 45-64 year age group when a significant excess of male mortality develops and continues through the age group 65 and older.
Barbados, Costa Rica, Cuba, Panama, St. Chris-topher and Nevis, and Saint Lucia had another pattern. In this profile, childhood mortality is also low, and male and female mortality rates closely parallel each other throughout all age groups with only a slight increase in male mortality rates by ages 45-64, which continues through age 65 and over. St. Christopher and Nevis was relatively unique in that the mortality rate for the 65+ age group (112/1,000 population) was far greater than in any other country in this or any other group.
A third pattern exists in Belize, Dominican Republic, Honduras, Paraguay, and Venezuela. In this pattern, male and female mortality rates were even more closely identical until ages 65+ but childhood mortality was relatively elevated. The Netherlands Antilles and St. Christopher and Nevis
Table 4. Number of deaths and rates per 1,000 population, by sex and by country, around 1984.
Number of deathsa Rate
Country Male Female Male Female
Latin America
Andean Area Colombia ( 1981) Ecuador (1980) Peru (1982) Venezuela (1983) Southern Cone
Argentina ( 1981) Chile (1983) Paraguayb (1984) Uruguay (1984) Brazilb (1983) Central America
Belize (1984) Costa Rica(1983)
El Salvador (1984) Guatemala (1981)
Honduras (1983) Nicaragua (1977)
Panama (1984) Mexico (1982) Latin Caribbean
Cuba (1983)
Dominican Republic (1981) Puerto Rico (1983)
Caribbean
Bahamas (1981) Barbados (1984) Cayman Islands (1983) Dominica (1984) French Guiana (1983) Grenada (1984) Guadeloupe (1 983)* Guyana (1979) Jamaica (1982)* Saint Lucia (1981) St. Christopher and
Nevis (1983) St. Vincent and
the Grenadines (1983) Suriname (1982)
Trinidad and Tobago(1979) Turks and Caicos (1979) Virgin Islands (UK) (1982) Virgin Islands (US) (1980)
North A merica Bermuda (1978) Canada (1984) United States (1983)
94.646 30,663 44,841 44,101 138.504 42,135 7.368 16,589 449,054 454 5,313 17,320 42,929 10.877 7,012 4.674 236.592 33.161 13,725 12,418 72,647 26,357 40,600 32.624 103,400 32.293 6,738 13,401 319.083 331 4,119 11,550 28.819 8.427 5.480 3,376 173.185 25.187 11.018 8,982 7.1 7.5 4.9 5.4 8.0 7.3 6.5 11.3 5.8 4.3 6.4 11.9 5.3 6.2 4.3 6.5 6.6 4.9 7.8
662 545 6.4 963 1.064 8.0
62 43 6.6
205 222 5.4 287 168 8.2 328 401 6.0 1.186 967 7.3 3.016 2,394 7.1 5,417 5,444 4.9 405 438 6.4
228 250 10.2
341 1,303 3.867 11 47 304 205 97,872 1.071.923 359 1.074 3.193 23 21 236 157 77.855 947.278 6.9 6.6 7.1 3.2 7.9 6.3 8.2 7.9 9.4 5.5 6.5 4.5 4.0 9.0 5.5 6.0 8.8 4.3 3.4 4.3 8.2 4.1 4.7 3.4 4.7 5.2 4.0 5.4 5.1 8.1 4.5 5.6 4.8 7.0 5.8 5.6 4.8 6.6 11.0 6.8 5.9 5.9 6.5 3.5 4.8 6.3 6.1 7.9
a The sum of male and female deaths may not be equal to the total number of deaths given in other tables. due to some deaths being reported as "sex unknown."
b Area of information. * Provisional. ... Data unknown.
A different pattern is demonstrated by data from El Salvador, Guatemala, and Suriname. Male
.
mortality rates are much greater than female rates
from age 15 onwards throughout all age groups.Childhood mortality may or may not be elevated.
Mortality by cause
The Ninth Revision of the International Classifica-tion of Diseases (ICD-9) was adopted by the 29th World Health Assembly in 1976; some countries implemented it on 1 January 1979, while others did not begin to use it until 1980.
The previously mentioned incompleteness of medical certification of death and inaccuracy of final diagnosis have major implications for any
analysis of causes of mortality. In many countries a significant proportion of deaths is classified as being due to "symptoms, signs and ill-defined conditions." There is an inverse correlation between the
percen-tage of deaths with medical certification and the
percentage of deaths recorded as due to "symptoms and ill-defined conditions" (ICD-9, codes 780-799). Where medical certification is more or less complete, fewer deaths are coded in this category. Thus, the
occurrence of a large proportion of deaths classified as being in this category reflects to some extent the
level of coverage of the population by health care
services.
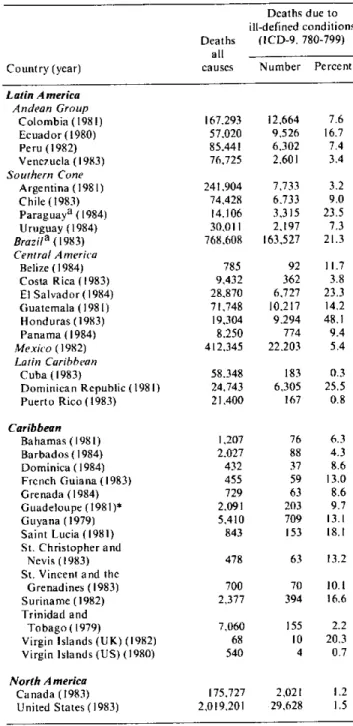
Table 5 summarizes the total number of deaths from all causes and the number and percentage of deaths due to "symptoms and ill-defined conditions"
for 35 countries. The countries with the lowest
per-centage of deaths due to "symptoms and ill-defined conditions" were Cuba, 0.3%, Puerto Rico, 0.8%, and Canada and the United States with 1.2% and 1.5%, respectively. The countries with the highest percentage were Honduras, 48.1% Dominican
Republic 25.5%, and Paraguay 23.5%. Less than 5% of the total number of deaths due to all causes were due to "symptoms and ill-defined conditions" in ten countries -Argentina, Barbados, Canada, Costa Rica, Cuba, Puerto Rico, Trinidad and Tobago, United States, Venezuela, and the Virgin Islands (US). Ten countries -Bahamas, Colombia, Chile, Dominica, Grenada, Guadeloupe, Mexico, Panama, Peru, and Uruguay were in the 5-9.9% range, while six countries -Belize, French Guiana, Guatemala, Guyana, St. Vincent and the Grenadines, and St. Christopher and Nevis -were in the 10-14.9% range. Three countries -Ecuador, Saint Lucia, and Suriname- were in the 15-19.9% range, while six
countries -Brazil, Dominican Republic, El Salvador, Honduras, Paraguay, and Virgin Islands
(UK)-Table 5. Number of deaths due to all causes and number and per cent of deaths due to symptoms, signs and ill-defined
conditions, by country, around 1984.
Deaths due to ill-defined conditions Deaths (ICD-9, 780-799)
all
Country (year) causes Number Percent
Latin A merica
Andean Group
Colombia (1981) Ecuador (1980) Peru (1982) Venezuela (1983)
Southern Cone
Argentina (1981) Chile (1983) Paraguaya (1984) Uruguay (1984)
Brazila ( 1983)
Central Anmerica
Belize (1984) Costa Rica (1983)
El Salvador (1984)
Guatemala (1981) Honduras (1983) Panama (1984) Mexico (1982)
Latin Caribbean
Cuba (1983)
Dominican Republic (1981) Puerto Rico (1983)
Caribbean
Bahamas (1981) Barbados (1984) Dominica (1984) French Guiana (1983)
Grenada (1984) Guadeloupe (1981)* Guyana (1979)
Saint Lucia (1981)
St. Christopher and Nevis (1983) St. Vincent and the
Grenadines (1983) Suriname (1982) Trinidad and
Tobago (1979)
Virgin Islands (UK) (1982)
Virgin Islands (US) (1980)
North A merica
Canada (1983) United States (1983)
167.293
57,020 85.441 76.725
241,904 74,428 14.106 30,011 768,608
785
9,432
28.870 71,748
19,304 8,250
412.345
58.348 24.743 21,400
12,664 7.6
9,526 16.7 6.302 7.4
2,601 3.4
7,733 3.2 6.,733 9.0 3,315 23.5
2,197 7.3
163,527 21.3
92 11.7 362 3.8 6.,727 23.3
10,217 14.2
9.294 48.1 774 9.4 22.203 5.4
183 0.3 6.,305 25.5
167 0.8
1.207 76
2,027 88
432 37 455 59 729 63
2.091 203
5,410 709
843 153
478 63
700 70
2,377 394
7,060 155
68 10
540 4
6.3
4.3 8.6
13.0
8.6 9.7
13.1 18.1
13.2
10.1 16.6
2.2 20.3
0.7
175,727 2,021 1.2
2,019,201 29.628 1.5
a Area of information.
* Provisional.
classified 20% or more of their deaths due to ill-defined causes.
leading causes of death, it would be lísted as the first "cause of death" for all age groups combined, first for the 1-4 year-old age group, second for the 5-14, fourth for the 15-24, third for the 25-44 year-old age group, and first again for the 45-64 year-old and the 65+ year-old age groups. Similar patterns are found in Guatemala, Honduras and Paraguay. In the Dominican Republic, "symptoms and ill-defined conditions" would be either the first or second "cause of death" in all age groups, except the under one age group, where it ranks third. Thus, if most of these ill-defined conditions were due to only a few causes, a totally different picture of the mortality structure might emerge.
The leading causes of mortality reflect, in a general way, the health profile of the population and the range of health problems each population must face. In each of the 35 countries, the first five leading causes of mortality were examined for the total population and for men and women separately, for five specific age groups, 5-14, 15-24, 25-44, 45-64 and 65 years and over. The first five causes of
mortality generally include approximately 30-65% of all deaths from all causes for all ages.
Obviously, the very nature of the groupings contributes to whether or not specific disease problems are determined to be "leading" causes of death. For example, while infectious diseases, as a group, continue to cause appreciable morbidity and mortality in Latin America, individual, specific infectious diseases rarely appear among the first five causes of mortality. In some countries no infectious diseases appeared in the top 20 causes of mortality. Few specific infectious diseases appeared in the top five among the countries analyzed. In Ecuador, tuberculosis is the second leading cause of death in the 15-24 year-old age group as well as in the 25-44 year-old age group. In Guatemala, measles is the third leading cause of death in the 5-14 year-old age group.
The analysis of mortality by cause was hampered in the small Caribbean islands by the small number of total deaths. A few deaths due to one cause or another could significantly alter the ranking in particular age groups. For example, in Dominica, in 1982, there was a total of 414 deaths. Of these, 3 occurred in the 5-14 year-old age group while 7 occurred in the 15-24 year-old age group. An addi-tional death due to any particular cause wóuld significantly alter the ranking.
In general, regardless of a particular country's stage of development or progress in health care, violent death, in one form or another, dominates the mortality profile of the 5-24 year-old age groups, for both'sexes. These deaths were due to motor vehicle
accidents, all other accidents combined, suicide and homicide. Again, regardless of the stage of a coun-try's development, the 45-64 year-old age group and the 65+ age group were dominated by cardiovascular disease, cerebrovascular disease, and malignant neoplasms.
In the 5-14 year-old age group, for both sexes combined, motor vehicle accidents, general acci-dents, and injuries dominate the mortality profile. Occasionally countries report leukemia as the fourth or fifth leading cause of death. In the less developed countries other conditions related to infectious diseases may occur among the first five leading causes of death. For example, in El Salvador, Guatemala, and Peru other intestinal infections, influenza and pneumonia, and measles appear among the first five causes. In the United States death due to congenital anomalies appears as the third leading cause of death in this age group.
The 15-24 year-old age group is also dominated by accidental and violent death. Suicide and homicide appear as leading causes in this age group. For example, in Suriname, suicide is the second cause of death with 25.5% of all deaths due to this cause; in women, suicide accounts for 33% of all deaths. In the United States, 36.7% of all deaths in this age group were due to motor vehicle accidents; if these are combined with all other accidents, homicides and suicides, violent death accounts for 78.7% of all deaths. In some of the countries maternal causes of death appear as important causes among females. For example, maternal causes are the first cause of death in Paraguay, the second cause in Ecuador,
Mexico, and Suriname, and the third cause in the Dominican Republic, El Salvador, Guyana, Panama, Trinidad and Tobago, Uruguay, and Venezuela.
In the 25-44 year-old age group no clear-cut patterns emerged. In a sense, this is a transitional age group with a variable and sometimes unique profile. Motor vehicle accidents and accidents in general are less prominent as a cause of death, occasionally appearing as the fourth or fifth cause. Diseases of the pulmonary circulation and other heart disease begin to appear with greater frequency. Neverthe-less, some countries have unique patterns. For example, in Chile, the third cause of death in this age group is chronic liver disease and cirrhosis.
accidents within the first five; 12 reported chronic liver disease and cirrhosis, and 10 reported diabetes
mellitus. Diseases of the heart ranked first among
the leading causes in 16 countries, and were respon-sible for as much as 30% of the deaths in Argentina (30.0); Barbados (29.7); Belize (31.2); Canada (31.0); Costa Rica (33.0); Cuba (29.6); Netherlands Antilles (29.5); Puerto Rico (29.8); Trinidad and Tobago (34.7); United States (34.9), and Venezuela (29.8).
The above pattern is very similar for the 65+ year age group in which all 33 countries with more than 100 deaths in that age group reported malignant neoplasms and diseases of the heart among the five leading causes; 32 reported cerebrovascular disease, 17 reported diabetes mellitus, and 12 reported chronic liver disease and cirrhosis. One notable difference between this and the previous age group is
that influenza and pneumonia, which was reported as a leading cause by only three countries in the 45-64 year age group, in the 65+ group was among the five first in 27 countries.
In spite of the limitations inherent in the data, it is clear that mortality in this Region is no longer dominated by infectious diseases alone. There now exists an epidemiological mosaic which also includes chronic degenerative diseases, violent death, and other consequences of the environment and certain life-styles. More detailed and comprehensive mor-tality analyses at local levels will provide valuable insights for epidemiologists, administrators, planners, and decision-makers.
(Source: Health Situation Analysis and Trend Assessment Program, PAHO.)
Analysis of Some Aspects of Mortality in Canada
Editorial Note
The two articles that follow, "Early Mortality Due to Unintentional Injury in Canada, 1985" and "Life Expectancy by Sex, Age and Income Level ': are presented here because they illustrate some uways in which mortalit '
data can be analyzed to achieve a picture which is more informative than the one obtained by looking af.just the traditional rates and proportions. The first article shows an application of the indicatorfor y'ears of life lost prematurely, which is being increasingl! used to take into considerafion the importance of age of death when analyzing the leading causes of mortali o'. The second article illustrates the use of another mortalit indicator, life
expectancy at birth. to relate the overall level of mortaliit and the level of income as a means of approximating the
influence of social and economic conditions on health.
It is hoped that these two examples of epidemiologic analy sis may' stimulate similar endeavours in countries of the
A mericas, with the aim fhat mortalit - data, which are the most readily available data in all countries of the Region, be more widely used for prioritfv and policy formulation and the creation of consensus required for action and resource allocation.
Early Mortality Due to Unintentional Injury in Canada, 1985
Introduction
Mortality occurring before age 65 is one of the leading problems facing our health care system. With the decline in importance of infectious diseases, unintentional injuries have become the leading cause of death for more than half the human lifespan, ages 1-44(1). Conventional mortality rates, which treat all deaths equally regardless of age, do not provide an adequate measure of this early
mortality. One measurement of the number of economically productive years of life lost is the potential years of life lost index. This report uses this index to examine unintentional injury-the leading cause of potentially preventable early mortality in Canada.
Material and Methods
A machine readable record of all deaths in