A dose-response curve for biodosimetry from
a 6 MV electron linear accelerator
M.M.P. Lemos-Pinto
1, M. Cadena, N. Santos
1, T.S. Fernandes
1,2, E. Borges
1,3and
A. Amaral
1 1Departamento de Energia Nuclear, Universidade Federal de Pernambuco, Recife, PE, Brasil 2Departamento de Biofísica e Radiobiologia, Universidade Federal de Pernambuco, Recife, PE, Brasil 3Centro Acadêmico de Vitória, Universidade Federal de Pernambuco, Vitória de Santo Antão, PE, BrasilAbstract
Biological dosimetry (biodosimetry) is based on the investigation of radiation-induced biological effects (biomarkers), mainly dicentric chromosomes, in order to correlate them with radiation dose. To interpret the dicentric score in terms of absorbed dose, a calibration curve is needed. Each curve should be constructed with respect to basic physical parameters, such as the type of ionizing radiation characterized by low or high linear energy transfer (LET) and dose rate. This study was designed to obtain dose calibration curves by scoring of dicentric chromosomes in peripheral blood lymphocytes irradiatedin vitrowith a 6 MV electron linear accelerator (Mevatron M, Siemens, USA). Two software programs, CABAS (Chromosomal Aberration Calculation Software) and Dose Estimate, were used to generate the curve. The two software programs are discussed; the results obtained were compared with each other and with other published low LET radiation curves. Both software programs resulted in identical linear and quadratic terms for the curve presented here, which was in good agreement with published curves for similar radiation quality and dose rates.
Key words: Dicentrics; Calibration curves; Linear accelerator; CABAS; Dose Estimate
Introduction
Biological dosimetry (biodosimetry) is an important method for estimating the dose of ionizing radiation absorbed by a person, and is based on biological endpoints modified after chronic or acute exposure to this physical agent (1). Among several proposed biological endpoints and cellular biomarkers, the assay of dicentric chromo-somes in peripheral blood lymphocytes is the most frequently used and is considered as the gold standard (1). A dicentric chromosome is a radiation-induced aber-rant chromosome formed as a result of misrepair by nonhomologous end joining whereby two damaged chromosomes undergo an exchange of material. A number of studies have demonstrated a close correspond-ence between the yield of radiation-induced dicentrics and the absorbed radiation dose for either in vivoor in vitro exposures (1,2).
The main advantages of scoring dicentrics for biodosi-metric evaluations are their high radiation specificity, low background in nonexposed individuals (0-1 dicentric per 1000 cells), low intervariability, and low detection limits of 0.1 Gy for low linear energy transfer (LET) radiation
(e.g.,g- and X-rays) and 0.01 Gy for high LET radiations such as neutrons (3).
Scoring of dicentrics in peripheral blood lymphocytes cultured in vitro is interpreted in terms of the absorbed radiation dose with reference to a dose-response calibra-tion curve generated by irradiating blood samples from healthy, unexposed donors with different absorbed doses of a defined quality of radiation. The yield of radiation-induced dicentrics is dose dependent, increasing linearly for small absorbed doses, and quadratically for high absorbed doses of low LET radiation. This is known as the linear-quadratic model. For high LET radiations, the shape of the dose response is linear, with no quadratic term (4,5).
The correct curve-fitting procedure is not trivial because it requires an appropriate weighting of data points through implementation of algorithms and the calculation of dose uncertainty. The latter is usually reported as the 95% confidence interval (CI) and is associated with two components: the distribution of unstable aberrations in the irradiated sample (corresponding to the Poisson distribution
Correspondence: M.M.P. Lemos-Pinto:[email protected].
or the overdispersion) and uncertainties associated with the calibration curve (6).
To overcome difficulties in implementing algorithms for the data points fitting and for calculation of confidence intervals on the dose-response curves, computer pro-grams have been constructed. For exposure to low LET radiation, the most widely used software packages to fit dose calibration curves are CABAS (Chromosomal Aberration Calculation Software ohttp://www.ujk.edu.pl/ ibiol/cabas/4) and Dose Estimate (7). CABAS employs the maximum likelihood (ML) statistical method, whereas Dose Estimate is based on the iteratively reweighted least squares (IRLS) method (8,9).
According to the IAEA (International Atomic Energy Agency) (1), each cytogenetic biodosimetry laboratory should generate its own dose-response curves in order to avoid interlaboratory variations, which have been docu-mented in collaborative exercises (10). Such differences arise from multiple reasons such as intrinsic environ-mental conditions in each laboratory, choice of reagents, handling procedures and equipment, and the level of training for the subjective nature of microscopic identifi -cation of unstable chromosome aberrations. Although a laboratory dose estimation based on a calibration curve obtained by another laboratory may be used as a reference, this practice will introduce additional uncertainties (11).
In order to approximate in vitro-generated calibration curves as closely as possible to in vivoresponses, it is important to generate the curves using a wide range of possible absorbed doses involved in the majority of accidental human exposures to ionizing radiation. Since most radiological incidents involve overexposure to gamma-radiation or X-rays, curves for those two low LET radiations should be the first ones established in biodosimetry laboratories (12).
On the other hand, electron linear accelerators (LINACs) are increasingly becoming the most frequently used device in modern radiotherapy departments. LINACs produce a reliable, flexible and accurate radiation beam that can simply be powered off when not in use (13,14). As a result, in developed and developing countries,
60cobalt (1.25 MV) sources have been replaced by
electron LINACs over the years, increasing the need for a biodosimetry calibration curve more suitable for energy levels higher than 4 MV in order to be prepared for accidents and incidents with LINACs (13,15).
The purpose of this paper was to construct anin vitro dose calibration curve for a 6 MV electron linear accel-erator using the dicentric assay and tofit the data to both the CABAS and the Dose Estimate programs in order to compare the output of each method. The curve was compared to other curves reported in published studies and obtained with other types of radiation to investigate differences in the linear and quadratic terms for different kinds of radiation energies. Extending the range of
radiation qualities for which the dicentric assay has been calibrated is important because of advances in medical treatment with linear accelerators and for increasing the quality of radiological emergency programs.
Material and Methods
Ethics
This work was approved by the Ethics Committee on Research Involving Humans of the Health Science Center of the Universidade Federal de Pernambuco, under registration No. 031/09. Blood samples were obtained with written informed consent, and the donor’s privacy rights were observed.
Irradiation conditions
Peripheral blood samples were obtained by venipunc-ture from nonsmoking healthy male donors 29 years of age and collected in heparinized tubes. Samples were aliquoted into 3 mL syringes and separately irradiated in vitro, at room temperature.
The irradiation consisted of X-rays from a 6 MV linear accelerator (Mevatron M; Siemens, USA) at a dose rate of 0.54 Gy/min. Syringes (3 mL) were positioned in a solid water-equivalent phantom (r=0.99 g/cm3), which simu-lated soft tissues of the human body. The blood samples were placed in the center of a 1515 cm radiationfield at a source-sample distance of 0.80 m from the radiation source at the phantom. Each blood aliquot was exposed at room temperature to six different radiation doses: 0.25; 0.5; 1.0; 1.5; 2.0; and 3.0 Gy. The low doses (0.25 and 0.5 Gy) were needed in order to determine the linear alpha term, and the higher doses (X1 Gy) were needed to determine the beta quadratic term. One nonirradiated (0 Gy) aliquot served as a control sample.
Lymphocyte cultures
After irradiation, the blood was kept at 37°C in a water bath for 2 hours, before setting up lymphocyte cultures. For each culture, 0.4 mL of whole blood was added to 4 mL RPMI 1640 medium supplemented with 0.5 mL fetal calf serum (Cultilab, Brazil) and 0.1 mL phytohemagglu-tinin (Gibco, Brazil). The cultures were incubated at 37°C in humidified air with 5% CO2for 48 h. These procedures
were consistent with guidelines of the International Atomic Energy Agency (IAEA) manual (1).
Colcemid (Sigma, Brazil) was added at the beginning of cell culture at a very low concentration (0.05mg/mL) in order to arrest cells at first metaphase. Early addition of this mitotic spindle inhibitor prevented excessive chromo-some condensation and allowed for metaphase spreads adequate for scoring aberrations. This was the method of choice because it avoided the possibility of cells escaping from the first division, thus eliminating the need for monitoring the cell cycle with bromodeoxyuridine and
Cell harvesting was carried out by standard proce-dures. In brief, after hypotonic treatment with 0.075 M KCl, lymphocytes were fixed in a mixture of methanol and glacial acetic acid (3:1). These harvesting and processing methods have been previously established and tested in our laboratory.
Chromosomal preparations and slide scoring
Fifty microliters of cell suspension was dropped onto a slide humidified in a water bath at 70°C. The slides were then dried by placing them on a metal hot plate, as described by Henegariu et al. (16) with some modifi ca-tions. Metaphase spreads were stained with 5% Giemsa solution and air-dried.
For scoring, at least 500 complete metaphase cells with 46 centromeres were counted per sample. In addition to dicentrics, the numbers of centric rings, excess acentric fragments and chromosome breaks were recorded. Slides from each culture were scored by three independent investigators using conventional light microscopes (Leica DME 13595, Germany).
Statistical analyses
Dose-response calibration curves were constructed with the CABAS Software version 2.0 and Dose Estimate software version 4.1.
To determine whether dicentric frequency followed a Poisson distribution as expected for acute X-ray irradia-tion, the dispersion index (s2/y) and the normalized unit of
this index (u) were obtained for each dose using an equation described in the IAEA manual whereNindicates the number of cells analyzed and X is the number of dicentrics detected.
u¼ s 2
y 1
ffiffiffiffiffiffiffiffiffiffiffiffiffiffiffiffiffiffiffiffiffiffiffiffiffiffiffiffi
N 1
2ð1 1 XÞ s
Dispersion index values close to 1 and u values between ±1.96 indicate conformity with the Poisson
distribution. Values of u higher than 1.96 indicate an overdispersion of data, whereasuvalues lower than–1.96 indicate an underdispersion (1,11).
The goodness-of-fit and the chi-squared tests for homogeneity were performed with CABAS and Dose Estimate software. In order to correlate the dose delivered and dicentric frequency, Pearson’s correlation was deter-mined at the 5% or Pp0.05 level of significance.
Results
After in vitro irradiation with X-rays produced by the linear accelerator, a total of 7,871 metaphase spreads were counted, and all unstable chromosomal aberrations found were recorded. Data obtained following exposure to seven different radiation doses are shown in Table 1.
For each type of chromosome aberration, Pearson’s correlation coefficients were calculated. Table 2 shows the
Table 1.Cytogenetic effects of acute LINAC X-ray irradiation in lymphocytes from human blood samples.
Dose (Gy) Cells scored Dicentrics Centric rings Acentric rings Minutes Excess acentrics
0.0 3000 3 0 0 0 9
0.25 1504 9 1 0 0 20
0.5 1039 27 2 2 6 29
1.0 768 51 2 0 2 47
1.5 500 64 5 1 5 40
2.0 560 163 7 5 3 93
3.0 500 258 14 1 7 173
Table 2.Frequencies and distributions of dicentrics in human lymphocytes after acute LINAC X-ray irradiation with a range of doses.
Distribution of dicentrics
Dose (Gy) Cells scored Dicentrics 0 1 2 3 4 s2/y utest
0 3000 3 2997 3 0 0 0 1.00 –0.05
0.25 1504 9 1495 9 0 0 0 0.99 –0.17
0.5 1039 27 1013 25 1 0 0 1.05 1.12
1.0 768 51 719 47 2 0 0 1.01 0.24
1.5 500 64 440 56 4 0 0 1.00 –0.05
2.0 560 163 429 105 21 4 1 1.19 3.14a
3.0 500 258 306 138 49 6 1 1.05 0.79
number of cells scored, the frequency of dicentrics, their distribution, the dispersion index (s2/y), and theuindex.
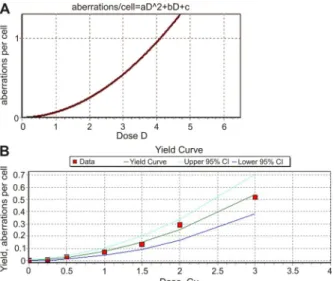
Figure 1 shows the dose-response calibration curves generated by the CABAS (A) and Dose Estimate (B) programs and calculated using the dicentric yields induced by incremental doses of X-irradiation generated by the linear accelerator. The curvefitted by the Dose Estimate program includes 95% CIs with upper and lower limits. The resultanta
and b linear and quadratic yield parameters of the fitted curves and goodness-of-fit test results are shown in Table 3.
Discussion
As expected, the yield of dicentrics increased with radiation dose, showing increments that were clearly dose-dependent (r=0.9680). Other chromosomal abnor-malities observed (e.g., centric rings and excess frag-ments) also exhibited a dose-dependent response, but have been included only for completeness. They are not normally used in biodosimetry, and therefore we have not shownfitted curves for that data.
The yield of dicentrics for gamma and X-rays, which are both low with LET radiation, and where the ionizing events are sparsely distributed among cells, followed a
Poisson distribution. This result is consistent with a random distribution of cellular and molecular damage (17,18). From Table 2, it can be seen that the dispersion index values were close to 1, whileuvalues were between
±1.96, confirming that almost all data points were consistent with a Poisson distribution. However, for the 2 Gy dose, the dicentric distribution was significantly overdispersed. The overdispersion of data can be caused by nonhomogeneous irradiation of blood samples, result-ing in nonuniformity of radiation effects. This is not uncommon for high doses, and has been reported by others for low LET radiation (2,18–22). In this study, the overdispersion can be accounted for by just one cell with four dicentrics.
In Figure 1, the coefficients of the dose-response curve were calculated using CABAS and Dose Estimate programs, which are based on the ML and IRLS methods, respectively. It has been pointed out that for data that have a truly Poisson distribution, the ML and IRLS methods should give the same results, with only slight differences observed in the standard errors of theaandb
coefficients (7). This was certainly evident in this study where CABAS data fitted to Y=C+aD+bD2, where
Y=(0.001±0.007)+(0.013±0.007)D+(0.056±0.004)D2;
and the Dose Estimate data fitted to Y=(0.001±0.009)+
(0.013±0.009)D+(0.056±0.006)D2.
In the present study, the goodness-of-fit test for the dicentric calibration curves indicated that the data were well represented by the linear-quadratic model (w2=7.19, degrees of freedom=4, P=9.487). Moreover, values of correlation coefficients close to 1.0 (0.7pro1) indicated a very strong relationship between thefitted data points.
As previously emphasized, the radiation-induced dicentric yield is also determined by the energy, so that it is interesting to compare the curves obtained for different types of radiation (4,5). With this intention, Table 4 shows the results of the present study compared with results obtained by other groups using different types of low LET radiation, i.e., 100-250 kVp X-rays and gamma-radiation (60Co and 137Cs). Comparing these different dose-response calibration curves, it is possible to notice a certain degree of variability in the fitted coefficients (aandb) for the different radiations.
Several factors are known to have an impact on the resulting calibration curves, such as differences in the lymphocyte donors and culture protocols, slide
Table 3.Comparison of linear and quadratic yield coefficients and goodness-of-fit parameters calculated with the CABAS and the Dose Estimate programs.
Program C±SE a±SE b±SE w2 DF P r
CABAS 0.001±0.007 0.013±0.007 0.056±0.004 7.19 4 9.487
-Dose Estimate 0.001±0.009 0.013±0.009 0.056±0.006 7.19 4 9.487 0.99
C: background frequency of dicentrics; SE: standard error; DF: degree of freedom; r: coefficient of correlation. Figure 1. Dose-response calibration curve for dicentric yields
preparation and scoring criteria. Therefore, to increase the accuracy of dose estimation, each laboratory should have its own calibration curve. Moreover, factors like the type of radiation, energy, and dose rate employed, all directly influence the values ofaandb, considering the respective relative biological effectiveness (RBE) of different ener-gies for producing dicentric chromosomes (5,11,20,23).
Even though X-ray radiation was used in the present study, it does not follow that theaandbparameters of our dose-response curve would be similar to thosefitted for X-ray standard calibration curvesfitted by Lloyd et al. (19), Schröder and Heimers (18), Prasanna et al. (4), and Beinke et al. (23) who all used orthovoltage X-rays.
Table 4 clearly illustrates how the linear coefficient is influenced by radiation quality, tending to be reduced at higher energies. This demonstrates very clearly how this biological assay endpoint has the ability to discriminate among differing relative effectiveness of low LET radiation, particularly at lower doses, which is regarded by the radiological protection community to have a weighting factor of 1.0. Indeed,fitted coefficients are more similar to
a andb values obtained for the gamma-radiation curves (60Co and 137Cs sources), which have a higher energy than conventional X-rays.
Table 5 compares the data from this study with the other published calibration curves for LINAC X-rays. The coefficients were refitted with CABAS and Dose Estimate to ensure that the differences presented were not artifacts caused by the necessary assumptions and approxima-tions of other curve-fitting programs.
The data shown in Table 5 revealed an exception to the trend shown in Table 4 of the a coefficient being increased at lower energies. In contrast to our present LINAC curves, the a coefficient of Dossou et al. (24), despite being the response to 18.0 MV, is higher and more similar to those found with orthovoltage X-rays rather than gamma sources. A high alpha term is consequently accompanied by a low b coefficient; this is sometimes referred to as the‘‘see-saw’’effect.
The beta term is influenced by the applied dose rate whereas the alpha term is LET dependent, thus the reason for this divergence in fitted coefficients probably
Table 4. Comparison of linear and quadratic yield coefficients for dicentric aberrations induced by 100-250 kVp X-rays, gamma-radiation and LINAC X-rays (present study).
References Source Energy (MeV) Gy/min a±SE b±SE
Schröder and Heimers (18) X-rays (100 kVp) 0.1 (max) 0.4 0.035±0.006 0.070±0.007
Beinke et al. (23) X-rays (240 kVp) 0.24 (max) 1.0 0.043±0.006 0.063±0.004
Lloyd et al. (19) X-rays (250 kVp) 0.25 (max) 1.0 0.036±0.005 0.067±0.002
Prasanna et al. (4) X-rays (250 kVp) 0.25 (max) 0.059±0.014 0.029±0.005
Present study Linear accelerator (X-rays) 6.0 (max.) 0.5 0.013±0.007a 0.056±0.004
0.013±0.009b 0.056±0.006
Bauchinger (25) 60Co 1.25 0.02 0.010±0.004 0.042±0.003
0.5 0.011±0.004 0.056±0.003
Lloyd et al. (19) 60Co 1.25 0.5 0.014±0.004 0.076±0.003
Barquinero et al. (20) 60Co 1.25 1.18-1.07 0.021±0.005 0.063±0.004
Köksal et al. (21) 60Co 1.25 0.4 0.021±0.006 0.071±0.002
Edwards et al. (26) 60Co 1.25 - 0.018±0.003 0.060±0.006
Lindholm et al. (27) 60Co 1.25 - 0.013±0.004 0.054±0.003
Prasanna et al. (4) 60Co 1.25 1.0 0.098±0.021 0.044±0.009
Martins et al. (2) 60Co 1.25 0.18-0.13 0.010±0.003 0.048±0.002
Wong et al. (12) 60Co 1.25 - 0.026±0.005 0.039±0.003
Stricklin et al. (11) 137Cs 0.66 0.4 0.013±0.007 0.065±0.003
SE: Standard error.aFitted by CABAS;bFitted by Dose Estimate.
Table 5.Comparison offitted linear and quadratic yield coefficients for dicentric aberrations induced by LINAC X-rays.
References Source Energy (MeV-max) Gy/min a±SE b±SE
Present study Linear accelerator (X-rays) 6 0.5 0.013±0.007a 0.056±0.004
0.013±0.009b 0.056±0.006
Dossou et al. (24) Linear accelerator (X-rays) 18 0.16 0.052±0.010 0.037±0.003
lies in the dose rate used by investigators, since decreasing the dose rate changes the shape of the calibration curves as the linear coefficient tends to dominate (25–28). It arises from the increased time over which the irradiation is delivered, allowing time for DNA repair.
According to the multi-hit model, by prolonging the time of irradiation the chromosome break produced by the
first track is already repaired when the second one crosses the cell, so that the chromosomes are unable to form an exchange aberration by nonhomologous end joining. Therefore, the dicentric frequency per unit dose is decreased at lower doses. This is particularly evident at higher doses where many more ionizing tracks cross the cell so that the likelihood of two-track exchanges is much greater and is described by a dose-squared term (bD2) (1).
It is generally accepted that biodosimetry laboratories should produce several curves to cover all the radiations likely to be involved in accidents. Considering the similarity between the values offittedaandbcoefficients in the present study at a dose-rate of 0.5 Gy/min of 6 MV LINAC, and thosefitted for acute 60Co and137Cs dose-response curves, one can conclude that some of these curves have a good biological equivalence.
According to Roch-Lefèvre et al. (29), the practical importance of knowing the parameters related toin vitro irradiation conditions is to determine long-term risks and hazardous effects of ionizing radiation on the health of exposed individuals. Those authors used biodosimetry in lymphocytes to assess the outcome of radiotherapy in patients treated with 60Co and LINACs using the same calibration curve. They found a strong correlation between the size of radiotherapy target field and the yield of
radiation-induced chromosome aberrations, indicating that late toxic effects of radiotherapy might be determined by such cytogenetic assessment.
Given the similarity of the curve coefficients obtained in the present study with published values for gamma radiation, rather than orthovoltage X-rays, it follows that curves obtained for LINAC radiation have the potential to be used in radiotherapy as an additional means of quality control of the delivered absorbed dose and physical dosimetry. This curve may also be useful for in vitro dose reconstruction after accidental occupa-tional exposures involving high energy X-rays, which is the basic recommendation in radiological emergency programs.
In conclusion, both the energy of the radiation and the dose rate are important considerations when constructing calibration curves for biodosimetry. Given the paucity of published LINAC X-ray data, additional study of the similarities and differences of these parameters, such as attempting to distinguish between the relative effects of energy versus dose rate, is necessary. The
goodness-of-fit results for the dose-response calibration curves generated by CABAS and Dose Estimate software show that both programs can be used to investigate absorbed doses.
Acknowledgments
Research supported by Coordenac¸ão de Apoio Pessoal de Nível Superior (CAPES), Fundac¸ão de Amparo à Ciência e Tecnologia do Estado de Pernambuco (FACEPE) and Conselho Nacional de Desenvolvimento Científico e Tecnológico (CNPq).
References
1. IAEA (International Atomic Energy Agency). Cytogenetic dosimetry: Applications in preparedness for and response to radiation emergencies. Vienna: Scientific and Technical Publications; 2011.
2. Martins V, Antunes AC, Monteiro GO. Implementation of a dose-response curve for gamma-radiation in the Portuguese population by use of the chromosomal aberration assay.Mutat Res2013; 750: 50–54, doi: 10.1016/j.mrgentox.2012.09.009. 3. Pinto MM, Santos NF, Amaral A. Current status of
biodosi-metry based on standard cytogenetic methods. Radiat Environ Biophys 2010; 49: 567–581, doi:
10.1007/s00411-010-0311-3.
4. Prasanna PGS, Loats H, Gerstenberg HM, Torres BN, Shehata CW, Duffy KL.AFRRI’s Gamma-ray, X-ray, andfission-neutron calibration curves for the lymphocyte dicentric assay: applica-tion of a Metaphase Finder System. Bethesda: Armed Forces Radiobiology Research Institute; 2002.
5. Vinnikov VA, Maznyk NA. Cytogenetic dose-response
in vitrofor biological dosimetry after exposure to high doses of gamma-rays.Radiat Prot Dosimetry2013; 154: 186–197,
doi: 10.1093/rpd/ncs200.
6. Deperas J, Szluinska M, Deperas-Kaminska M, Edwards A, Lloyd D, Lindholm C, et al. CABAS: a freely available PC program for fitting calibration curves in chromosome aberration dosimetry. Radiat Prot Dosimetry 2007; 124: 115–123, doi: 10.1093/rpd/ncm137.
7. Ainsbury EA, Lloyd DC. Dose estimation software for radiation biodosimetry.Health Phys2010; 98: 290–295, doi: 10.1097/01.hp.0000346305.84577.b4.
8. Ainsbury EA, Barquinero JF. Biodosimetric tools for a fast triage of people accidentally exposed to ionising radiation. Statistical and computational aspects.Ann Ist Super Sanita
2009; 45: 307–312.
9. Wang H, Liu Q, Wan D, Xiang J, Du L, Wang Y, et al. Bio-Doser: improved dose-estimation software for biological radiation dosimetry. Comput Methods Programs Biomed
2012; 108: 402–406, doi: 10.1016/j.cmpb.2012.03.010.
10. Wilkins RC, Romm H, Kao TC, Awa AA, Yoshida MA, Livingston GK, et al. Interlaboratory comparison of the dicentric chromosome assay for radiation biodosimetry in mass casualty events.Radiat Res2008; 169: 551–560, doi:
11. Stricklin D, Arvidsson E, Ulvsand T. Establishment of bio-dosimetry at FOI: dicentric assay protocol development and
137Cs dose response curve. Umeå: FOI-R-1570-SE,
Swedish Defence Research Agency; 200.
12. Wong KF, Siu LL, Ainsbury E, Moquet J. Cytogenetic bio-dosimetry: what it is and how we do it.Hong Kong Med J
2013; 19: 168–173.
13. Zubizarreta EH, Poitevin A, Levin CV. Overview of radio-therapy resources in Latin America: a survey by the Inter-national Atomic Energy Agency (IAEA). Radiother Oncol
2004; 73: 97–100, doi: 10.1016/j.radonc.2004.07.022.
14. Falk S. Principles of cancer treatment by radiotherapy.
Surgery 2003; 21: 269–272, doi: 10.1383/surg.21.11.269.
22298.
15. United Nations Scientific Committee on the Effects of Atomic Radiation. Sources and effects of ionizing radiation. New York: UNSCEAR; 2000. http://www.unscear.org/unscear/en/ publications/2000_1.html.
16. Henegariu O, Heerema NA, Lowe WL, Bray-Ward P, Ward DC, Vance GH. Improvements in cytogenetic slide preparation: controlled chromosome spreading, chemical aging and gradual denaturing.Cytometry2001; 43: 101–109,
doi: 10.1002/1097-0320(20010201)43:2%3C101::aid-cyto 1024%3E3.3.co;2-#.
17. Edwards AA, Lloyd DC, Purrott RJ. Radiation induced chromosome aberrations and the Poisson distribution.
Radiat Environ Biophys 1979; 16: 89–100, doi: 10.1007/ bf01323216.
18. Schröder H, Heimers A. Chromosome aberrations induced in human lymphocytes byin vitroandin vivoX-rays.Mutat Res 2002; 517: 167–172, doi: 10.1016/s1383-5718(02)
00067-0.
19. Lloyd D, Edwards AA, Prosser JS. Chromosome aberrations induced in human lymphocytes by in vitro acute X and gamma radiation.Radiat Prot Dosim1986; 15: 83–88, doi:
10.1080/09553008614550511.
20. Barquinero JF, Barrios L, Caballin MR, Miro R, Ribas M, Subias A, et al. Establishment and validation of a dose-effect curve for gamma-rays by cytogenetic analysis.Mutat Res
1995; 326: 65–69, doi: 10.1016/0027-5107(94)00150-4.
21. Köksal G, Pala FS, Dalci DO.In vitrodose-response curve for chromosome aberrations induced in human lymphocytes by60Co gamma-radiation.Mutat Res1995; 329: 57–61, doi:
10.1016/0027-5107(95)00019-f.
22. Jamal N, Rahim A, Yusof N, Bo NNL, Talib Y, Napiah JM, et al. Establishment ofin-vitro60Co dose calibration curve for dicentrics in National biodosimetry laboratory of Malaysia.
Proceedings of the World Congress on Medical Physics and Biomedical Engineering. Munich 2009. p 578–581, doi: 10.1007/978-3-642-03902-7_166.
23. Beinke C, Braselmann H, Meineke V. Establishment of an X-ray standard calibration curve by conventional dicentric analysis as prerequisite for accurate radiation dose assessment.Health Phys2010; 98: 261–268, doi: 10.1097/
hp.0b013e3181b35a53.
24. Dossou J, M’kacher R, Bridier A, Girinsky T, Violot D, Legal JD, et al. [Validation of biological dosimetry in patients conditioned with total body irradiation: conventional cytoge-netics and in situ hybridization (FISH)].Cancer Radiother
2000; 4: 399–407, doi: 10.1016/s1278-3218(00)00013-5.
25. Bauchinger M. Microdosimetric aspects of the induction of chromosome aberrations. In: Ishihara T and Sasaki MS (Editors),Radiation induced chromosome damage in man.
New York: Alan R. Liss, Inc.; 1983.
26. Edwards AA. The use of chromosomal aberrations in human lymphocytes for biological dosimetry.Radiat Res1997; 148: S39–S44, doi: 10.2307/3579715.
27. Lindholm C, Luomahaara S, Koivistoinen A, Ilus T, Edwards AA, Salomaa S. Comparison of dose-response curves for chromosomal aberrations established by chromosome painting and conventional analysis.Int J Radiat Biol1998; 74: 27–34, doi: 10.1080/095530098141690.
28. Romm H, Oestreicher U, Kulka U. Cytogenetic damage analysed by the dicentric assay.Ann Ist Super Sanita2009; 45: 251–259, doi: 10.1016/j.radmeas.2011.05.038.
29. Roch-Lefèvre S, Pouzoulet F, Giraudet AL, Voisin P, Vaurijoux A, Gruel G, et al. Cytogenetic assessment of heterogeneous radiation doses in cancer patients treated with fractionated radiotherapy.Br J Radiol2010; 83: 759–766, doi: