Sci. Agric. (Piracicaba, Braz.),v.61, n.1, p.47-52, Jan./Fev. 2004
LEAF AREA PREDICTION MODELS FOR
Zinnia elegans
JACQ.,
Zinnia haageana
REGEL AND ‘PROFUSION CHERRY’
Ana Christina Rossini Pinto1; Teresinha de Jesus Deléo Rodrigues1*; José Carlos Barbosa2; Izabel Cristina Leite1
1
UNESP/FCAV Depto. de Biologia Aplicada à Agropecuária, Via de Acesso Prof. Paulo Donato Castellane, s/n 14884-900 - Jaboticabal, SP - Brasil.
2
UNESP/FCAV - Depto. de Ciências Exatas. *Corresponding author <tedelro@fcav.unesp.br >
ABSTRACT: Leaf area measurements are of value in physiological and agronomic studies. The use of prediction models to estimate leaf area is a simple, accurate and nondestructive method. The present work suggests leaf area prediction models for Zinnia elegans (‘Liliput’ and ‘Thumbelina’), Z. haageana (‘Carpet Persa’) and Z. elegans x Z. angustifolia (‘Profusion Cherry’), potential flower potplant cultivars. At the stages of visible apical flower bud and flowering, 250 and 300 leaves were collected from greenhouse grown plants, respectively, at each season (fall, winter, spring and summer), totaling 1,000 and 1,200 leaves, for each developmental stage. The maximum length (L), maximum width (W) and real leaf area (RLA) were measured with a Digital Image Analysis System – Delta T Devices. The relation between RLA and the product of length by width (LW), was studied through linear models, for each cultivar, at each developmental stage. The models for the flower bud stage were: RLA = 0.0009 + 0.7765 LW (‘Profusion Cherry’), RLA = 0.0021 + 0.8156 LW (‘Thumbelina’), RLA = 0.0031 + 0.8003 LW (‘Liliput’), RLA = 0.0036 + 0.7719 LW (‘Carpet Persa’), and for flowering stage: RLA = 0.0029 + 0.7899 LW (‘Profusion Cherry’), RLA = 0.8318 LW (‘Thumbelina’), RLA = 0.001 + 0.8417 LW (‘Liliput’), RLA = 0.0042 + 0.723 LW (‘Carpet Persa’). Models were considered adequate to estimate leaf area. Key words: floriculture, potted plants, linear regression
MODELOS PARA ESTIMATIVA DA ÁREA FOLIAR DE
Zinnia elegans
JACQ.,
Zinnia haageana
REGEL E ‘PROFUSION CHERRY’
RESUMO: A determinação da área foliar é importante em estudos fisiológicos e agronômicos. O uso de modelos para estimativa da área foliar é um método simples, de boa precisão e não destrutivo. O presente trabalho determina modelos para estimativa da área foliar de Zinnia elegans (‘Liliput’ e ‘Thumbelina’), Z. haageana (‘Carpet Persa’) e Z. elegans x Z. angustifolia (‘Profusion Cherry’), cultivares ornamentais com potencial para produção em vaso. Foram coletadas 250 e 300 folhas, respectivamente, nos estádios de gema florífera apical visível e de floração, de plantas cultivadas em casa de vegetação, em cada estação (outono, inverno, primavera e verão), totalizando 1000 e 1200 folhas, para cada estádio de desenvolvimento. Determinaram-se o comprimento (C) e a largura (L) máximas e a área foliar real (AFR), com auxílio de um sistema de análise de imagem digital – Delta T Devices. Estudaram-se as relações existentes entre a AFR e o produto do comprimento pela largura da folha (CL), por modelos de regressão linear, para cada cultivar, em cada estádio de desenvolvimento. Os modelos, para o estádio de gema florífera, AFR = 0,0009 + 0,7765 CL (‘Profusion Cherry’), AFR = 0,0021 + 0,8156 CL (‘Thumbelina’), AFR = 0,0031 + 0,8003 CL (‘Liliput’), AFR = 0,0036 + 0,7719 CL (‘Carpet Persa’), e para o estádio de floração, AFR = 0,0029 + 0,7899 CL (‘Profusion Cherry’), AFR = 0,8318 CL (‘Thumbelina’), AFR = 0,001 + 0,8417 CL (‘Liliput’), AFR = 0,0042 + 0,723 CL (‘Carpet Persa’), são adequados para estimar a área foliar real.
Palavras-chave: floricultura, plantas envasadas, regressão linear
INTRODUCTION
Leaf area measurements are of value in physi-ological and agronomic studies (Miller et al., 1956; McKee, 1964; Pereira & Machado, 1987; Van Volkenburgh, 1994). Among the various methods to measure leaf area (Evans, 1972, Causton & Venus, 1981, Norman & Campbell, 1991), the nondestructive
Sci. Agric. (Piracicaba, Braz.),v.61, n.1, p.47-52, Jan./Fev. 2004
The use of regression equations to estimate leaf area is a nondestructive, simple, quick, accurate, reliable and not expensive method. The usual procedure of this method involves measuring lengths, widths, and areas of a sample of leaves and then calculating the several pos-sible regression coefficients, or leaf factors, to estimate areas of subsequent samples (Wiersma & Bailey, 1975). Accurate and simple mathematical models eliminate the need for leaf area meters or time-consuming, geometric reconstructions (Gamiely et al., 1991).
Several prediction models have been determined to estimate leaf area for numerous crops, but little infor-mation is available for Zinnia elegans Jacq. (Barbosa et al., 1996) and none for Zinnia haageana and zinnia in-terspecific hybrids. Leaves are formed in a characteristic pattern for each species, demanding specific leaf shape (Sinha, 1999). Therefore, prediction models must be de-termined for each species, and for cultivars of a given spe-cies which presents different leaf shape.
Zinnias are popular garden flowers, cultivated worldwide (Stimart et al., 1987, Linderman & Ewart,1990). Their ornamental value as cut flowers is well-known (Boyle & Stimart, 1983) and, currently they are also used in containers, patio pots and windowboxes in countries of Northern hemisphere.
More recently, potted zinnias appeared in the São Paulo State flower market, and some new cultivars are making zinnia a promise as a flowering pot plant. ‘Pro-fusion Cherry’ is a dwarf, compact interspecific hybrid plant for garden, patio and pot (Sakata, 2001). In Brazil, ‘Profusion Cherry’ could represent an important new hy-brid for the potplant flower market. Zinnia haageana ‘Persian Carpet’, Z. elegans ‘Thumbelina’ and ‘Liliput’ are dwarfs and low growing garden plants (Metcalf & Sharma, 1971). The objective of this study was develop-ing regression models that would accurately predict leaf areas, a helpful tool for future physiological and agro-nomic studies of these zinnia cultivars.
MATERIAL AND METHODS
Leaves were collected from plants grown in a polyethylene-covered greenhouse, in Jaboticabal (21°15’22’’ S, 48°15’18’’ W; mean altitude 610 m), SP, Brazil. Local climate is Cwa, after Köppen’s classifica-tion, subtropical humid type (Volpe et al., 1989).
Zinnia haageana Regel‘Carpet Persa’, Z. elegans Jacq. ‘Thumbelina’ and ‘Liliput’, and ‘Profusion Cherry’ (interspecific hybrid of Z. elegans and Z. angustifolia HBK) were sown in polystyrene plug trays (model CM 128-62) containingcommercial media and transplanted to pots when the second nodal leaves were fully ex-panded. Plants were kept under natural photoperiod, at minimum, maximum and mean temperatures of 6.0, 37.5 and 23.8 ± 1°C in the fall; 2.5, 38.0 and 21.4 ± 1°C in
the winter; 17.8, 43.0 and 28.2 ± 1°C in the spring; and 19.0, 40.0 and 28.4 ± 1°C in the summer. Daily relative humidities varied from 28 to 99 % in the fall; 26 to 95 % in the winter; 33 to 96 % in the spring; and 40 to 99 % in the summer. Weekly evaluations carried with a steady state porometer (Li-Cor, Model LI-1600) during the production cycle pointed mean maximum pho-tosynthetic photon flux inside the greenhouse equal to 565.1 µmol m-2 s-1 in the fall; 499.4 µmol m-2 s-1
in the winter; 898.6 µmol m-2 s-1 in the spring; and
870.4 µmol m-2 s-1 in the summer.
At each season (fall, winter, spring and summer), potted plants were arranged in sixteen treatments (com-bination of two pot sizes, two growing systems and four cultivars), in a completely randomized design (n = 4). Growing systems (free sprout of all plant buds or remov-ing apical flower bud to estimulate side branch growth) were applied when apical flower bud presented between 3-5 mm in length. Plants were developed, respectively, in two plastic pots, 0.60 and 1.3 L, with one plant per pot, filled with commercial growing media and fertilized with Osmocote SierraScotts 15-10-10 + micro, 1.08 g per
0.6 L pot and 1.98 g per 1.3 L pot.
Linear regression models were developed to pre-dict leaf area for the apical flower bud (3-5 mm in length) and flowering (inflorescence with ray florets completely open) stages; 250 and 300 leaves, were collected at ran-dom, respectively, from the apical flower bud and flow-ering stages, at each season, totaling 1,000 and 1,200 leaves per each developmental stage, for each zinnia spe-cies. Sampled leaves represented the full spectrum of measurable leaf sizes presented at the developmental stage, and did not present any damage and deformation caused by diseases, insects or other external factors.
Leaf length (L; cm) was measured along the lamina midrib, from the point of lamina attachment to the tip, and leaf width (W; cm) was measured perpendicu-larly to lamina midrib, from tip to tip at the widest part of the lamina. The real leaf area (RLA) was determined for each lamina with a Digital Image Analysis System – Delta T Devices, calibrated to 1.0 mm2.
culti-Sci. Agric. (Piracicaba, Braz.),v.61, n.1, p.47-52, Jan./Fev. 2004
vars, at each developmental stage, the F test was applied, obtained by the difference between the residual sum of squares of the model that considered the different coeffi-cients for each cultivar against the model which cultivar effects were not considered (Seber, 1977).
RESULTS AND DISCUSSION
No differences between leaf shape of plants from different growing systems or pot size were observed, at all developmental stages, for ‘Profusion Cherry’, Zinnia elegans ‘Thumbelina’ and ‘Liliput’ and Zinnia haageana ‘Carpet Persa’. Evaluations of the coefficients of deter-mination (R2), F ratio for model adjustment (Ftest
model),
and mean square error (MSE) of analysis of variance to test models, for each calculated regression, indicated that the obtained models accurately predict leaf areas for ‘Pro-fusion Cherry’, ‘Thumbelina’, ‘Liliput’ and ‘Carpet Persa’, at the studied developmental stages (Tables 1, 2, 3 e 4). All coefficients of determination were greater than 0.95, the F test for models adjust were significant P = 0.01, and the mean square errors were lower.
In practice, because of model simplicity, high co-efficient of determination values, and mean square errors very close to the linear model (Y=a+bX), it is
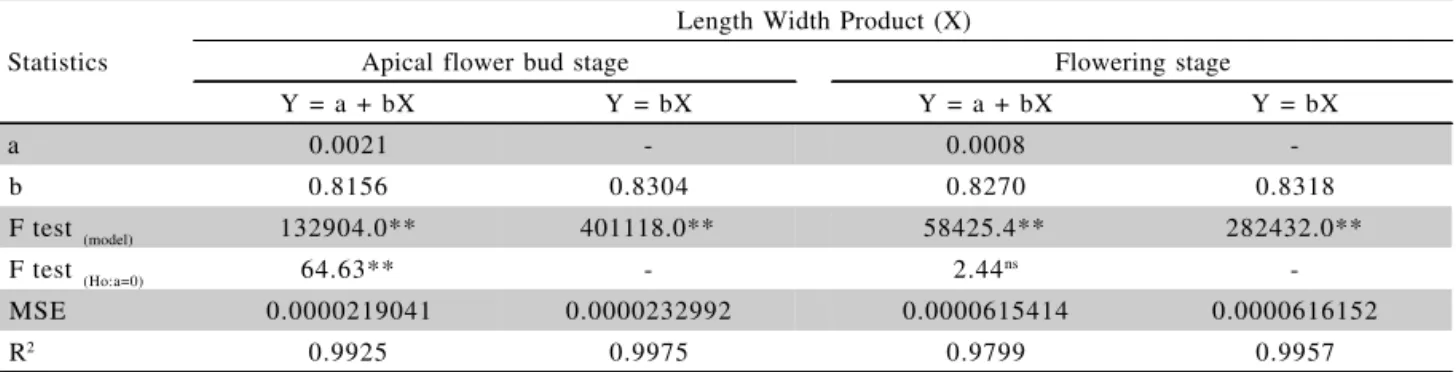
recom-mended, for ‘Thumbelina’, at the flowering stage, adop-tion of the model RLA = 0.8318 LW, in detriment to model RLA = 0.0008 + 0.8270 LW (Table 2). Since the F test for the null hypothesis (H0:a = 0) compared against the alternative hypothesis (Ha: a ≠ 0) for the model Y=a + bX was not significant, the intercept does not differ from zero, what justifies the adoption of the linear model without intercept (Y=bX).
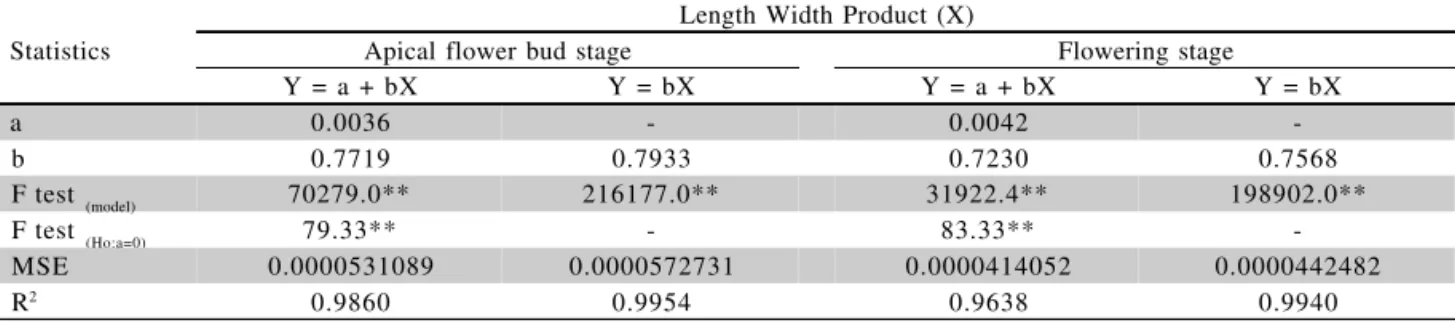
However, for ‘Profusion Cherry’, ‘Liliput’ and ‘Carpet Persa’, for both developmental stages, and for ‘Thumbelina’ at apical flower bud stages, the linear mod-els (Y=a + bX) are recomended. The F test for the hypothesis H0:a = 0 against the alternative hypothesis Ha: a ≠ 0, for the models Y=a + bX, was significant, con-firming the hypothesis that intercept differ from zero (Tables 1, 2, 3 e 4).
Therefore, models RLA = 0.0009 + 0.7765 LW (‘Profusion Cherry’), RLA = 0.0021 + 0.8156 LW (‘Thumbelina’), RLA = 0.0031 + 0.8003 LW (‘Liliput’), RLA = 0.0036 + 0.7719 LW (‘Carpet Persa’) and, for flowering stage, RLA = 0.0029 + 0.7899 LW (‘Profusion Cherry’), RLA = 0.8318 LW (‘Thumbelina’), RLA = 0.001 + 0.8417 LW (‘Liliput’), RLA = 0.0042 + 0.723 LW (‘Carpet Persa’) are recommended to estimate leaf area (Tables 1, 2, 3 and 4). The F tests obtained by
Statistics
Length Width Product (X)
Apical flower bud stage Flowering stage
Y = a + bX Y = bX Y = a + bX Y = bX
a 0.0009 - 0.0029
-b 0.7765 0.7841 0.7899 0.8145
F test (model) 85998.3** 266111.0** 69694.5** 471784.0**
F test (Ho:a=0) 11.99** - 79.69**
-MSE 0.0000197031 0.0000199198 0.0000182850 0.0000194851
R2 0.9885 0.9963 0.9831 0.9975
Table 1 - Linear regression analysis between real leaf area (Y) and the product of length by width (X) for ‘Profusion Cherry’ leaves,for the visible apical flower bud and flowering stages.
**significant at P < 0.01; a and b – regression parameters estimation; F test (model) – F test for models adjust; F test (Ho:a=0) – F test for Ho: a = 0 versus Ha: a ≠ 0; MSE – Mean Square Error of ANOVA to model test; R2 – coefficient of determination.
Statistics
Length Width Product (X)
Apical flower bud stage Flowering stage
Y = a + bX Y = bX Y = a + bX Y = bX
a 0.0021 - 0.0008
-b 0.8156 0.8304 0.8270 0.8318
F test (model) 132904.0** 401118.0** 58425.4** 282432.0**
F test (Ho:a=0) 64.63** - 2.44ns
-MSE 0.0000219041 0.0000232992 0.0000615414 0.0000616152
R2 0.9925 0.9975 0.9799 0.9957
Table 2 - Linear regression analysis between real leaf area (Y) and the product of length by width (X) for Zinnia elegans ‘Thumbelina’ leaves, for the visible apical flower bud and flowering stages.
nsnonsignificant at P > 0.05; ** - significant at P < 0.01; a and b – regression parameters estimation; F test
(model) – F test for models adjust;
Sci. Agric. (Piracicaba, Braz.),v.61, n.1, p.47-52, Jan./Fev. 2004
the difference between the residual sum of squares of the model that considered the different coefficients for each cultivar against the model which cultivars ef-fect was not considered were significant for the apical flower bud (F=98.17**,
P < 0.01) and flowering (F=405.02**,
P < 0.01) stages, indicating that it is not possible to use a single regression model for all stud-ied cultivars.
Coefficients of determination (R2
) indicate that RLA estimated by the chosen models are close to the ar-eas determined by the area meter (Figures 1 to 8). There-fore, 98.85 % and 98.31 % of the variability observed for RLA (Table 1) could be explained by the variability of the product L x W for the ‘Profusion Cherry’ leaf, for the models RLA = 0.0009 + 0.7765 LW (apical flower bud stage) and RLA = 0.0029 + 0.7899 LW (flowering stage). Tables 2 and 3 show that 99.25 % and 97.99 %, and 99.33 % and 99.32 % of the variability observed for leaf area could be explained by the variation of the prod-uct L x W for ‘Thumbelina’ and ‘Liliput’ leaves, respec-tively, for the models RLA = 0.0021 + 0.8156 LW (api-cal flower bud stage) and RLA = 0.8318 LW (flowering stage), and RLA = 0.0031 + 0.8003 LW (apical flower bud) and RLA = 0.001 + 0.8417 LW (flowering stage). Table 4 shows that 98.60 % and 96.38 % of the variabil-ity observed for leaf area could be explained by the prod-uct of L x W for the ‘Carpet Persa’ leaf, for models
RLA = 0.0036 + 0.7719 LW (apical flower bud stage) and RLA = 0.0042 + 0.7230 LW (flowering stage). It is not necessary to establish other more complex regression models in practice.
Defined models could be used to estimate RLA, at the apical flower bud and flowering stages, for the sampled range of L and W for ‘Profusion Cherry’, ‘Thumbelina’, ‘Liliput’ and ‘Carpet Persa’ leaves, as shown in Table 5. The studied range, probably, is rep-resentative for Z. elegans and Z. haageana species, be-cause it includes L and W values mentioned in the lit-erature, for the botanic description of these species (Torres, 1963). In addition, leaves were sampled during the four seasons of the year, covering distinctive envi-ronmental conditions, allowing wide variations in leaf shape. According to Cutter (1987), ligth, temperature and photoperiod affect foliar primordium development, altering leaf shape.
Models based on one single measurement offer the advantages of more efficient data collection, less com-plex calculations (NeSmith, 1992), and require less time for leaf measurement (Robbins & Pharr, 1987). Nonethe-less they were Nonethe-less satisfactory for predicting RLA of ‘Liliput’, ‘Thumbelina’, ‘Carpet Persa’ and ‘Profusion Cherry’ (data not shown). These models had coefficients of determination inferior to those obtained when using the product of length by width (LW).
Table 3 - Linear regression analysis between real leaf area (Y) and the product of length by width (X) for Zinnia elegans ‘Liliput’ leaves, for the visible apical flower bud and flowering stages.
**significant at P < 0.01; a and b – regression parameters estimation; F test (model) – F test for models adjust; F test (Ho:a=0) – F test for Ho: a = 0 versus Ha: a ≠ 0; MSE – Mean Square Error of ANOVA to model test; R2 – coefficient of determination.
Statistics
Length Width Product (X)
Apical flower bud stage Flowering stage
Y = a + bX Y = bX Y = a + bX Y = bX
a 0.0031 - 0.0010
-b 0.8003 0.8135 0.8417 0.8471
F test (model) 147004.0** 431901.0** 173947.0** 707613.0**
F test (Ho:a=0) 59.69** - 9.59**
-MSE 0.0000523179 0.0000553917 0.0000298662 0.0000300802
R2 0.9933 0.9977 0.9932 0.9983
Table 4 - Linear regression analysis between real leaf area (Y) and the product of length by width (X) for Zinnia haageana ‘Carpet Persa’ leaves, for the visible apical flower bud and flowering stages.
**significant at P < 0.01; a and b – regression parameters estimation; F test (model) – F test for models adjust; F test (Ho:a=0) – F test for Ho:
a = 0 versus Ha: a ≠ 0; MSE – Mean Square Error of ANOVA to model test; R2 – coefficient of determination.
Statistics
Length Width Product (X)
Apical flower bud stage Flowering stage
Y = a + bX Y = bX Y = a + bX Y = bX
a 0.0036 - 0.0042
-b 0.7719 0.7933 0.7230 0.7568
F test (model) 70279.0** 216177.0** 31922.4** 198902.0**
F test (Ho:a=0) 79.33** - 83.33**
-MSE 0.0000531089 0.0000572731 0.0000414052 0.0000442482
Sci. Agric. (Piracicaba, Braz.),v.61, n.1, p.47-52, Jan./Fev. 2004
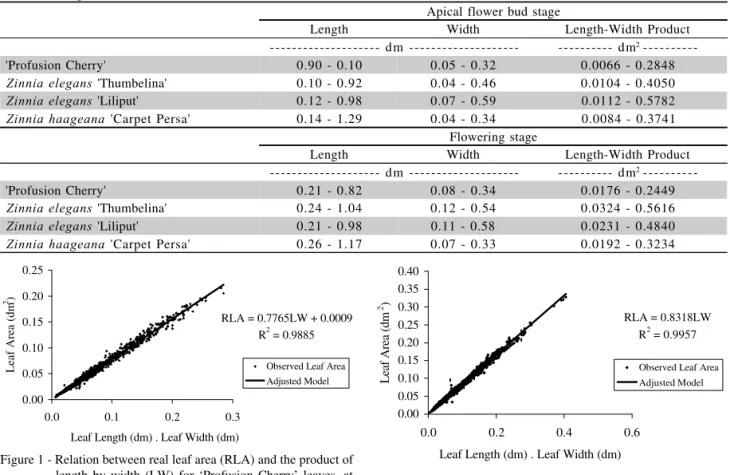
Figure 1 - Relation between real leaf area (RLA) and the product of length by width (LW) for ‘Profusion Cherry’ leaves, at the visible apical flower bud stage.
RLA = 0.7765LW + 0.0009 R2 = 0.9885
0.00 0.05 0.10 0.15 0.20 0.25
0.0 0.1 0.2 0.3 Leaf Length (dm) . Leaf Width (dm)
Leaf Area (dm
2)
Observed Leaf Area Adjusted Model
Figure 2 - Relation between real leaf area (RLA) and the product of length by width (LW) for ‘Profusion Cherry’ leaves, at the flowering stage.
RLA = 0.7899LW + 0.0029 R2 = 0.9831
0.00 0.05 0.10 0.15 0.20 0.25 0.30
0.0 0.1 0.2 0.3
Leaf Length (dm) . Leaf Width (dm)
Leaf Area (dm
2)
Observed Leaf Area Adjusted Model
Figure 3 - Relation between real leaf area (RLA) and the product of length by width (LW) for Zinnia elegans ‘Thumbelina’ leaves, at the visible apical flower bud stage.
RLA = 0.8156LW + 0.0021 R2 = 0.9925
0.00 0.05 0.10 0.15 0.20 0.25 0.30 0.35
0.0 0.1 0.2 0.3 0.4 0.5
Leaf Length (dm) . Leaf Width (dm)
Leaf Area (dm
2)
Observed Leaf Area Adjusted Model
Table 5 - Sampled range of leaf length, width and the product of length by width for ‘Profusion Cherry’, Zinnia elegans ‘Thumbelina’ and ‘Liliput’ and Zinnia haageana ‘Carpet Persa’ leaf, for the visible apical flower bud and flowering stages.
Apical flower bud stage
Length Width Length-Width Product
--- dm --- --- dm2
---'Profusion Cherry' 0.90 - 0.10 0.05 - 0.32 0.0066 - 0.2848
Zinnia elegans 'Thumbelina' 0.10 - 0.92 0.04 - 0.46 0.0104 - 0.4050 Zinnia elegans 'Liliput' 0.12 - 0.98 0.07 - 0.59 0.0112 - 0.5782 Zinnia haageana 'Carpet Persa' 0.14 - 1.29 0.04 - 0.34 0.0084 - 0.3741
Flowering stage
Length Width Length-Width Product
--- dm --- --- dm2
---'Profusion Cherry' 0.21 - 0.82 0.08 - 0.34 0.0176 - 0.2449
Zinnia elegans 'Thumbelina' 0.24 - 1.04 0.12 - 0.54 0.0324 - 0.5616 Zinnia elegans 'Liliput' 0.21 - 0.98 0.11 - 0.58 0.0231 - 0.4840 Zinnia haageana 'Carpet Persa' 0.26 - 1.17 0.07 - 0.33 0.0192 - 0.3234
Figure 4 - Relation between real leaf area (RLA) and the product of length by width (LW) for Zinnia elegans ‘Thumbelina’ leaves, at the flowering stage.
RLA = 0.8318LW R2 = 0.9957
0.00 0.05 0.10 0.15 0.20 0.25 0.30 0.35 0.40
0.0 0.2 0.4 0.6
Leaf Length (dm) . Leaf Width (dm)
Leaf Area (dm
2)
Observed Leaf Area Adjusted Model
Sci. Agric. (Piracicaba, Braz.),v.61, n.1, p.47-52, Jan./Fev. 2004
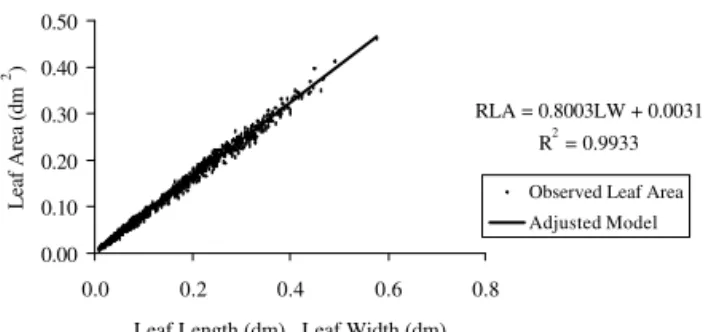
Figure 6 - Relation between real leaf area (RLA) and the product of length by width (LW) for Zinnia elegans ‘Liliput’ leaves, at the flowering stage.
RLA = 0.8417LW + 0.001 R2 = 0.9932
0.00 0.10 0.20 0.30 0.40 0.50
0.0 0.2 0.4 0.6 0.8 Leaf Length (dm) . Leaf Width (dm)
Leaf Area (dm
2)
Observed Leaf Area Adjusted Model
Received October 22, 2002 Accepted July 21, 2003 Figure 8 - Relation between real leaf area (RLA) and the product of
length by width (LW) for Zinnia haageana ‘Carpet Persa’ leaves, at the flowering stage.
RLA = 0.723LW + 0.0042 R2 = 0.9638
0.00 0.05 0.10 0.15 0.20 0.25 0.30 0.35
0.0 0.1 0.2 0.3 0.4
Leaf Length (dm) . Leaf Width (dm)
Leaf Area (dm
2)
Observed Leaf Area Adjusted Model
Figure 7 - Relation between real leaf area (RLA) and the product of length by width (LW) for Zinnia haageana ‘Carpet Persa’ leaves, at the visible apical flower bud stage.
RLA = 0.7719LW + 0.0036 R2 = 0.986
0.00 0.05 0.10 0.15 0.20 0.25 0.30 0.35
0.0 0.1 0.2 0.3 0.4
Leaf Length (dm) . Leaf Width (dm)
Leaf Area (dm
2 )
Observed Leaf Area Adjusted Model
ACKNOWLEDGMENTS
To CNPq for research grant of first, second and third authors.
REFERENCES
BARBOSA, J.C.; PINTO, A.C.R.; GRAZIANO, T.T. Equações de regressão para estimativa da área foliar de Zinnia elegans Jacq. Científica, v.24, p.319-327, 1996.
BOYLE, T.H.; STIMART, D.P. Developmental responses of Zinnia to photoperiod. Journal of the American Society for Horticultural Science, v.108, p.1053-1059, 1983.
CAUSTON, D.R.; VENUS, J.C. The biometry of plant growth. London: Edward Arnold, 1981. 301p.
CUTTER, E.G. Anatomia vegetal. Parte II – Orgãos. São Paulo: Roca, 1987. 336p.
EVANS, G.C. The quantitative analysis of plant growth. Oxford: Blackwell, 1972. 734p.
GAMIELY, S.; RANDLE, W.M.; MILLS, H.A.; SMITTLE, D.A. A rapid and nondestructive method for estimating leaf area of onions. HortScience, v.26, p.206, 1991.
LINDERMAN, S.D.; EWART, L.C. Interspecific hybridization in zinnia: morphology, cytology, pollen examination, and powdery mildew resistance. Acta Horticulturae, n. 272, p.41-45, 1990.
McKEE, G.W. A coefficient for computing leaf area in hybrid corn. Agronomy Journal, v.56, p.240-242, 1964.
METCALF, H.N.; SHARMA, J.N. Germ plasm resources of the genus Zinnia
L. EconomicBotany, v.25, p.169-181, 1971.
MILLER, E.E.; SHADBOLT, C.A.; HOLM, L. Use of an optical planimeter for measuring leaf area. Plant Physiology, v.31, p.484-486, 1956. NeSMITH, D.S. Estimating summer squash leaf area nondestructively.
HortScience, v.27, p.77, 1992.
NORMAN, J.M.; CAMPBELL, G.S. Canopy structure. In: PEARCY, R.W.; EHLERINGER, J.R.; MOONEY, H.A.; RUNDEL, P.W. (Ed.). Plant physiological ecology: field methods and instrumentation. London: Chapman & Hall, 1991. p.301-325.
PEREIRA, A.R.; MACHADO, E.C. Análise quantitativa do crescimento de comunidades vegetais. Campinas: IAC, 1987. 33p. (Boletim Técnico, 114).
ROBBINS, N.S.; PHARR, D.M. Leaf area prediction models for cucumber from linear measurements. HortScience, v.22, p.1264-1266, 1987. SAKATA’S RELIABLE SEEDS. Flower seed catalogue. California: Sakata
Seed America, 2001. p.58.
SEBER, G.A.F. Linear regression analysis. New York: Jonh Wiley & Sons, 1977. 465p.
SINHA, N. Leaf development in Angiosperms. Annual Review of Plant Physiology and Plant Molecular Biology, v.50, p.419-446, 1999. STIMART, D.P.; BOYLE, T.H.; TERRY-LEWANDOWSKI, V.M. Genetic
and physiological studies of Zinnia elegans, Z. angustifolia and their interspecific hybrids. HortScience, v.22, p.689-691, 1987.
TORRES, A.M. Taxonomy of Zinnia. Brittonia, v.15, p.1-25, 1963. VAN VOLKENBURGH, E. Leaf and shoot growth. In: BOOTE, K.J.;
BENNETT, J.M.; SINCLAIR, T.R.; PAULSEN, G.M. (Ed.) Physiology and determination of crop yield. Madison: ASA, 1994. p.101-120. VOLPE, C.A.; BARBOSA, J.C.; MINCHIO, C.A.; ANDRÉ, R.G. Análise
da precipitação mensal em Jaboticabal-SP. Ciência Agronômica, v.4, p.3-5, 1989.
WENDT, C.W. Use of a relationship between leaf length and leaf area to estimate the leaf area of cotton (Gossypium hirsutum L.), castors (Ricinus communis L.), and sorghum (Sorghum vulgare L.). Agronomy Journal, v.59, p.484-486, 1967.
WIERSMA, J.V.; BAILEY, T.B. Estimation of leaflet, trifoliate, and total leaf areas of soybeans. Agronomy Journal, v.67, p.26-30, 1975.
RLA = 0.8003LW + 0.0031 R2 = 0.9933
0.00 0.10 0.20 0.30 0.40 0.50
0.0 0.2 0.4 0.6 0.8
Leaf Length (dm) . Leaf Width (dm)
Leaf Area (dm
2)
Observed Leaf Area Adjusted Model