Capacity of the mechanical harvesting process of
sugar cane billets
Paulo Rodrigues Peloia
1; Marcos Milan
2*; Thiago Libório Romanelli
21
USP/ESALQ – Programa de Pós-Graduação em Máquinas Agrícolas.
2
USP/ESALQ – Depto. Engenharia de Biossistemas, C.P. 9 – 13418-900 – Piracicaba, SP – Brasil. *Corresponding author <macmilan@esalq.usp.br>
ABSTRACT: The mechanized harvest of sugar cane (Saccharum officinarum L.) in Brazil is an irreversible trend and it comes with a great concern about the quality of the cane delivered to the industry. A key component to quality is the billet length which affects the processing of raw material, cane deterioration, invisible losses and load density of transport vehicles. Thus, due to the importance of the billet standard in quality and cost of raw material, this study aimed to evaluate if the mechanized harvesting of sugar cane can supply the quality requirements for the crushing process, regarding the billet length. A plot with burnt sugar cane (3.2 ha) and another one with green sugar cane (8.0 ha) were selected to be harvested by two (2) self-propelled sugar cane harvesters. For each harvested 0.4 ha a sample from each infield wagon was collected. The sample was composed by ten billets. The variability in burnt sugar cane was higher than in green sugar cane, and both harvesters did not present the capacity of keeping the billets with similar lengths when operating either in burnt or green conditions.
Key words:mechanization,sugar cane harvester, statistical process control
Capacidade do processo de corte de rebolos de cana-de-açúcar
colhidos mecanicamente
RESUMO: A colheita mecanizada de cana-de-açúcar (Saccharum officinarum L.) no Brasil é uma tendência irreversível e junto a ela vem à preocupação com a qualidade da matéria-prima que chega à indústria. O tamanho de rebolos tem influência nessa qualidade por afetar o processo de deterioração da cana, perdas invisíveis e a densidade de carga no transbordo e transporte. Considerando-se a importância do padrão do rebolo na qualidade e custo da matéria-prima, avaliou-se se a colheita mecanizada de cana-de-açúcar pode atender às exigências de qualidade da moagem no que se refere ao indicador tamanho de rebolo. Para tanto, uma área de cana queimada (3,2 ha) e outra de cana crua (8,0 ha) foram selecionadas. As áreas foram colhidas por duas colhedoras automotrizes. Para cada colhedora e área, uma amostra a cada 0,4 ha colhidos foi coletada, junto ao conjunto de transbordo e cada amostra era composta por dez rebolos. Os resultados foram analisados por meio de gráficos de controle, e a capacidade do processo de corte foi determinada. Houve maior variabilidade na condição de cana queimada em relação à cana crua, e que ambas as colhedoras não têm a capacidade de manter os rebolos em tamanhos semelhantes, quando operando nessas duas condições diferentes.
Palavras-chave:mecanização,colheita mecanizada, controle estatístico do processo
Introduction
For continuous improvement of a process the analy-sis of usual variations under the statistical process con-trol (SPC) (with no effect of special variation) is neces-sary in some cases in order to evaluate if it complies with customer specifications. In the SPC theory this methodology is called a process capacity. The first de-velopments of this theory dates back to the early 20th
century, with Shewhart (1925). The application of SPC is a usual practice at the industry. In agriculture, its ap-plication has increased (Fernandes et al., 2000; Milan and Fernandes, 2002) but the determination of process capac-ity is rare. Salvi et al. (2007) is an example of the appli-cation of this technique.
In Brazilian agriculture, sugar cane (Saccharum officinarum L.) has received special attention due to its
potential as a renewable energy source (Santos et al., 2006). In its production the mechanized harvest process is an irreversible trend but the quality of the raw mate-rial delivered to the industry through this process has been an issue of concern and the size of the billets is an item to be considered. Billet length affects the load den-sity of wagons and trucks, the level of sugar cane dete-rioration, the invisible losses, the transport and the in-dustrial process. The shorter the billet the higher the load density, however it increases the possibility of sugar cane deterioration (Ripoli, 1996; Ripoli and Ripoli, 2002). The size of the billet also affects the rate of invisible losses. The smaller the billet, the greater the number of cuts of the stalk, increasing the invisible loss (Neves et al., 2003).
this study aimed to analyze if the mechanized harvest-ing of sugar cane can supply the quality requirements for the crushing process, regarding the billet length in both burnt and green harvested canes.
Material and Methods
The analysis of the process of billet cutting was made by two tools: control charts and studies of capability. Control charts only assess the behavior of the process related to variability, indicating whether it follows a con-sistent pattern (predictable) over time. The statistical theory developed by Shewhart (1925) for calculating the limits of the control charts is based on the idea that the process in study, which is under statistical control, has a statistics W that is calculated from the sample values with a mean μ (W) and a standard deviation σ (W). It will have a probability close to 100% of being in the range of μ (W) ± 3σ (W). Thus, when an observed value is outside the range established by the limits of control, it indicates the presence of a special cause or an assign-able cause. In practice, as μ (W) and σ (W) are unknown, it is necessary to estimate them by sample values ob-tained from the process. Therefore, small samples (sub-groups) are collected periodically, and then estimates of
μ (W) and σ (W) are made.
Capability studies define if the process generates ac-ceptable products in usual operational conditions, regard-ing either the specifications or the customer needs. To check if a process is capable, indexes of capacity that compare customer specifications to the natural variation of the process, given by 6σ, are used. As the value of σ is unknown, in practice it is estimated through sampling.
Data collection was made in a commercial stand of a sugar mill and distillery, in the south-east region of the Sao Paulo state, Brazil, during September, 2006. The basic procedure used in the study was to analyze the pro-cess of harvest in the regular routine of the company, as a prerequisite for the use of control charts and capabil-ity studies. One field of burnt sugarcane (3.2 ha, variety RB72454, 2nd cut, erect stalks) and another one of green (8.0 ha, variety SP80-3280, 4th cut, erect stalks) were se-lected to be harvested, both presenting the same yield (100 tha–1). The harvest was carried out using two
ma-chines here called CA and CB, both manufactured in 2006. The harvester CA and CB had worked 508.8 and 904.1 hours, respectively, before this study. The specifi-cations of the machines during the harvest followed the standards adopted by the sugar mill. The harvesting work speed in the two proposed conditions was kept within the specification limits determined by the com-pany. The operator adjusted the speed within the limits under the working conditions in order to achieve the re-quirements of raw material quality and productivity of the process. Both harvesters were adjusted to chop stalks in smallest possible billets aiming to supply the specifi-cation suggested by the technical staff: billets from 140 to 180 mm. At each field random samples were collected for every harvested 0.4 ha. Each sample was composed
by ten billets, called sample size or subgroup (n = 10). Thus, for each harvester 80 billets were collected and measured for the burnt sugar cane and 200 for the green cane. Samples were collected at the top of the load of the infield transport wagon.
The selected control chart type was x−R (average
by range), and data were analyzed by t and F tests. The process capacity for the stalk chopping was determined by an efficacy index (Cp) according to Montgomery (2004), through the mean value of the sample range as an estimate of the process variance. Cp was estimated through the confidence interval following the method-ology suggested by Lewis (1991) and represented by p. The upper (USL) and the lower specification limits (LSL), 140 and 180 mm, respectively, were used in the determination of the efficacy index.
The determination of the process capacity demands statistical stability and normal distribution of the indi-vidual data. The stability can be proven by the chart of the behavior process and was obtained artificially by the removal of points with special causes. This procedure is not adequate when searching for process improvement in actual work conditions, but is justifiable when used to study the process capacity (Vieira, 1999). Individual data normality was verified by the Anderson-Darling method (α = 0.10). When the data distribution found was not of the normal type, another standardized non-normal distri-bution was found and the values of USL and LSL were replaced, from ±3σ (applied for the normal distributions) by percentiles 0.135 and 99.865 (Ramos, 2000).
Results and Discussion
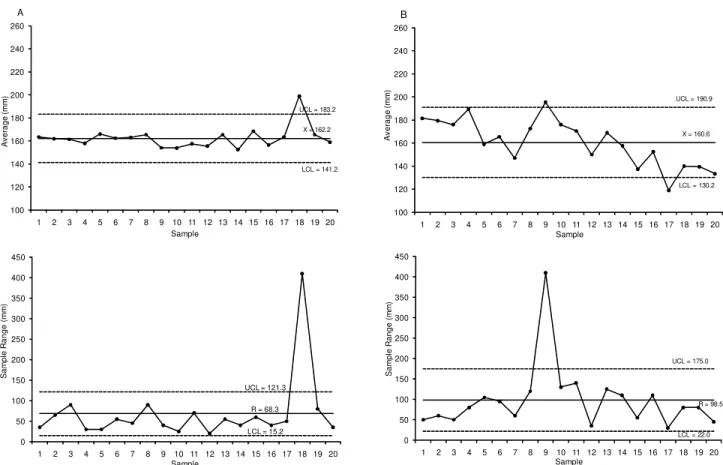
Operating in the green sugar cane field, the harvester CA presented only sample 18 as “non predictable”, in both average and range charts (Figure 1A), indicating that there was external interference on this sample. In this case a sampled billet had a length of 550 mm, which meant that it passed through the internal system of the harvester without being chopped. Also for the green sugar cane, sample 9 of harvester CB was “non predict-able” in both charts, due to a billet with 560 mm for the same reason already mentioned. In the average chart, samples 1 to 4 were too close to the UCL. This indi-cates that something affected the cutting process in the area, such as sugarcane crop characteristics (yield, lodg-ing, variety) or the way the harvester was operated. From sample 9 to 20 one can observe a gradual tendency of length reduction in the billets, which shall be investi-gated and corrected.
Figure 1 – Average of billet length by range in green sugarcane: A) harvester CA; B) harvester CB. 0 50 100 150 200 250 300 350 400 450
1 2 3 4 5 6 7 8 9 10 11 12 13 14 15 16 17 18 19 20
S a m p le R ang e (m m ) Sample
UCL = 121.3
LCL = 15.2 R = 68.3
100 120 140 160 180 200 220 240 260
1 2 3 4 5 6 7 8 9 10 11 12 13 14 15 16 17 18 19 20
A v er ag e ( m m ) Sample A
UCL = 183.2
LCL = 141.2 X = 162.2
100 120 140 160 180 200 220 240 260
1 2 3 4 5 6 7 8 9 10 11 12 13 14 15 16 17 18 19 20
A v e rage ( m m ) Sample B
UCL = 190.9
LCL = 130.2 X = 160.6
0 50 100 150 200 250 300 350 400 450
1 2 3 4 5 6 7 8 9 10 11 12 13 14 15 16 17 18 19 20
S am pl e R ang e (m m ) Sample
UCL = 175.0
LCL = 22.0 R = 98.5
0 50 100 150 200 250 300 350 400 450
1 2 3 4 5 6 7 8
S a m p le R ang e (m m ) Sample
UCL = 164.4
LCL = 20.6 R = 92.5
100 120 140 160 180 200 220 240 260
1 2 3 4 5 6 7 8
A v e rag e ( m m ) Sample A
UCL = 209.9
LCL = 152.9 X = 181.4
100 120 140 160 180 200 220 240 260
1 2 3 4 5 6 7 8
A v er ag e ( m m ) Sample B
UCL = 235.6
LCL = 165.1 X = 200.4
0 50 100 150 200 250 300 350 400 450
1 2 3 4 5 6 7 8
S a m p le R ang e (m m ) Sample
UCL = 203.2
LCL = 25.5 R = 114.4
limits and the process was considered predictable. Un-der the same conditions, the harvester CB (Figure 2B) presented sample 8 out of limit. It occurred due to a bil-let with 70 mm, but it was not short enough to bring the average also out of the quality limits.
The average billet length in the green sugar cane field did not differ between harvesters, but the standard de-viation differed, being higher for harvester CB. For the burnt sugar cane field, harvester CB presented longer billets, but had similar standard deviation than CA (Table 1). Comparing the green and burnt situations, both harvesters presented longer billets and higher variances for the burnt cane. Since both machines were adjusted to chop the shortest length as possible, it is not possible
to standardize the billet length when the crop condition changes from burnt to green conditions.
Harvester CB chops more heterogeneously the bil-lets than CA for green sugar cane (Table 2). Consider-ing the operational and work conditions for green sug-arcane the mill should receive billets varying up to 98 mm from harvester CA, average 160.3 mm, and 177 mm from CB, average 158.3 mm. For the burnt sugarcane the values are up to 197 mm (CA), average 181.4 mm, and 226 mm (CB), average 202.2 mm.
The billet length for harvester CB presented higher variability for green sugarcane and more susceptibility to external interference than CA. Both harvesters were not able to keep length uniformity, when comparing
0 5 10 15 20 25 30
90 110 130 150 170 190 210 230 250 270 290
P
er
c
ent
%
lenght (mm)
A LSL = 140 USL = 180
0 5 10 15 20 25 30
90 110 130 150 170 190 210 230 250 270 290
Pe
rc
e
n
t %
lenght (mm)
B LSL = 140 USL = 180
0 5 10 15 20 25 30
90 110 130 150 170 190 210 230 250 270 290
Pe
rc
e
n
t %
lenght (mm)
C LSL = 140 USL = 180
0 5 10 15 20 25 30
90 110 130 150 170 190 210 230 250 270 290
P
e
rc
en
t
%
lenght (mm)
D LSL = 140 USL = 180
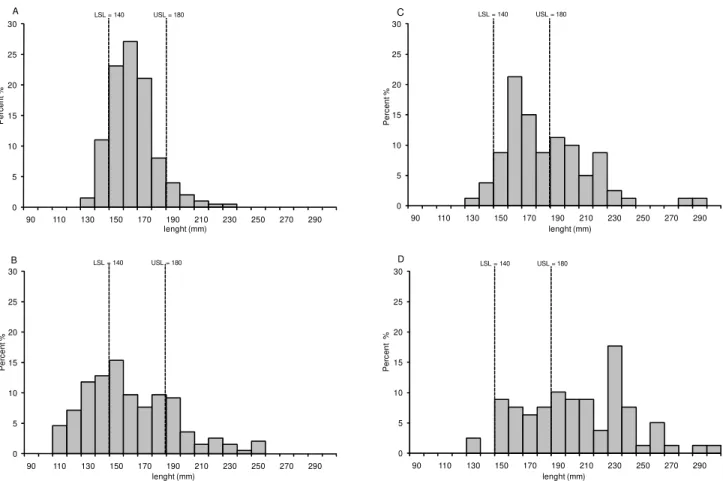
Figure 3 – Distribution of billet length: A) Harvester CA for green sugarcane, B) Harvester CB for green sugarcane, C) Harvester CA for burnt sugarcane, D) Harvester CB for burnt sugarcane.
Table 1 – Average and standard deviation (s.d.) of billet length for stabilized processes.
Lower case letters indicate comparison inside columns and uppercase letters indicate comparison inside rows. Averages were analyzed by t-test (α = 5%) and standard deviations by F-test (α = 5%).
Harvester Green sugarcane Burnt sugarcane
Average s.d. Average s.d.
mm
---CA 160.3 aA 16.5 aA 181.4 aB 30.4 aB
burnt and green sugarcanes. The billet length for har-vester CA for green sugarcane (Figure 3A) presented normal distribution with 10.73 and 11.31% of the data out of LSL and USL, respectively. The same harvester for the burnt sugarcane (Figure 3C) presented the larg-est extreme-value distribution type, with 3.48% of the bil-lets shorter than 140 mm and 44.68% longer than 180 mm. The best distribution adjustment for harvester CB in green sugarcane (Figure 3B) was the 3-parameter Weibull distribution, with 32.75% and 22.92% of the population below the lower limit and above the upper limit, respectively. Finally, harvester CB for burnt sug-arcane (Figure 3D) presented normal distribution with 77.47% of the billets out of the limits (3.57% below and 73.90% above).
The efficacy index (Table 3) measures the capacity of the process to fulfill the specified limits. A high value of this index indicates a high capacity to fulfill the speci-fications. The efficacy index (Cp) is a measure of the potential of the process but not a real measure, once it does not consider the current average of the process. A minimum value of the confidence intervals ( p) equals to one (1) represents 99.78% within the specified limits, if the process average could be centralized (Levine et al., 2002). The p interval for green sugarcane is better than the one for burnt sugarcane and the harvester CA pre-sented superior performance than the CB, but all inter-vals were lower than 1. It is necessary to analyze the har-vest process in order to check the possible causes when the standards are not achieved or to reevaluate if the specified limits of the company for the billet length (140 to 180 mm) are really mandatory to supply the quality demanded for crushing.
References
Fernandes, R.A.T.; Milan, M.; Peche Filho, A. 2000. Quality management in a mechanized operations of a sugar cane production system. Engenharia Agrícola 20: 215-220. (in Portuguese, with abstract in English).
Levine, D.M.; Stephan, D.; Krebiel, T.C.; Bereson, M.L. 2002. Statistics for manager using MS Excel. 3ed. Prentice Hall, Englewood Cliffs, NJ, USA.
Lewis, S.S. 1991. Process capability estimates for small samples. Quality Engineering 3: 381-394.
Milan, M.; Fernandes, R.A.T. 2002. Quality of tillage operations by statistical process control. Scientia Agricola 59: 261-266. (in Portuguese, with abstract in English).
Montgomery, D.C. 2004. Introduction to statistical quality control. 4ed. John Wiley, New York, NY, USA.
Neves, J.L.M.; Magalhães, P.S.G.; Moraes, E.E.; Araújo, F.V.M. 2003. Evaluation of invisible losses in mechanical harvesting in to sugar cane mass flows. Engenharia Agrícola 23: 539-546. (in Portuguese, with abstract in English).
Ramos, A.W. 2000. SPC for continuous process and batch. Edgard Blucher/ Fundação Vanzolini, São Paulo, SP, Brazil. (in Portuguese).
Ripoli, T.C.C. 1996. Testing & certification of machines to harvest sugar cane. p. 635-673. In: Mialhe, L.G., ed. Máquinas agrícolas: ens aios & certificação. CNPQ-PADCT /TIB/FEALQ, Piracicaba, SP, Brazil. (in Portuguese).
Ripoli, T.C.C.; Ripoli, M.L.C. 2002. Biomass from sugar cane: harvest, energy and environment. 2ed. Piracicaba, SP, Brazil, (in Portuguese).
Salvi, J.V.; Matos, M.A.; Milan, M. 2007. Evaluation of the performance of a base cutting device of a sugar cane harvester. Engenharia Agrícola 27: 201-209.
Santos, A.I.; Weber, L.M.; Moreira, T.Z.T. 2006. The Brazilian energy matrix and the use of renewable sources . Análise Conjuntural 28: 17. (in Portuguese).
Shewhart, W.A. 1925. The applications of statistics as an aid in maintaining quality of manufactured products. Journal of the American Statistical Association 20: 546-548.
Vieira, S. 1999. Statistics for Quality: How to Accurately Assess the Quality of Products and Services. Campus, Rio de Janeiro, RJ, Brazil. (in Portuguese).
Received February 27, 2009 Accepted May 04, 2010 Table 2 – Process capacity of billet chopping.
NLLT: normal limit of lower tolerance. NLUT normal limit of upper tolerance.
Harvester Green sugarcane Burnt sugarcane
NLLT NLUT NLLT NLUT
mm
---CA 111 209 124 321
CB 105 282 89 315
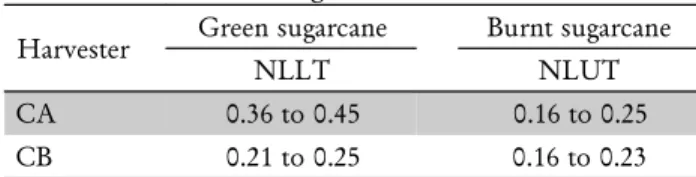
Table 3 – Confidence intervals of the efficacy index ( p) of the billet length.
Harvester Green sugarcane Burnt sugarcane
NLLT NLUT
CA 0.36 to 0.45 0.16 to 0.25
CB 0.21 to 0.25 0.16 to 0.23