Revista Brasileira de
Engenharia Agrícola e Ambiental
Campina Grande, PB, UAEA/UFCG – http://www.agriambi.com.br
v.20, n.9, p.841-846, 2016
Yield of sugarcane submitted to nitrogen fertilization
and water depths by subsurface drip irrigation
Fernando N. Cunha
1, Nelmício F. da Silva
1, Antonio E. C. Sousa
2,
Marconi B. Teixeira
1, Frederico A. L. Soares
1& Vitor M. Vidal
1DOI: http://dx.doi.org/10.1590/1807-1929/agriambi.v20n9p841-846
A B S T R A C T
Water is limiting for growth and essential for photosynthesis. Crop yield depends on the available amount of this resource and on the efficiency of its use by the plant. This study aimed to evaluate the vegetative growth and the gross yield of sugar and ethanol from sugarcane along cane-plant and ratoon cane cultivation, under different irrigation depths for water replenishment, with and without nitrogen (N) application by subsurface drip irrigation. The experimental design was randomized blocks, analyzed in a split-plot scheme, with four replicates, in which the plots were represented by the interaction: irrigation depths (0, 25, 50, 75 and 100% water replenishment of the field capacity), with and without N fertigation, and subplots were represented by 9 evaluation periods (90, 120, 150, 180, 210, 240, 270, 300 and 330 days after planting/days after the first cutting for ratoon cane). The gross yields of sugar and alcohol for water replenishments below 93 and 97%, respectively, are higher in sugarcane of first year than in sugarcane of second year. Fertigation provided greater vegetative growth of ratoon cane.
Rendimento da cana-de-açúcar submetida
a adubação nitrogenada e a lâminas
de irrigação por gotejamento subsuperficial
R E S U M O
A água é limitante para o crescimento e fundamental para a fotossíntese; a produtividade das plantas depende da quantidade disponível deste recurso e da eficiência de seu uso pelo vegetal. Com esse estudo objetivou-se avaliar o crescimento vegetativo e o rendimento bruto de açúcar e álcool da cana-de-açúcar ao longo do cultivo da cana-planta e cana-soca, em diferentes lâminas de reposição hídrica, com e sem aplicação de nitrogênio pelo sistema de irrigação por gotejamento subsuperficial. O delineamento experimental utilizado foi o de blocos ao acaso analisado em esquema de parcelas subdivididas, com quatro repetições, sendo a parcela representada pela interação das lâminas de irrigação (0, 25, 50, 75 e 100% de reposição hídrica, da capacidade de campo) com e sem fertirrigação nitrogenada e as subparcelas por nove épocas de avaliações (90, 120, 150, 180, 210, 240, 270, 300 e 330 dias depois do plantio/dias após o primeiro corte para a cana-soca). Os rendimentos brutos de açúcar e álcool para as reposições hídricas inferiores a 93 e 97% são, respectivamente, maiores em cana-planta que em cana-soca. A fertirrigação proporcionou maior crescimento vegetativo da cana-soca.
Key words:
Saccharum officinarum L. water replenishment yield
Palavras-chave:
Saccharum officinarum L. reposição hídrica produtividade
1 Instituto Federal Goiano/Laboratório de Irrigação e Hidráulica. Rio Verde, GO. E-mail: [email protected]; [email protected];
[email protected]; [email protected]; [email protected]
2 Instituto Federal Goiano/Laboratório de Irrigação e Hidráulica. Ceres, GO. E-mail: [email protected] (Corresponding author)
Introduction
Sugarcane cultivation is in full expansion in the Brazilian agriculture, especially due to the increase in the global demand for renewable and sugar biofuels (Quintana et al., 2012).
In Brazil, although sugarcane cultivation is concentrated in the Southeast and Northeast regions, the production moves preferentially to the Central West region of the country, notably
the states of Goiás and Mato Grosso do Sul (Vieira Júnior et al.,
2008). Sugarcane has been cultivated in different types of soil under the influence of various abiotic factors that are peculiar to each region, evidencing different production levels (Maule et al., 2001). Among various abiotic factors, water deficiency must be highlighted, due to the harmful effects caused on plant development (Vitorello et al., 2005).
Since water is a limiting factor for plant growth and fundamental for photosynthesis, crop yield depends on the available amount of this resource and on the efficiency of use by the plant, which can be aggravated when water availability conditions are associated with soil acidity (Carlin & Santos, 2009). Therefore, water availability in the soil is one of the environmental factors that most influence sugarcane production, since only 30% of its weight consists of dry matter and 70% is water, depending on the phenological stage (Rhein, 2012).
Nitrogen (N) fertilization can also promote yield increment in the plant cane cycle (Franco et al., 2010; Fortes et al., 2013); however, the responses to N application are still controversial. Localized irrigation, therefore, may present itself as an alternative, in which water and fertilizers are simultaneously applied through the drip system, promoting reduction in the consumption of water and fertilizers, which may result in higher sugarcane productions (Esperancini et al., 2015).
This study aimed to evaluate the vegetative growth and gross yield of sugar and alcohol of sugarcane along the cultivation of plant cane and ratoon cane, under different irrigation depths for water replenishment, with and without N application through a subsurface drip irrigation system.
Material and Methods
The study was carried out under field conditions, 2012 and 2013 seasons, at the experimental station of the Federal Institute of Goiás - Campus of Rio Verde, GO, Brazil (17° 48' 28" S; 50° 53' 57" W; 720 m). According to Köppen & Geiger
(1928), the climate of the region is classified as Aw (tropical),
with rains from October to May and dry period from June to
September. The mean annual temperature varies from 20 to 35 ºC and the rainfalls oscillate between 1,500 and 1,800 mm per year, while the relief is gently undulating (6% of declivity).
The soil in the experimental area was classified as dystroferric Red Latosol (LVdf), Cerrado phase, with clay loam texture (0-20 cm) and clay texture (20-40 cm) (EMBRAPA, 2013). The area has been cultivated for 10 years with Brachiaria decumbens.
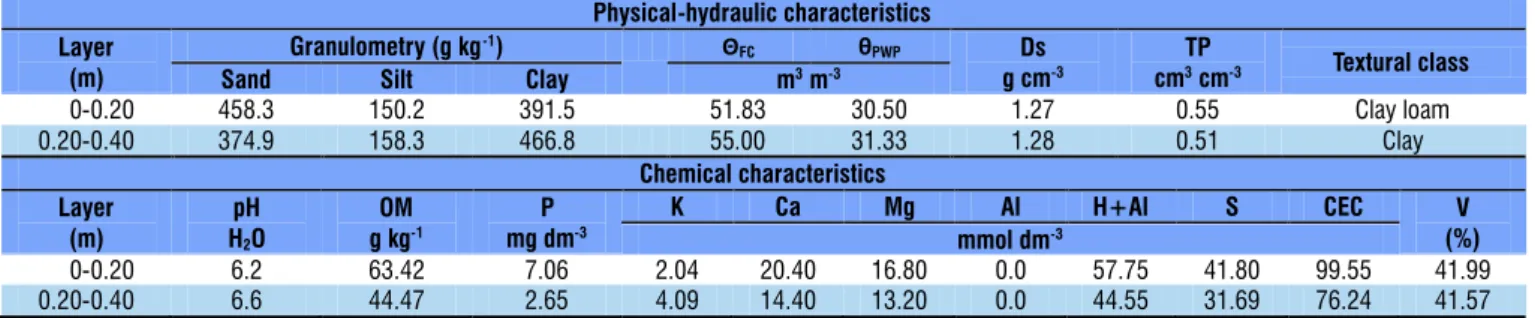
The results of the physical-hydraulic and chemical characteristics of the soil in the experimental area are shown in Table 1.
In the present study, the experimental plots consisted of three double-row furrows (‘W’ planting or ‘Pineapple’ planting) at spacing of 0.40 m between furrows and 1.80 m between drip rows, with length of 8 m, corresponding to 52.8 m2 of total area per plot, where the variety RB 85-5453 was cultivated for two years: plant cane (2012 season) and ratoon cane (2013 season).
The experimental design was randomized blocks, analyzed in split-plot scheme, with four replicates, in which the plots were represented by the interaction of irrigation depths (0, 25, 50, 75 and 100% of water replenishment (WR), of field capacity) with and without N fertigation, and the subplots were represented by 9 evaluation periods (90, 120, 150, 180, 210, 240, 270, 300 and 330 days after planting (DAP)/days after the first cut (DAC)). The crop was monthly evaluated for plant height in the central rows of each plot.
All experimental plots were fertilized based on the results of the soil analysis according to the recommendations described by Sousa & Lobato (2004). Except for the treatments without N application, the others received 100 kg ha-1 of N-urea, 120 kg ha-1 of P
2O5-single superphosphate and 80 kg ha -1 of K
2 O-potassium chloride. Phosphate and O-potassium fertilizers were applied in the planting furrow and N along the crop growth, in ten monthly applications equivalent to 10 kg ha-1 of N, each one through a subsurface drip irrigation system. Urea (45% N) was the fertilizer used.
Soil tension readings were daily performed, thus allowing the evaluation of crop water consumption in relation to the utilized irrigation depths (0, 25, 50, 75 and 100% of field capacity).
The drip pipe, buried at depth of 20 cm from the soil surface between two planting furrows, showed the following
*θ
FC - Field capacity (10 KPa); θPWP - Permanent wilting point (1,500 KPa); Ds - Soil density; TP - Total porosity; pH in distilled water. P and K, extractor Mehlich-1. OM - Organic matter. V -
Base saturation. CEC - Cation exchange capacity
Physical-hydraulic characteristics Layer
(m)
Granulometry (g kg-1) Θ
FC θPWP Ds
g cm-3
TP
cm3cm-3 Textural class
Sand Silt Clay m3m-3
0.00-0.20 458.3 150.2 391.5 51.83 30.50 1.27 0.55 Clay loam
0.20-0.40 374.9 158.3 466.8 55.00 31.33 1.28 0.51 Clay
Chemical characteristics Layer
(m)
pH H2O
OM g kg-1
P mg dm-3
K Ca Mg Al H+Al S CEC V
(%) mmol dm-3
0.00-0.20 6.2 63.42 7.06 2.04 20.40 16.80 0.0 57.75 41.80 99.55 41.99
0.20-0.40 6.6 44.47 2.65 4.09 14.40 13.20 0.0 44.55 31.69 76.24 41.57
characteristics: Dripnet PC 16150 drip pipe with thin wall, service pressure of 1 bar, nominal flow rate of 1.0 L h-1 and spacing between drippers of 0.5 m.
Plant height (PH) was monthly evaluated in the central rows of each plot (90, 120, 150, 180, 210, 240, 270, 300 and 330 days after planting/cutting), measured with a tape measure from the soil to the insertion of the +1 leaf (+1 leaf is that in which the insertion can be completely viewed) (Benincasa, 2003).
The gross yields of sugar and alcohol were determined through Eqs. 1 and 2 using the value of gross sugar content determined through the technological analysis of the juice, based on a sampling of 10 stems per plot (330 days after planting/cutting), according to the methodology described by Caldas (1998):
PSS StY SgY
100
×
=
where:
SgY - sugar yield, in kg ha-1;
PSS - percentage of gross sugar in the stem; and, StY - stem yield, in kg ha-1.
(
)
AY= PSS F× +FRS×Fg 10 StY× ×
where:
AY - gross alcohol yield, in L per ton of sugarcane; PSS - percentage of gross sugar in the stems;
F - stoichiometric transformation factor of sucrose into one molecule of glucose and one of fructose, equal to 1.052;
FRS - free reducing sugars in %, which varied from 0.7 to 0.85%, while the distillery uses 0.7 for high PSS;
Fg - Gay Lussac factor equal to 0.6475; and, StY - stem yield, in t ha-1.
The obtained data of plant cane and ratoon cane were subjected to analysis of variance by F test at 0.05 probability level and, in cases of significance, regression analysis was performed for the water replenishment levels and days after planting/cutting, while for the factor N application the means were compared by Tukey test at 0.05 probability level using the statistical program SISVAR® (Ferreira, 2011).
Results and Discussion
There was significant effect of the interaction N application x Evaluation period only for plant height of sugarcane in the second production cycle. The fact that there was no effect of N application, especially in the plant cane cycle, was possibly due to the high content of organic matter in the soil used in the study (Table 1). The response of the plant cane to N is little expressive and normally occurs at low doses (Franco et al., 2010; Fortes et al., 2013).
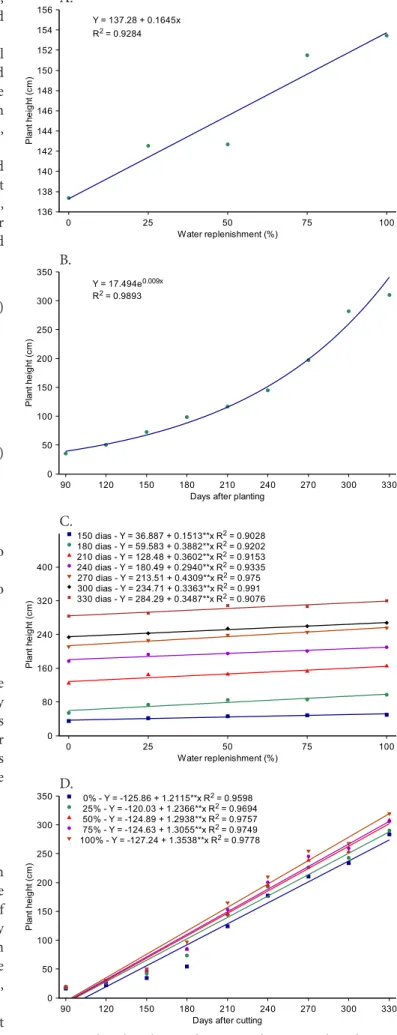
According to the data, there was linear increase in plant height as a function of the water replenishment, with R2 above 90% for both plant cane and ratoon cane (p < 0.01); thus, water replenishment affected plant height (Figures 1A and 1C).
Figure 1. Plant height as a function of water replenishment and days after planting/cutting for plant cane (A and B) and ratoon cane (C and D)
136 138 140 142 144 146 148 150 152 154 156
0 25 50 75 100
Y = 137.28 + 0.1645x
R = 0.92842
Pl
ant
he
ig
ht
(cm)
Water replenishment (%)
A.
B.
0 50 100 150 200 250 300 350
90 120 150 180 210 240 270 300 330
Y = 17.494e R = 0.9893
0.009x 2
Pl
ant
he
ig
ht
(cm)
Days after planting
C.
0 80 160 240 320 400
0 25 50 75 100
Pl
ant
he
ig
ht
(cm)
Water replenishment (%) 150 dias - Y = 36.887 + 0.1513**x R = 0.90282
180 dias - Y = 59.583 + 0.3882**x R = 0.92022
210 dias - Y = 128.48 + 0.3602**x R = 0.91532 240 dias - Y = 180.49 + 0.2940**x R = 0.93352
270 dias - Y = 213.51 + 0.4309**x R = 0.9752
300 dias - Y = 234.71 + 0.3363**x R = 0.9912
330 dias - Y = 284.29 + 0.3487**x R = 0.90762
D.
0 50 100 150 200 250 300 350
90 120 150 180 210 240 270 300 330
Pl
ant
he
ig
ht
(cm)
Days after cutting 0% - Y = -125.86 + 1.2115**x R = 0.95982
25% - Y = -120.03 + 1.2366**x R = 0.96942 50% - Y = -124.89 + 1.2938**x R = 0.97572
75% - Y = -124.63 + 1.3055**x R = 0.97492
100% - Y = -127.24 + 1.3538**x R = 0.97782
(1)
As to the evaluation periods (DAP and DAC), this growth for plant cane fitted to an exponential model, while it did not occur for the ratoon cane, which fitted to a linear model (p < 0.01), with R2 superior to 95% (Figures 1B and 1D).
The maximum plant height (plant cane) reached at 100% WR was 10.7% higher compared with 0% WR (rainfed condition); for the plant height observed at 75% WR, the difference was only 2.7% while for WR of 25 and 50%, it was approximately 8 and 5.3%, respectively, thus demonstrating a growth of 0.16 cm for each 1% increase in WR (Figure 1A). Water plays a fundamental role in the greater elongation of the internodes, which results in taller plants under conditions favorable to growth (Shigaki et al., 2004).
Plant height as a function of the evaluation period in plant cane, for fitting to an increasing exponential model, showed a constant percent increment over time; consequently, the growth between the evaluation periods was equivalent, with increase of 23.66% every 30 days and plant height, at 90 days, 88.46% lower than that at 330 days (Figure 1B).
The greater growth in this period occurred because it is characterized by low or irregular rainfall, higher light intensity and higher temperatures that, associated with the water availability promoted by subsurface irrigation, led to higher gains in plant height (Oliveira et al., 2010; Rhein, 2012).
Figure 1C shows sugarcane growth as ratoon cane for the periods with significant difference of water replenishment; according to the regression equation, there were increments of 7.3, 9.9, 5.5, 3.5, 4.2, 3.1 and 2.7% in plant height, for each 25% increase in WR, at 150, 180, 210, 240, 270, 300 and 330 days, respectively (Figure 1C).
Figure 1D shows the vegetative growth of sugarcane as ratoon cane for each water replenishment as a function of the evaluation period. According to the regression equation, there were increments of 13.3, 12.9, 12.8, 12.8 and 12.7%, for each increase of 30 days, for the water replenishments of 0, 25, 50, 75 and 100%, respectively. Plant height also indicated increments of 1.21, 1.24, 1.29, 1.3 and 1.35 cm d-1, for water replenishments of 0, 25, 50, 75 and 100%, respectively.
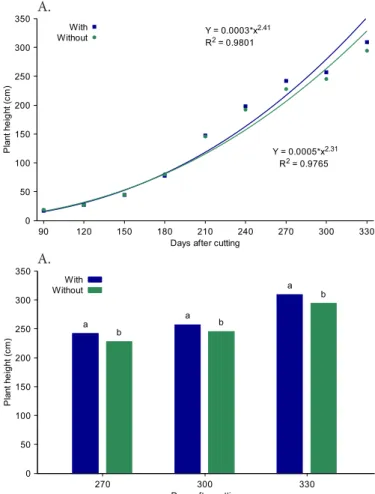
The results of plant height for the DAC of ratoon cane with and without N fertigation are presented in Figure 2. According to the data, plant height increment followed a potential function in relation to the DAC, with R2 above 97%.
The mean increases in plant height as a function of the DAC were 1.42 and 1.33 cm d-1 in the presence and absence of N fertigation (p < 0.01), respectively, with a difference of approximately 6.3% (Figure 2A).
For plant height in relation to N fertigation, the difference was significant only between 270, 300 and 330 DAC; thus, in the presence of fertigation, plant growth was intensified in these periods, demonstrating increments of 5.8, 4.3 and 4.8% for 270, 300 and 330 DAC, respectively (Figure 2B).
According to the regression analysis, the gross yield of sugar and alcohol fitted to a linear model as a function of the water replenishment, for both plant cane and ratoon cane (p < 0.01) (Figures 3A and 3B); consequently, the maximum gross yields of sugar and alcohol were obtained with water replenishment of 100% in both cycles.
The gross yields of sugar observed at WR of 75 and 100% were 33.8 and 34.8 t ha-1 (plant cane) and 32.7 and 35.2 t ha-1
(ratoon cane). Under full irrigation conditions, in a study with 24 varieties, Maschio (2011) observed variation in the gross yield of sugar on the order of 19.5 to 27.5 t ha-1, with lower values for the varieties RB855453 (22.0 t ha-1), CTC8 (21.6 t ha-1), RB925211 (20.6 t ha-1), CTC14 (20.4 t ha-1) and SP81-3250 (19.5 t ha-1). Barbosa et al. (2013) reported mean sugar yield of 25.5 Mg ha-1 only in the cycle of the second ratoon cane under irrigated cultivation and vinasse application.
According to the regression equation, gross sugar yield obtained increment of 3.8 and 10.08% for each 25% increase in WR for plant cane and ratoon cane, respectively (Figure 3A), thus demonstrating increase in gross sugar yield of 0.04 and 0.1 t ha-1 for each 1% increase in WR for plant cane and ratoon cane, respectively. The high percent difference observed mainly in the ratoon cane is about twice as high as that observed in the plant cane, which demonstrates the importance of irrigation and its relevant effect, especially in ratoon cane, to obtain higher yields and, therefore, promote greater economic return. Increases in the concentration of sucrose in the juice have been observed in the irrigated cultivation of sugarcane (Dantas Neto
et al., 2006; Tasso Júnior et al., 2007; Singh et al., 2007; Barbosa
et al., 2012; 2013).
The gross yield of alcohol showed increments of 0.03 and 0.07 m3 ha-1 for each 1% increase in WR for plant cane and ratoon cane, respectively (Figure 3B).
The maximum gross yields of alcohol were 24.8 and 24.9 m3 ha-1 in plant cane and ratoon cane, respectively (Figure 3B)
0 50 100 150 200 250 300 350
90 120 150 180 210 240 270 300 330
Y = 0.0003*x R = 0.9801
2.41 2
Y = 0.0005*x R = 0.9765
2.31 2
Pl
ant
he
ig
ht
(cm
)
Days after cutting With
Without
A.
A.
0 50 100 150 200 250 300 350
270 300 330
Pl
ant
he
ig
ht
(cm)
Days after cutting a
a
a
b
b
b With
Without
Figure 2. Plant height (ratoon cane) as a function of days
for 100% WR, while the minimum gross alcohol yield was 21.6 and 17.7 m3 ha-1, in plant cane and ratoon cane, respectively, for 0% WR. Carvalho et al. (2009) also observed increase in gross sugar yield, as well as in stem yield and gross alcohol yield, with the increase in irrigation levels.
The intersection of gross sugar yield between ratoon cane and plant cane is estimated to occur at water replenishment of 93% (Figure 3A), while the intersection of gross alcohol yield occurred at water replenishment of 97% (Figure 3B). Thus, the gross yields of sugar and alcohol for water replenishments lower than 93 and 97%, respectively, demonstrated higher yield values in plant cane, making this difference more expressive with the decrease in water replenishment.
Conclusions
1. Nitrogen fertigation promoted greater vegetative growth of ratoon cane, especially in the periods of 270, 300 and 330 days after cutting.
2. The gross yields of sugar and alcohol for water replenishments lower than 93 and 97%, respectively, are higher in plant cane than in ratoon cane.
Acknowledgments
The authors thank the Ministry of Science and Technology (MCT), the National Council for Scientific and Technological Development (CNPq), the Coordination for the Improvement
of Higher Education Personnel (CAPES), the Goiás Research Support Foundation (FAPEG) and the Federal Institute of Goiás - Campus of Rio Verde, for the financial and structural support to this research.
Literature Cited
Barbosa, E. A. A.; Arruda, F. B.; Pires, R. C. M.; Silva, T. J. A.; Sakai,
E. Cana-de-açúcar com vinhaça e adubos minerais via irrigação por gotejamento subsuperficial: Ciclo da cana-planta. Revista Brasileira de Engenharia Agrícola e Ambiental, v.16, p.952-958, 2012. http://dx.doi.org/10.1590/S1415-43662012000900005
Barbosa, E. A. A.; Arruda, F. B.; Pires, R. C. M.; Silva, T. J. A. da; Sakai,
E. Cana-de-açúcar fertirrigada com vinhaça via irrigação por gotejamento subsuperficial em três ciclos de cana-soca. Revista Brasileira de Engenharia Agrícola e Ambiental, v.17, p.588-594, 2013. http://dx.doi.org/10.1590/S1415-43662013000600003 Benincasa, M. M. P. Análise de crescimento de plantas: Noções básicas.
2.ed. Jaboticabal: FUNEP, 2003. 41p.
Caldas, C. Manual de análises selecionadas para indústrias sucroalcooleiras. Maceió: Sindicato da Indústria e do Álcool do Estado de Alagoas, 1998. 424p.
Carlin, S. D.; Santos, D. M. M. Indicadores fisiológicos da interação entre deficit hídrico e acidez do solo em cana-de-açúcar. Pesquisa Agropecuária Brasileira, v.44, p.1106-1113, 2009. http://dx.doi. org/10.1590/S0100-204X2009000900006
Carvalho, C. M.; Azevedo, H. M. de; Dantas Neto, J.; Farias, C. H. de
A.; Silva, C. T. S. R.; Gomes, R. F. Rendimento de açúcar e álcool da cana-de-açúcar submetida a diferentes níveis de irrigação. Revista Brasileira de Ciências Agrárias, v.4, p.72-77, 2009. http:// dx.doi.org/10.5039/agraria.v4i1a12
Dantas Neto, J.; Figueredo, J. L. da C.; Farias, C. H. de A.; Azevedo, H.
M. de; Azevedo, C. A. V. de. Resposta da cana-de-açúcar, primeira soca, a níveis de irrigação e adubação de cobertura. Revista Brasileira de Engenharia Agrícola e Ambiental, v.10, p.283-288, 2006. http://dx.doi.org/10.1590/S1415-43662006000200006 EMBRAPA - Empresa Brasileira de Pesquisa Agropecuária. Sistema
brasileiro de classificação de solos. 3.ed. Brasília: Embrapa Solos, 2013. 353p.
Esperancini, M. S. T.; Afonso, P. F. N.; Gava, G. J. C.; Villas Boas, R. L.
Dose ótima econômica de nitrogênio em cana-de-açúcar aplicada via fertirrigação por gotejamento. Irriga, v.1, p.28-39, 2015. http:// dx.doi.org/10.15809/irriga.2015v1n1p28
Ferreira, D. F. Sisvar: A computer statistical analysis system. Ciência e Agrotecnologia, v.35, p.1039-1042, 2011. http://dx.doi. org/10.1590/S1413-70542011000600001
Fortes, C.; Trivelin, P. C. O.; Vitti, A. C.; Otto, R.; Franco, H. C. J.;
Faroni, C. E. Stalk and sucrose yield in response to nitrogen fertilization of sugarcane under reduced tillage. Pesquisa Agropecuária Brasileira, v.48, p.88-96, 2013. http://dx.doi. org/10.1590/S0100-204X2013000100012
Franco, H. C. J.; Trivelin, P. C. O.; Faroni, C. E.; Vitti, A. C.; Otto, R.
Stalk yield and technological attributes of planted cane as related to nitrogen fertilization. Scientia Agricola, v.67, p.579-590, 2010. http://dx.doi.org/10.1590/S0103-90162010000500012
Köppen, W.; Geiger, R. Klimate der erde. Gotha: Verlag Justus Perthes,
1928. Wall-map 150 cm x 200 cm.
Maschio, R. Produtividade da água em biomassa e energia para 24 variedades de cana-de-açúcar. Piracicaba: ESALQ, 2011. 87p. Dissertação Mestrado. http://dx.doi.org/10.11606/d.11.2011. tde-19092011-103249
Figure 3. Gross yield of sugar (A) and alcohol (B) as a function of water replenishment for plant cane and ratoon cane
0 5 10 15 20 25 30 35 40
0 25 50 75 100
Y = 30.58 + 0.0426**x
R = 0.68572
Y = 25.097 + 0.1012**x R = 0.89882
Gr
os
sy
ie
ld
of
su
ga
r(
th
a
-1)
Water replenishment (%) Plant cane
Ratoon cane
A.
0 5 10 15 20 25 30
0 25 50 75 100
Y = 21.63 + 0.0314**x R = 0.72732
Y = 17.72 + 0.0716**x
R = 0.89892
Gr
os
sy
ie
ld
of
al
co
ho
l(
th
a
-1)
Water replenishment (%) Plant cane
Ratoon cane
Maule, R. F.; Mazza, J. A.; Martha Júnior, G. B. Produtividade agrícola
de cultivares de cana-de-açúcar em diferentes solos e épocas de colheita. Scientia Agricola, v.58, p.295-301, 2001. http://dx.doi. org/10.1590/S0103-90162001000200012
Oliveira, E. C. A.; Oliveira, R. I.; Andrade, B. M. T.; Freire, F. J.; Lira Júnior, M. A.; Machado, P. R. Crescimento e acúmulo de
matéria seca em variedades de cana-de-açúcar cultivadas sob irrigação plena. Revista Brasileira de Engenharia Agrícola e Ambiental, v.14, p.951-960, 2010. http://dx.doi.org/10.1590/ S1415-43662010000900007
Quintana, K. A.; Zanini, J. R.; Silva, E. R. da. Irrigação e fertirrigação
por gotejamento para cana-de-açúcar na presença e ausência de boro. Científica, v.40, p.103-116, 2012.
Rhein, A. F. L. Produtividade e qualidade da cana-de-açúcar sob doses de nitrogênio via fertirrigação subsuperficial por gotejamento.
Botucatu: UNESP, 2012. 117p. Tese Doutorado
Shigaki, F.; Freitas, N.; Berto, A.; Ceddia, M. B.; Zonta, E.; Lima, E. Influência do estresse hídrico nos parâmetros de crescimento, acúmulo de N e produtividade de diferentes variedades de
cana-de-açúcar em Miracema - RJ. Revista Universitária Rural, v.24, p.63-71, 2004.
Singh, S.; Singh, M.; Rao, G. R.; Solomon, S. Application of distillery spent wash and its effects on sucrose content in sugarcane. Sugar Technology, v.9, p.61-66, 2007. http://dx.doi.org/10.1007/ BF02956915
Sousa, D. M. G.; Lobato, E. Adubação com nitrogênio. In: Sousa, D. M. G.; Lobato, E. Cerrado: Correção do solo e adubação. 2.ed. Planaltina: EMBRAPA, 2004. p.129-144.
Tasso Júnior, L. C.; Marques, M. O.; Franco, A.; Nogueira, G. A.;
Nobile, F. O.; Camilotti, F.; Silva, A. R. Produtividade e qualidade da cana-de-açúcar cultivada em solo tratado com lodo de esgoto, vinhaça e adubos minerais. Engenharia Agrícola, v.27, p.276-283, 2007. http://dx.doi.org/10.1590/S0100-69162007000100022
Vieira Júnior, P. A.; Vieira, A. C. P.; Buainain, A. M.; Lima, F.; Silveira, J. M. J. Produção brasileira de cana-de-açúcar e deslocamento
da fronteira agrícola no estado do Mato Grosso. Informações Econômicas, v.38, p.58-77, 2008.
Vitorello, V. A.; Capaldi, F. R.; Stefanuto, V. A. Recent advances in aluminum toxicity and resistance in higher plants. Brazilian
Journal of Plant Physiology, v.17 p.129-143, 2005. http://dx.doi.