O
ABSTRACT
A comparison of skeletal, dentoalveolar and soft
tissue characteristics in white and black Brazilian
subjects
Lívia Maria Andrade de FREITAS1, Karina Maria Salvatore de FREITAS2, Arnaldo PINZAN3,
Guilherme JANSON4, Marcos Roberto de FREITAS4
1- DDS, MSc, PhD, Graduate student, Department of Pediatric Dentistry, Orthodontics and Community Health, Bauru School of Dentistry, University of São Paulo, Bauru, SP, Brazil.
2- DDS, MSc, PhD, Professor at Ingá Faculty of Dentistry (UNINGÁ), Maringá, PR, Brazil.
3- DDS, MSc, PhD, Associate Professor, Department of Pediatric Dentistry, Orthodontics and Community Health, Bauru School of Dentistry, University of São Paulo, Bauru, SP, Brazil.
4- DDS, MSc, PhD, Full Professor, Department of Pediatric Dentistry, Orthodontics and Community Health, Bauru School of Dentistry, University of São Paulo, Bauru, SP, Brazil.
Corresponding address: Dr. Livia Maria Andrade de Freitas - Faculdade de Odontologia de Bauru - USP - Departamento de Odontopediatria, Ortodontia e Saúde Coletiva - Disciplina de Ortodontia - Al. Octávio Pinheiro Brisolla, 9-75 - 17012-901 - Bauru, SP - Brazil - Phone/Fax: 55 14 32341961 - e-mail: [email protected]
Received: December 17, 2008 - Modification: July 19, 2009 - Accepted: October 22, 2009
bjective- This study aimed to compare skeletal, dentoalveolar and soft tissue characteristics in white and black Brazilian subjects presenting normal occlusions. Material and Methods- The sample comprised the lateral cephalograms of 106 untreated Brazilian subjects with normal occlusion, divided into two groups: Group 1- 50 white subjects (25 of each gender), at a mean age of 13.17 years (standard deviation 1.07); and Group 2- 56 black subjects (28 of each gender), at a mean age of 13.24 years (standard deviation 0.56). Variables studied were obtained from several cephalometric analyses. Independent t tests were used for intergroup comparison and to determine sexual dimorphism. Results-black subjects presented a more protruded maxilla and mandible, a smaller chin prominence and a greater maxillomandibular discrepancy than white subjects. Blacks presented a more horizontal craniofacial growth pattern than whites. Maxillary and mandibular incisors presented more protruded and proclined in black subjects. The nasolabial angle was larger in whites. Upper and lower lips were more protruded in blacks than in whites. Conclusions-The present study found a bimaxillary skeletal, dentoalveolar and soft tissue protrusion in black Brazilian subjects compared to white Brazilian subjects, both groups with normal occlusion. Upper and lower lips showed to be more protruded in blacks, but lip thickness was similar in both groups.
Ke y w or ds: Ethnic groups. Cephalometry. Normal values.
I N TROD UCTI ON
It is known that a single standard of cephalometric variables is not appropriate for application to diverse racial and ethnic groups, and that normative data of cephalometric measurements are essential to precisely determine the degree of variation from normal14,21.
Orthodontic treatment must be in equilibrium with the normal growth process to be effective and stable and to compensate for unpleasant facial patterns. The impact of treatment on the face has been constantly questioned. The age and the race became indispensable features18.
specific cephalometric standards to different ethnic groups1.
Cephalometric norms of different ethnic groups must be interpreted with caution. American blacks are an admixture not only of the different races in the United States, but also come from different parts of Africa7. In the same
way, Brazilian blacks had their origin mainly from the African coast, where Bantu population is prevalent. Some studies demonstrated significant cephalometric differences between South African, American blacks and whites, due to interracial and intraracial variations in morphological characteristics2,5,11,13. The black subjects generally
present a dental camouflage to compensate an anteroposterior discrepancy of skeletal bases, providing a good facial balance5. Enlow, et al.13
(1982) affirmed that, in Class I cases, craniofacial patterns are differentiated among blacks and whites. In blacks, the mandible develops downwards in a greater proportion than in whites. However, other studies found a bimaxillary protrusion characterized by dentoalveolar flaring of both maxillary and mandibular teeth with resultant protrusion of the lips and convexity of the face in black subjects4,11,15,16.
Considering the factors involved in ethnic facial features, it becomes important to study the Brazilian population considering the respective somatic traits. The present study aimed to cephalometrically compare skeletal, dentoalveolar and soft tissue characteristics in two distinct ethnic groups: black and white young Brazilian subjects with normal occlusion. The tested null hypothesis was that the cephalometric characteristics of black and white young Brazilian subjects with normal occlusion are similar.
M ATERI AL AN D M ETH OD S
The sample comprised the lateral cephalograms of 106 white and black untreated young Brazilian subjects presenting normal occlusion and well-balanced faces. The whole sample was obtained from the Growth Center at Bauru Dental School, University of São Paulo, and divided into two groups: Group 1 included 50 white subjects (25 of each gender) at a mean
age of 13.17 years (standard deviation 1.07, range from 11.40 to 14.90), and group 2 included 56 black subjects (28 of each gender) at a mean age of 13.24 years (standard deviation 0.56, range from 12.08 to 14.33). All subjects presented all permanent teeth up to the second molars and normal occlusion, i.e., normal molar and canine relationship, absence of crowding and crossbites, normal overjet and overbite, well-balanced face and without previous history of orthodontic treatment. Their data were collected some years ago when there were lighter restrictions on human studies.
The subjects of both ethnic groups were selected as pure as possible from the same geographic boundary, and the parents of each correspondent subject were from the same ethnic group. The Brazilian black subjects had their origin mainly from the African coast, where Bantu population is prevalent. Brazilian whites were Mediterranean descents.
It is important to study the population characteristics and the origin of the Brazilian ethnic groups, analyzing the respective somatic traits. Other relevant factor is the historic mixture of innumerous populations and races in America, which hinders the biological definition of each group16. The miscegenation in Brazil among the
Portuguese, the indigenes and black individuals resulted in the formation, since the early times of History, of a diversified population. Each one of the three basic groups is far from representing a pure ethnic group. By the geographic origin, one can have an idea of the racial affiliation of the imported individuals of the black group. In the African coast the Bantus are predominant, who were selected by the present sample, formed by the mixture of nigricians and paleonegroids, divided in occidental, oriental and meridional, with great or less influence. The Brazil stands as one of the few American countries that received African people of all origins. Three regions of Africa, the west, center-west and southeast coasts contributed with slave workers to Brazil until 185029.
1. The Nigrician, with high percentage of tall and dolichocephalic individuals; concentrated in Sudan and Guinea;
2. The Paleonegroid, with high percentage of short and mesocephalic individuals; concentrated in the forest regions of Congo, Senegal and Angola;
3. The Nilotic, with really tall and dolichocephalic individuals; dispersed in regions of High Nilo and great lakes;
4. The Khoisan, with high percentage of short and mesocephalic individuals; dispersed in South Africa, as well as the forest and desert regions. The cephalometric tracings and landmark identifications were performed on acetate paper by a single investigator (LMAF) and digitized (Numonics AccuGrid XNT, model A30TL.F— Numonics Corporation, Montgomeryville, Pa). These data were then stored on a computer and analyzed with Dentofacial Planner 7.02 (Dentofacial Planner Software Inc., Toronto, Ontario, Canada), which corrected the
SNA (0)- Angle formed by line S-N and line N-A.
A-Nperp (mm)- Linear distance from point A to the line perpendicular to Frankfort plane passing through point N. SNB (0)- Angle formed by line S-N and line N-B.
Co-Gn (mm)- Linear distance between the points condylion and gonion.
P-Nperp (mm)- Linear distance from point P to the line perpendicular to Frankfort plane passing through point N. P-NB (mm)- Linear distance from point P to the line N-B.
ANB (0)- Angle formed by line N-A and line N-B.
Convexity (NAP) (º)- Angle formed by line N-A and line A-P.
Wits (mm)- Linear distance between the projections of points A and B on occlusal plane. FMA (0)- Angle formed by Frankfort plane and mandibular plane (GoMe).
SN.GoGn (0)- Angle formed by line S-N and line Go-Gn.
SN.Ocl (0)- Angle formed by line S-N and occlusal plane.
1.NA (0)- Angle formed by maxillary incisors long axis and line N-A.
1-NA- Linear distance from the most anterior point of the crown of maxillary incisor to line N-A. 1.NB (0)- Angle formed by mandibular incisors long axis and line N-B.
1-NB- Linear distance from the most anterior point of the crown of mandibular incisor to line N-B.
Mentolabial sulcus- Longer distance from the mentolabial sulcus to line formed by the most anterior point of lower lip and the soft tissue pogonion.
Nasolabial angle (0)- Angle formed by a line from the lower border of the nose to one representing the inclination of the
upper lip.
Soft tissue convexity (0)- Angle formed between the lines from soft tissue glabella to subnasale and pogonion.
Upper lip length (mm)- Linear distance between the subnasale point and the most inferior point on the vermilion of the upper lip.
Upper lip protrusion (mm)- Linear distance between upper lip anterior point and subnasale-pogonion line.
Upper lip thickness (mm)- Linear distance between upper lip anterior point and the most anterior point of the buccal surface of maxillary incisor.
Lower lip protrusion (mm)- Linear distance between lower lip anterior point and subnasale-pogonion line.
Lower lip thickness (mm)- Linear distance between lower lip anterior point and the most anterior point of the buccal surface of mandibular incisor.
Interlabial gap (mm)- Linear distance between the most inferior point on the vermilion of the upper lip to the most superior point on the vermilion of the lower lip.
Lower lip-E (mm)- Linear distance between the lower lip anterior point and line E
Upper lip-E (mm)- Linear distance between the upper lip anterior point and line E (esthetic plane by Ricketts).
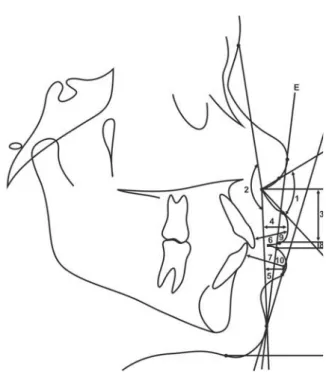
Figure 1- Definitions of abbreviations of the cephalometric variables evaluated in this study
Figure 2- Less usual cephalometric variables: 1.
Nasolabial angle (0); 2. Soft tissue convexity (0); 3. Upper
magnification factor of the radiographic images (6% for both groups). Skeletal, dentoalveolar and soft tissue cephalometric measurements are shown in Figure 1 and less usual variables are shown in Figure 2.
The mean and standard deviation (SD) for the ages and for each variable were calculated for both groups. Normal distribution was verified by the Kolmogorov-Smirnov test. The results of the tests were non-significant for all variables. Therefore, intergroup comparisons were
performed by independent t tests. All statistical analyses were performed on Statistica software (Statistica for Windows 6.0; Statsoft, Tulsa, Okla), with a level of significance of 5%.
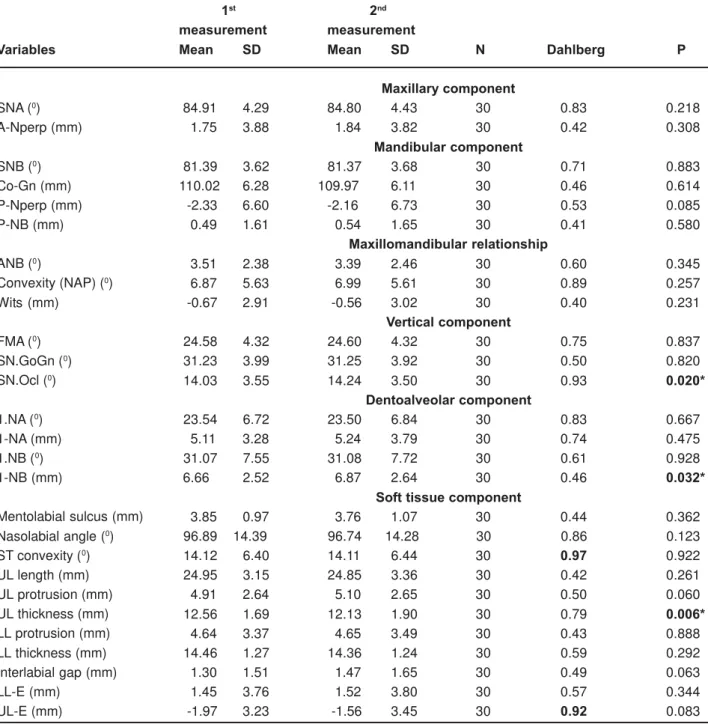
After 1-month interval from the first measurement, thirty randomly selected cephalograms were retraced and re-measured by the same examiner (LMAF). Random errors were calculated according to Dahlberg’s formula10
(Se2=
Σd2/2n) where Se2 is the error variance
and d is the difference between the two
Variables
SNA (0)
A-Nperp (mm)
SNB (0)
Co-Gn (mm) P-Nperp (mm) P-NB (mm)
ANB (0)
Convexity (NAP) (0)
Wits (mm)
FMA (0)
SN.GoGn (0)
SN.Ocl (0)
1.NA (0)
1-NA (mm) 1.NB (0)
1-NB (mm)
Mentolabial sulcus (mm) Nasolabial angle (0)
ST convexity (0)
UL length (mm) UL protrusion (mm) UL thickness (mm) LL protrusion (mm) LL thickness (mm) Interlabial gap (mm) LL-E (mm)
UL-E (mm)
1st 2nd
measurement measurement
Mean SD Mean SD N Dahlberg P
Maxillary component
84.91 4.29 84.80 4.43 30 0.83 0.218
1.75 3.88 1.84 3.82 30 0.42 0.308
Mandibular component
81.39 3.62 81.37 3.68 30 0.71 0.883
110.02 6.28 109.97 6.11 30 0.46 0.614
-2.33 6.60 -2.16 6.73 30 0.53 0.085
0.49 1.61 0.54 1.65 30 0.41 0.580
Maxillomandibular relationship
3.51 2.38 3.39 2.46 30 0.60 0.345
6.87 5.63 6.99 5.61 30 0.89 0.257
-0.67 2.91 -0.56 3.02 30 0.40 0.231
Vertical component
24.58 4.32 24.60 4.32 30 0.75 0.837
31.23 3.99 31.25 3.92 30 0.50 0.820
14.03 3.55 14.24 3.50 30 0.93 0.020*
Dentoalveolar component
23.54 6.72 23.50 6.84 30 0.83 0.667
5.11 3.28 5.24 3.79 30 0.74 0.475
31.07 7.55 31.08 7.72 30 0.61 0.928
6.66 2.52 6.87 2.64 30 0.46 0.032*
Soft tissue component
3.85 0.97 3.76 1.07 30 0.44 0.362
96.89 14.39 96.74 14.28 30 0.86 0.123
14.12 6.40 14.11 6.44 30 0.97 0.922
24.95 3.15 24.85 3.36 30 0.42 0.261
4.91 2.64 5.10 2.65 30 0.50 0.060
12.56 1.69 12.13 1.90 30 0.79 0.006*
4.64 3.37 4.65 3.49 30 0.43 0.888
14.46 1.27 14.36 1.24 30 0.59 0.292
1.30 1.51 1.47 1.65 30 0.49 0.063
1.45 3.76 1.52 3.80 30 0.57 0.344
-1.97 3.23 -1.56 3.45 30 0.92 0.083
Table 1- Casual and systematic errors between the 1st and 2nd measurements
determinations of the same variable, and the systematic errors were evaluated with dependent t tests19, for p<0.05.
RESULTS
The random errors varied from 0.40 mm (Wits) to 0.92 mm (LL-E) and from 0.50º (SN.GoGn) to 0.97º (ST convexity). Only one
angular variable (SN.Ocl) and two linear variables (1-NB and UL thickness) presented statistically significant systematic errors. From the 28 measured evaluated, only two presented systematic errors: SN.Ocl and 1-NB (Table 1). These results demonstrated that 92.54% of the studied variables presented precision and coherence. These errors were comprehensible, because it is known that there is great variation
Variables
Age (years)
SNA (0)
A-Nperp (mm)
SNB (0)
Co-Gn (mm) P-Nperp (mm) P-NB (mm)
ANB (0)
Convexity (NAP) (0)
Wits (mm)
FMA (0)
SN.GoGn (0)
SN.Ocl (0)
1.NA (0)
1-NA (mm) 1.NB (0)
1-NB (mm)
Mentolabial sulcus Nasolabial angle (0)
ST convexity (0)
UL length (mm) UL protrusion (mm) UL thickness (mm) LL protrusion (mm) LL thickness (mm) Interlabial gap (mm) LL-E (mm)
UL-E (mm)
Mean SD Mean SD P
13.17 1.07 13.24 0.56 0.632
Maxillary component
81.68 2.89 86.95 3.89 0.000*
-0.15 2.73 4.07 3.47 0.000*
Mandibular component
78.83 2.73 82.95 3.52 0.000*
110.97 5.41 108.61 5.97 0.036*
-4.22 5.44 0.80 6.06 0.000*
1.41 1.46 -0.22 0.96 0.000*
Maxillomandibular relationship
2.82 2.27 3.99 2.17 0.007*
4.60 4.89 8.47 4.88 0.000*
-0.62 2.76 -1.02 2.23 0.418
Vertical component
25.32 4.40 23.48 4.53 0.036*
33.01 3.98 30.54 4.42 0.003*
15.97 3.81 13.44 3.43 0.000*
Dentoalveolar component
21.59 5.75 24.92 5.43 0.002*
3.62 2.37 6.06 2.76 0.000*
24.64 4.78 35.99 5.92 0.000*
4.37 1.99 8.14 2.23 0.000*
Soft tissue component
3.65 0.99 4.02 0.96 0.056
104.68 10.20 89.31 12.44 0.000*
14.88 5.91 12.98 4.89 0.074
24.10 2.37 25.95 2.84 0.000*
3.06 1.53 6.59 2.06 0.000*
12.76 1.62 12.87 1.76 0.729
1.58 2.04 6.25 2.12 0.000*
14.46 1.12 14.66 1.39 0.420
0.90 0.84 1.30 1.43 0.088
-1.96 2.32 3.51 2.32 0.000*
-4.23 2.08 0.16 2.59 0.000*
* Statistically significant for P <.05. SD = standard deviation
Group 1 Group 2
White subjects Black subjects
N=56 N=50
in the determination of the mandibular incisor root apex.
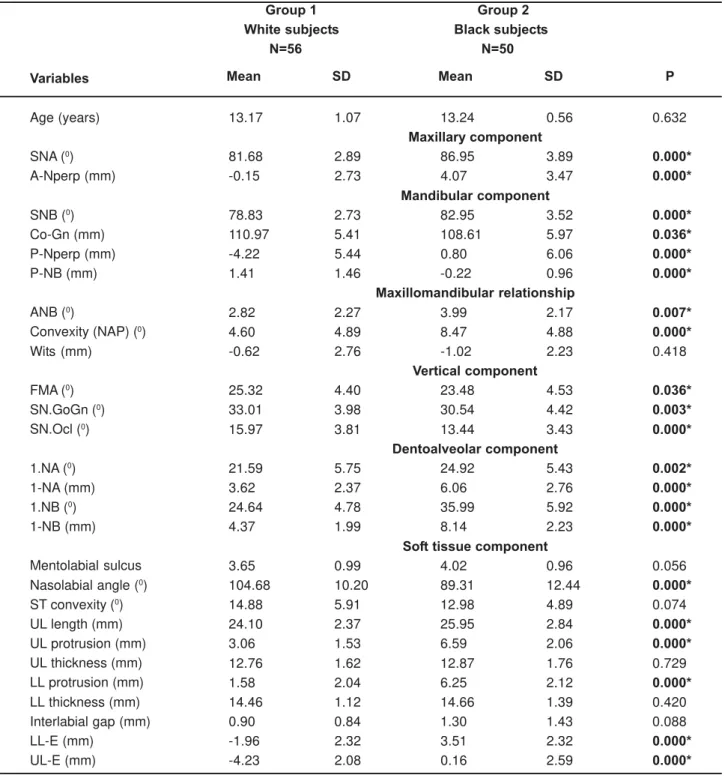
Black subjects presented a significantly more protruded maxilla and mandible and a greater maxillomandibular anteroposterior discrepancy than white subjects which had a more vertical growth pattern. Chin prominence was larger in whites. Facial convexity was greater in blacks than in whites. The maxillary and mandibular incisors were more protruded and proclined in black subjects. The nasolabial angle was greater in whites than in blacks. The upper lip was longer and both upper and lower lips were significantly more protruded in blacks in relation to white subjects. And all of these differences were statistically significant (Table 2).
D I SCUSSI ON
Sa m ple Se le ct ion
There are many studies in both black and white ethnic groups, but no one compares the skeletal, dentoalveolar and soft tissue characteristics in white and black Brazilians with normal occlusion. Furthermore, problems that can be identified when comparing cephalometric studies of white or black subjects are the cephalometric measurements used, differences in sample size and age, selection criteria, statistical methods, definitions of clinical normality, definitions of the black racial designation and variation in geographic distribution and origin of these two ethnic groups16,28.
This way, subjects of the two ethnic groups evaluated in this study were selected from the same geographic boundary, and parents of each subject must be from the same ethnic group. All sample presented normal occlusion and well-balanced faces. Additionally, the groups were compatible regarding gender and age distribution (Table 2).
I n t e r gr ou p Com pa r ison
M a x illa r y a n d m a n dibu la r com pon e n t s
Black subjects with normal occlusion presented statistically significant more protruded maxilla and mandible than white subjects with normal occlusion (Table 2). Several previous
studies also found maxillary and mandibular prognathism in black subjects2-4,11,17,22. Anterior
cranial base length can influence the anteroposterior position of nasion and therefore can affect the values of angles SNA and SNB, and this should be considered when comparing two different ethnic groups.2,4 Since black
individuals present a shorter cranial base, increased values for the angles SNA and SNB could be expected2,4,24. The present study also
found significant results for the variables A-Nperp and P-Nperp, confirming the bimaxillary skeletal prognathism of the black sample.
However, other studies did not find a statistically significant mandibular prognathism in black individuals, but the maxillary prognathism was also observed5,8,20. These
controversies may be due to differences in ethnical origins of the samples.
Despite the greater mandibular protrusion observed in blacks, they presented smaller chin prominence when compared to whites, as indicated by P-NB (Table 2).
M a x illom a n dibu la r r e la t ion sh ip
The maxillomandibular relationship presented larger values for blacks in relation to whites and it is in agreement with most of the previous studies3,5,11,12,20 (Table 2). This difference in ANB
angle can be explained by the differences in SNA and SNB angles. Even though the SNB angle was larger in blacks than in whites, it was not large enough to compensate for the large SNA angle, resulting in the larger ANB difference found for black subjects11. Following the same tendency
as ANB, skeletal convexity (NAP) was greater in blacks than in whites (Table 2).
The wits appraisal did not show significant difference between black and white subjects. Some studies had reported that blacks tend to present shorter anterior cranial base, when compared to whites2,4,24. This way, relative to
corroborating some previous studies5,11,24.
V e r t ica l com pon e n t s
Blacks presented a more horizontal craniofacial growth pattern than whites for all vertical component measurements. This result is in agreement with the results reported by Dandajena and Nanda11 (2003), when evaluating
a Zimbabwean sample.
Some previous studies found that black Americans6,9,12,28 and Africans2,4,20 had a high
Frankfort-mandibular plane angle (FMA). Differences from these studies to the present results emphasize the importance of different cephalometric norms for each ethnic group from distinct geographic origins.
D e n t oa lve ola r com pon e n t s
Regarding the dentoalveolar characteristics, black subjects presented more protruded and proclined maxillary and mandibular incisors than white subjects in all angular and linear incisor variables corroborating previous studies that found a bimaxillary dentoalveolar protrusion2,4,5,11,12 (Table 2). Nevertheless, some
studies demonstrated only a greater labial inclination of the mandibular incisors and not for the maxillary incisors in blacks, in relation to whites16,20.
The black Brazilian subjects present greater tendency to present dental protrusion, when compared to whites, probably due to the greater African miscegenation in Brazil, in these individuals of African descent. This way, the greater maxillary skeletal prognathism compared to mandibular, as excessive buccal inclination and protrusion of the mandibular incisors, associated to a retropositioning of the chin, are the compensatory effects in order to maintain the incisal contact, in the Black group11.
The protrusion of the maxillary and mandibular incisors found in black individuals appears to compensate for the maxillary and mandibular prognathism, and for the deficient maxillomandibular relationship in order to maintain incisal contact11. Furthermore, this
dental protrusion is more pronounced in mandibular incisors, compensating the smaller
mandibular protrusion and chin prominence in this ethnic group.
Soft t issu e com pon e n t
White subjects with normal occlusion presented a greater nasolabial angle than black subjects with normal occlusion, which presented greater upper lip length and protrusion and lower lip protrusion (Table 2). This indicates a greater soft tissue projection in blacks, as already mentioned previously 2,12,16,26 .
In the present study, thickness of upper and lower lips was not found to differ between black and white groups. Most significant soft tissue measurements were the protrusion of upper and lower lips found in blacks when compared to whites, which reflected the protrusive pattern of skeletal and dental structures. These increased values for upper and lower lips protrusion reflect the bimaxillary dentoalveolar protrusion found in black individuals2,4,11,12,20, which does not mean
that there is also a greater soft tissue thickness17,
as demonstrated in the present results.
Fin a l Con side r a t ion s
The esthetic facial lines and respective parameters differ in different ethnic groups, establishing individualized soft tissue
measurements26. The compensatory
dentoalveolar mechanisms provide a balanced face in distinct groups, different by age, race or gender27. Potentially orthodontic patients have a
variety of profile preferences, which indicates a distinction in several facial characteristics within each ethnic group, and the contemporary concept of pleasant esthetics of the facial profile is even more subjective21,23,25.
The present study confirmed the bimaxillary skeletal, dentoalveolar and soft tissue protrusion observed in black subjects, which have been described by several authors2,4,8,11,15,16,20,22. This
dentoalveolar protrusion found in blacks is more evident in the mandibular incisors, compensating the slightly smaller protrusion of the mandible and the smaller chin prominence in this ethnic group.
upper and lower lips was unexpectedly similar in both groups. This reaffirms that the greater soft tissue projection in blacks is actually a consequence of protruded maxillary and mandibular incisors.
CON CLUSI ON S
The null hypothesis was rejected, because black and white young Brazilian subjects with normal occlusion showed different cephalometric characteristics.
Black Brazilian subjects with normal occlusion presented a more protruded maxilla and mandible, a smaller chin prominence, a greater maxillomandibular discrepancy, a more horizontal craniofacial growth pattern and more protruded and proclined maxillary and mandibular incisors than white Brazilian subjects with normal occlusion. The nasolabial angle was larger in whites. Upper and lower lips were more protruded in blacks, but lip thickness was similar in both groups.
REFEREN CES
1- Alcade RE, Jinno T, Pogrel MA, Matsumura T. Cephalometric norms in Japanese adults. J Oral Maxillofac Surg. 1998;56:129-34.
2- Bacon W, Girardin P, Turlot JC. A comparison of cephalometric norms for the African Bantu and a Caucasoid population. Eur J Orthod. 1983;5:233-40.
3- Bailey KL, Taylor RW. Mesh diagram cephalometric norms for Americans of African descent. Am J Orthod Dentofacial Orthop. 1998;114(2):218-23.
4- Barter MA, Evans WG, Smit GL, Becker PJ. Cephalometric analysis of a Sotho-Tswana group. J Dent Assoc S Afr. 1995;50:539-44.
5- Briedenhann SJ, Roos EC. A cephalometric appraisal of the Herero-speaking negro male. J Dent Assoc S Afr. 1988;43(12):569-75.
6- Carter NE, Slattery DA. Bimaxillary proclination in patients of Afro-Caribbean origin. Br J Orthod. 1988;15:175-84.
7- Cobb WM. Physical anthropology of the American Negro. Am J Phys Anthropol. 1942;29:113-93.
8- Connor AM, Moshiri F. Orthognathic surgery norms for American black patients. Am J Orthod. 1985;87(2):119-34.
9- Cotton WN, Takano WS, Wong WL. The Downs analysis applied to three other ethnic groups. Angle Orthod. 1951;21:213-20. 10- Dahlberg G. Statistical methods for medical and biological students. New York: Interscience; 1940.
11- Dandajena TC, Nanda RS. Bialveolar protrusion in a Zimbabwean sample. Am J Orthod Dentofacial Orthop. 2003;123:133-7.
12- Drummond R. A determination of cephalometric norms of the Negro race. Am J Orthod. 1968;54:670-82.
13- Enlow DH, Pfisler C, Richardson E, Kuroda T. An analysis of black and caucasian craniofacial patterns. Angle Orthod. 1982;52(4):279-87.
14- Farkas LG, Katic MJ, Forrest CR, Alt KW, Bagic I, Baltadjiev G, et al. International anthropometric study of facial morphology in various ethnic groups/races. J Craniofac Surg. 2005;16(4):615-46.
15- Farrow AL, Zarrinnia K, Azizi K. Bimaxillary protrusion in black Americans - an esthetic evaluation and the treatment considerations. Am J Orthod Dentofacial Orthop. 1993;104(3):240-50.
16- Flynn TR, Ambrogio RI, Zeichner SJ. Cephalometric norms of orthognathic surgery in black American adults. J Oral Maxillofac Surg. 1989;47(1):30.
17- Fonseca RJ, Klein WD. A cephalometric evaluation of American Negro women. Am J Orthod. 1978;73(2):152-60.
18- Harris JE, Kowalski CJ, Levasseur FA, Nasjleti CE, Walker GF. Age and race as factors in craniofacial growth and development. J Dent Res. 1977;56(3):266-74.
19- Houston WJB. The analysis of errors in orthodontic measurements. Am J Orthod. 1983;83(5):382-90.
20- Jacobson A, Oosthuizen L. The craniofacial skeletal pattern of the South African Bantu. J Dent Assoc S Afr. 1970;25:361-5. 21- Kalha AS, Latif A, Govardhan SN. Soft-tissue cephalometric norms in a South Indian ethnic population. Am J Orthod Dentofacial Orthop. 2008;133(6):876-81.
22- Kowalski CJ, Nasjleti CE, Walker GF. Differential diagnosis of adult male black and white populations. Angle Orthod. 1974;44(4):346-50.
23- Kuroda S, Sugahara T, Takabatake S, Taketa H, Ando R, Takano-Yamamoto T. Influence of anteroposterior mandibular positions on facial attractiveness in Japanese adults. Am J Orthod Dentofacial Orthop. 2009;135(1):73-8.
24- Naidoo LCD, Miles LP. An evaluation of the mean cephalometric values for orthognathic surgery for black South Africa adults. Part I: Hard tissue. J Dent Assoc S Afr. 1997;52:495-502.
25- Nomura M, Motegi E, Hatch JP, Gakunga PT, Ng’ang’a PM, Rugh JD, et al. Esthetic preferences of European American, Hispanic American, Japanese, and African judges for soft-tissue profiles. Am J Orthod Dentofacial Orthop. 2009;135(4 Suppl):S87-95. 26- Owens EG, Goodacre CJ, Loh PL, Hanke G, Okamura M, Jo KH, et al. A multicenter interracial study of facial appearance. Part 1: A comparison of extraoral parameters. Int J Prosthodont. 2002;15(3):273-82.
27- Owens EG, Goodacre CJ, Loh PL, Hanke G, Okamura M, Jo KH, et al. A multicenter interracial study of facial appearance. Part 2: A comparison of intraoral parameters. Int J Prosthodont. 2002;15(3):283-8.
28- Richardson ER. Racial differences in dimensional traits of the human face. Angle Orthod. 1980;50(4):301-9.