Introduction
Skeletal muscle strength is associated with the functional capacity of an individual and can provide various beneicial effects such as increased athletic performance and an enhanced quality of life. Moreover, the ratio of muscle strength between antagonistic muscles groups should be balanced to prevent joint injuries1 (For example, in the knee, an imbalance of the strength generation be-tween the lexor and extensor muscles can overwhelm important structures related to joint stability such as the anterior cruciate ligament (ACL)1,2. (As most of the ACL injuries are non-traumatic, some studies have established clinical measures to predict injury risk. One of the items to be evaluated for injury prediction is the hamstrings-to-quadriceps peak torque conventional ratio (H:Q ratio)3,4. The H:Q ratio is frequently used to describe the muscle strength properties for the knee joint and provides important in-formation regarding the dynamic stability of the joint5.
The most common standard for the assessment of muscle strength in vivo is by isokinetic dynamometry evaluation6. From this measure, it is possible to determine the percentage ratio between the force of an agonist muscle and its antagonist.1 Nonetheless, the equipment has a high cost, and it does not allow the reproduction of functional activities at the clinical practice, which limits its accessibility.
Another method to evaluate muscle strength is one-repetition maximum testing (1-RM), which is a cost-effective procedure widely used for measuring muscle strength7. The 1-RM test has the potential to infer the maximum force produced by a muscle, which is important in establishing protocols for physical training or treatment. However, data acquired by 1-RM does not present the range of details provided by dynamometry, including ago-nist versus antagoago-nist ratio, speed control, fatigue index, and generated work, among others8.
Previous study observed that the 1-RM testing shows high correlation with isokinetic peak torque data for muscle strength when performed on selected gym equipment9. However, there is no data showing correlation of the H:Q between dynamometry and 1-RM testing9.
On the other hand, researchers have developed an easy and cost-effective 1-RM test protocol to obtain the H:Q ratio. Results showed values similar to those observed by dynamometry8. However, data should be used with caution since the H:Q ratio ob-tained by the 1-RM test will relect the approximated values of the test performed by dynamometry, but not necessarily the same values. Thus, the aim of this study was to compare measures of H:Q ratio in young adults obtained by dynamometry and 1-RM. Additionally, we analyzed the predictive validity of these data10. The results of this work could aid sports professionals and
Original article (short paper)
Validity analysis of one-repetition maximum
strength test for determining the
hamstrings-to-quadriceps ratio
George Schayer Sabino
Propulsão Biomecânica, Belo Horizonte, MG, Brasil
Diogo Carvalho Felício
Universidade Federal de Juiz de Fora, Juiz de Fora, MG, Brasil
Cristiano Queiroz Guimarães
Propulsão Biomecânica, Belo Horizonte, MG, Brasil
Bento João da Graça Azevedo Abreu Wouber Hérickson de Brito Vieira
Universidade Federal do Rio Grande do Norte, Natal, RN, Brasil
Abstract––One of the approaches to evaluate injury prediction is the hamstrings-to-quadriceps peak torque conventional ratio (H:Q ratio). The gold standard for assessment of muscle strength in vivo is by isokinetic dynamometry; however, the one-repetition maximum strength test (1-RM) presents high correlation with isokinetic data. This study aimed to compare measures of H:Q ratio in young adults obtained by dynamometry and 1-RM testing. No signiicant differences were observed in the H:Q ratio when comparing 1-RM and dynamometry testing. However, there was a signiicant and strong correlation between the measurements obtained in the two tests. Despite this correlation, data from both tests are not equal as the H:Q ratio obtained from 1-RM test presents a systematic error. Nonetheless, the results can enhance the applicability of 1-RM test in clinical settings.
health scientists since it validates the 1-RM test as an easy and cost-effective procedure to identify lower limb muscle imbal-ance in clinical settings.
Method
Study design and ethical aspects
This study was designed using cross-sectional methodol-ogy. The research protocol was approved by The Pythagoras University Ethics Committee (ETIC 157.504/2013), compliant with the Declaration of Helsinki. All participants were informed of the study criteria and required to sign a consent form.
Participants
Sample size was calculated based on the variability of 1 RM test8, with a conidence interval of 95%. The result of this cal -culation indicated that 14.51 participants would be an adequate sample size. Participant selection was carried out by random sampling. Speciically, healthy participants were recruited from health centers and through local advertisements. The study included sedentary, male and female volunteers ranging in age from 20 to 40 years. The exclusion criteria were deined by any pathology or musculoskeletal disorder that would impact the maximal strength exercise performance; either at the beginning of physical activity during the study or muscle pain complaint on the day of the test. Sixteen healthy and sedentary young adults were recruited for this study resulting in a mean age of 23.1±6.2 and a mean body mass index of 23.79 ± 4.62 kg/m2.
Study settings
The experiments were conducted in the Department of Physiotherapy of the Federal University of Minas Gerais and at Pitagoras University, Brazil.
Procedures
Body mass (measured by a digital balance scale with an accuracy of ± 0.01 kg) and height (measured by a wall-mounted stadiometer with an accuracy of ± 0.001 m) were measured with participants standing barefoot and dressed lightly. The right leg of each volunteer was tested and both test procedures were performed on two occasions separated by an interval of seven days. Prior to each test, individuals performed a five minutes period of warm-up on a stationary bicycle followed by test familiarization with three submaximum repetitions.
The 1-RM test was initially performed by using a High-on®
universal knee lexor/extensor chair (Righetto, Brazil). The par -ticipants performed concentric movements in a seated position, with bench adjustments of 0º to 90º for knee lexion and 90º to
0º for knee extension. The participants were asked to remain correctly stationed on the bench by gripping the side handles and performing slow knee movements throughout its range. The initial load for the 1-RM test was predicted from 50% of body weight. After a recovery period of one minute, if two repetitions were completed at the irst attempt, a higher load (2.5–5.0%) for a second trial was added. If the participant did not complete a single repetition, a second attempt was performed with a lower load. This method was repeated until the load corresponding to a maximum repetition had been met9. For the 1-RM test, the ag-onist/antagonist ratio was calculated by dividing the peak torque measured for the lexor muscles by the extensor muscles torque.
For dynamometer testing of the muscle torque, a Biodex System 3 Pro® (Shirley, NY/EUA) was used. Participants were placed in a seated position similar to the 1-RM testing and secured by Velcro straps to restrict compensatory movement prior to the isokinetic testing. A 90o angle motion test was applied. The knee axis of rotation was the lateral epicondyle of the femur, which was set approximately two centimeters lateral from the dynamometer shaft. The resistance bar was set approximately two centimeters above the lateral epicondyle of the ibula in order to free the movements of the ankle. Sample trials at low intensity were performed before each measure-ment. During testing, participants were verbally encouraged to provide maximum contractions for two to three seconds. According to previous reports, the agonist/antagonist ratio with an angular velocity of 60° per second, with ive repetitions, (both lexor and extensor muscles) in the concentric actions were measured4,11.
Statistical analysis
Data measurements by using central tendency and sample variance were analyzed. The Shapiro-Wilk Test was used to verify data distribution, which exhibited normal distribution. Therefore, differences between 1-RM and dynamometer testing using the matched-pairs t-test with a signiicance level of 0.05 were performed. Pearson’s correlation coef-icient was used for analyzing correlation between agonist/ antagonist data in 1-RM and dynamometry results. Based on scatter plot results, a regression analysis was conducted to determine the linear prediction equation of the standard values of H:Q ratio12. In order to evaluate adequacy of the model, residual analysis were performed and normality checked for homoscedasticity and data independence. Lastly, Bland-Altman analysis was applied to evaluate systematic errors and data range10,13.
Results
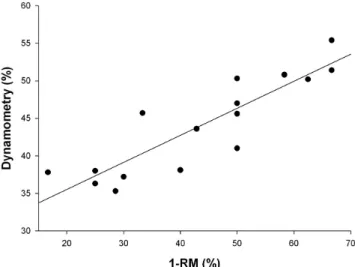
the measurements obtained in the two tests (r = 0.89; p < 0.05) was observed. Figure 1 also illustrates a scatter among the H:Q measurements, performed in dynamometry and 1-RM at the origin of the scales. Such measurements were then adjusted by using regression, as shown in Equation 1:
Equation 1: isokinetic values = 28.3 + 0.36 (1-RM values)
The “isokinetic values” in Equation 1 refers to the data predicted for dynamometry testing, while “1-RM values” refers to the data obtained in the 1-RM test.
By employing residue analysis, variability in the mea-surement of the H:Q ratio by the dynamometry could be obtained from the 1-RM test. The dynamometry’s coeficient of determination was 78.1%. Therefore, most of the observed variability of the dynamometry’s H:Q ratio can be predicted from the 1-RM test.
H:Q results of each 1-RM and dynamometry testing are presented in Figure 2. As observed, the results demonstrated certain regions of similarity, but measures are not equal. In order to compare the mean of the measurement of the two tests with the observed difference, the Bland Altman analysis was performed (Figure 3). A systematic error in the comparison between two forms of measurements (95% LOA was 20.18 to −20.69) was observed and is illustrated in Figure 3.
Figure 1. Correlation between measurements of agonist/antagonist re-lationship obtained in the 1-RM test and the isokinetic dynamometry.
Figure 2. Conventional measures of the H:Q ratio made by 1-RM and isokinetic dynamometry.
Figure 3. Representation of the differences between the measurements of H:Q ratio by the Bland-Altman plot.
Discussion
In the present work, measurements of H:Q ratio in young adults obtained by dynamometry and 1-RM evaluation were compared and analyzed.Although these tests evaluate different types of muscle contraction, the H:Q ratio results obtained by dynamometry and 1-RM showed a high correlation with no signiicant differences. Further, most of the observed variabil -ity in the measurement of the dynamometry’s H:Q ratio was predicted from the 1-RM test. Accordingly, previous study observed similar correlation results between isokinetic torque values and 1-RM values9. The results of this study may be useful
for professionals of sport and health ields since it validates the 1-RM test as an easy and cost-effective procedure to identify lower limb muscle imbalance in clinical settings.
Indeed, simpliication of the procedures used by physio -therapists and other health professionals can be an effective measure to exclude subjective evaluations and enhance patient outcomes14. However, it is important to note that the 1-RM test
is a simpliied version of the dynamometry testing by a number of factors, including the movement speed. It is noted that one cannot control the speed in a gym machine during the execution of a strength test. In this study, the participants were instructed to perform a uniform and smooth movement during 1-RM test-ing, even though this procedure did not guarantee a controlled movement like the isokinetic testing. This is a remarkable point as the conventional ratio is dependent upon the velocity of movement’s execution15. In a previous study, the ideal H:Q
ratio for a speed of 60° per second was 60%, while an H:Q ratio for a speed of 360° per second reached 80% 11. Similarly, in this study, the angular velocity performed in dynamometry was set at 60° per second9. This speed is widely used because the slow movement can be easily and safely reproduced using strength machines, allowing a comparison of the dynamometry and the 1-RM values. Moreover, the torque generated at 60° per second is superior in comparison to that which is produced at higher speeds16. Nonetheless, one should note that the results presented above are likely not applicable to other angular velocities.
However, this assumption can promote errors and misun-derstanding. Taking the one-leg horizontal jump test as an example, it is believed that the contribution of the quadriceps femoris muscle is very important to the execution of this task. However, this relationship has not been observed previously17. In fact, a number of strategies can be used to optimize a spe-ciic functional movement18,19. Thus, one cannot infer that only quadriceps strength is related to the distance jumped by one person. If a clinician interprets that the poor results acquired in the jumping test are due solely to muscle weakness, it could lead to innocuous treatment of the individual’s condition. In this manner, the 1-RM and dynamometry tests resemble each other, but special attention should be given to verify if these tests are able to measure the same variable.
Criterion validity is the process in which a test is compared to a validated one to determine whether the same variable is being measured12. The similarity in the results would indicate its validity. The values of the measurements made by the two tests employed in this study present a good correlation (r = 0.89). Therefore, a simple correction of the 1-RM results should be completed to predict the value of the H:Q ratio that would be obtained if the measure had been held on the isokinetic machine. This correction is performed by the formula shown in Equation 1. The error between the predicted values by this equation and the actual isokinetic values showed a mean of −0.03 ± 3.01%. It is necessary to reiterate that the 1-RM test is a simpliication of the dynamometry testing leading to errors in the measurements. From the analysis of the data shown in Figure 2 and from the Bland Altman graphic (Figure 3), it was possible to identify this error. Based on the results, the H:Q ratio for the 1-RM test tended to be overestimated in comparison with the isokinetic results, when the observed ratio is considered high (for instance, higher than approximately 40%). Conversely, the H:Q ratio tended to be underestimated in the opposite case (e.g., lower than 40%). Based on this concept and Equation 1, an individual who obtained an H:Q of 30% in the 1-RM test would obtain approximately a 39% H:Q in the dynamometry. It is worth mentioning that normal H:Q ratios range from 50 to 80%and most of the participants in this study presented H:Q ratios within this range20,21.
The present study has some limitations. First of all, only a single test was performed on each piece of equipment. It is possible that more repetitions would result in a more reliable outcome, especially in dynamometry. Moreover, we used a heterogeneous sample and therefore, it is dificult to associate results to age, gender, and functional level before the activity.
Conclusion
Analysis of the potential and limitations to determine the H:Q ratio based on 1-RM test in comparison with the dyna-mometry test was performed. Data from both methods are highly correlated, but are not equal as the H:Q ratio obtained from 1-RM test presents a systematic error. Nonetheless, results from this study can disseminate the applicability of this method in a clinical setting. Other measures provided by dynamometry could also be simpliied so that its use can be expanded.
References
1. Myer GD, Ford KR, Barber Foss KD, Liu C, Nick TG & Hewett TE. The relationship of hamstrings and quadriceps strength to anterior cruciate ligament injury in female athletes. Clin J Sport MeD. 2009; 19: 3-8.
2. Holcomb WR, Rubley MD, Lee HJ & Guadagnoli MA. Effect of hamstring-emphasized resistance training on hamstring:quad-riceps strength ratios. J Strength Cond Res. 2007; 21:41-7. Retrieved from http://www.ncbi.nlm.nih.gov/pubmed/17313266. 3. Boden BP, Dean GS, Feagin JAJr & Garrett WEJr. Mechanisms
of anterior cruciate ligament injury. Orthopedics. 2000; 23: 573-8. Retrieved from http://www.ncbi.nlm.nih.gov/pubmed/10875418 4. Myer GD, Ford KR, Khoury J, Succop P & Hewett TE.
Development and validation of a clinic-based prediction tool to identify female athletes at high risk for anterior cruciate ligament injury. Am J Sports Med.2010; 38:2025-33.
5. Cheung RT, Smith AW, Wong del P. H:q ratios and bilateral leg
strength in college ield and court sports players. J Hum Kinet.
2012; 33: 63-71.
6. Abernethy P, Wilson G & Logan P. Strength and power assess-ment: Issues, controversies and challenges. Sports Med. 1995; 19: 401-417.
7. Taylor JD, Fletcher JP & Tiarks J. Impact of physical
therapist-di-rected exercise counseling combined with itness center-based
exercise training on muscular strength and exercise capacity in people with type 2 diabetes: a randomized clinical trial. Phys Ther.2009; 89: 884-92.
8. Americo SPF, Souza VV, Guimarães CQ & Rolla AFL. Utilização
do Teste de 1RM na mensuração da razão entre lexores e exten -sores de joelho em adultos jovens. Rev Bras Med Esporte. 2011; 17: 111-114.
9. Verdijk LB, van Loon L, Kenneth Meijer K & Savelberg HH. One-repetition maximum strength test represents a valid means to assess leg strength in vivo in humans. J Sports Sci. 2009; 27: 59-68. 10. George, K., Batterham, A. & Sulliavan, I. (2000). Validity in
clinical research: a review of basic concepts and deinitions. Phys
Ther Sport. 1,19-27.
11. Zabka FL, Valente HG & Pacheco AM. Avaliação isocinética dos
músculos extensores e lexores de joelho em jogadores de futebol proissional. Rev Bras Med Esporte. 2011; 17: 189-192.
12. Hopkins WG, Marshall SW, Batterham AM & Hanin J. Progressive Statistics for Studies in Sports Medicine and Exercise Science. Med Sci Sports Exerc. 2009; 41: 3-12.
13. Portney LG & Watkins M.P. Foundations of clinical research: application to practice. 2000. In New Jersey: Prentice-Hall. 14. Sabino GS, Coelho CM & Sampaio RF. Utilização da classiicação
internacional de funcionalidade, incapacidade e saúde na avaliação
isioterapêutica de indivíduos com problemas musculoesqueléti -cos nos membros inferiores e região lombar. Acta Fisiátr. 2008; 15: 26-30. Retrieved from http://www.actaisiatrica.org.br/detal -he_artigo.asp?id=158
15. Ergun M, Islegen C & Taskiran E. A cross-sectional analysis of sagittal knee laxity and isokinetic muscle strength in soccer players. Int J Sports Med. 2004; 25: 594-8.
Isokinetic and isometric muscle strength in a healthy population with special reference to age and gender. Acta Physiol (Ox). 2009; 197: 1-68.
17. D’Alessandro RL, Silveira EAP, Anjos MTS, Silva AA & Fonseca ST. Análise da associação entre a dinamometria isocinética da articulação do joelho e o salto horizontal unipodal Hop Teste em atletas do voleibol. Rev Bras Med Esporte. 2005; 11: 271-275. 18. Lockie RG, Murphy AJ, Schultz AB, Knight TJ & Janse de Jonge
XA. The Effects of Different Speed Training Protocols on Sprint Acceleration Kinematics and Muscle Strength and Power in Field Sport Athletes. J Strength Cond Res. 2012; 26: 1539-50. 19. Wu WFW, Porter JM & Brown LE. Effect of Attentional Focus
Strategies on Peak Force and Performance in the Standing Long Jump. J Strength Cond Res. 2012; 26: 1226-1231.
20. Bennell K, Wajswelner H, Lew P, Schall-Riaucour A, Leslie S, Plant D & Cirone J. Isokinetic strength testing does not predict hamstrings injury in Australian Rules footballers. Br J Sports Med.
1998; 32: 309–314. Retrieved from http://www.ncbi.nlm.nih.gov/ pmc/articles/PMC1756115/pdf/v032p00309.pdf
21. Smith AW & Wong del P. H:q ratios and bilateral leg strength
in college ield and court sports players. J Hum Kinet. 2012;
33: 63-71.
Acknowledgements
The authors would like to thank Fehmida Mesania for language assistance.
Corresponding author
Wouber Hérickson de Brito Vieira
Av. Senador Salgado Filho, 3000, Campus Universitário, Lagoa Nova, Natal, Rio
Grande de Norte, Brasil
Email: [email protected]
Manuscript received on March 07, 2015
Manuscript accepted on April 10, 2016
Motriz. The Journal of Physical Education. UNESP. Rio Claro, SP, Brazil-