Original Article
BEHAVIOR OF SUBJECT CONTRAST VERSUS GLANDULAR
DOSE IN MAMMOGRAPHY: DETERMINATION OF A
SEMI-EMPIRICAL FORMALISM FOR DIFFERENT TARGET-FILTER
COMBINATIONS*
Gabriela Hoff1, Carlos Eduardo de Almeida2, Gary T. Barnes3
* Study developed at Universidade do Estado do Rio de Janeiro, Post-Graduation in Biology, Rio de Janeiro, RJ, Brazil.
1. Ph.D., Group of Experimentation and Computational Simulation in Medical Physics, Pontifícia Universidade Católica do Rio Grande do Sul, Porto Alegre, RS, Brazil.
2. Ph.D., Titular Professor in Medical Physics at Universidade do Estado do Rio de Janeiro.
3. Ph.D., University of Alabama at Birmingham, USA.
Mailing address: Dra. Gabriela Hoff. Grupo de Experimentação e Simulação Computacional em Física Médica, PUCRS. Avenida Ipiranga, 6681, Prédio 10. Porto Alegre, RS, Brazil, 91619-900. E-mail: [email protected]
Received June 24, 2004. Accepted after revision August 27, 2005.
Abstract
a different behavior tendency for each case analyzed. Equations were defined to allow us to estimate subject contrast, glandular dose and exposure time for the cases studied. CONCLUSION: The results have made possible to define equations to assist with the evaluation of subject contrast and glandular dose behavior in simulators with 4 cm and 8 cm thicknesses and for Rh and Mo additional filters. In this way, it is possible to estimate the figure of merit (subject contrast x glandular dose) to assist in the risk-benefit analysis of the cases studied.
Keywords: Mammography; Radiation exposure; External dosimetry.
INTRODUCTION
In Brazil, breast cancer accounts for the highest female mortality rates. The breast cancer incidence and mortality have been gradually increasing. In 2000, 8,390 deaths caused by breast cancer were recorded. Of 402,190 new cases of cancer estimated for 2003, the breast cancer was the second more frequent in women and accounted for 41,610 new cases and 9,335 deaths(1). The first devices utilized for mammography in the sixties contained tungsten targets and did not utilize breast compression devices. Afterwards, the molybdenum-molybdenum (Mo-Mo) target-filter started being frequently utilized for diagnostic studies. The Mo target-filters thickness employed in mammography X-rays units ranges between 15 µm and 30 µm(2,3). Notwithstanding, few information is found in literature about alterations occurring when different Mo filtrations are employed(3,4). Both the image quality and the mean glandular absorbed dose are influenced by the breast thickness and its composition (proportion of glandular tissue and fat) as well as the quality of the X-ray beam (kVp and filtration).
This study seeks to analyze the concept of figure of merit, that is a measure utilized for normalizing dose effects related to glandular dose and subject contrast for different voltages applied to Mo targets and for different rhodium (Rh) and molybdenum (Mo) filters in a non-anatomical BR12 phantom.
MATERIALS AND METHODS
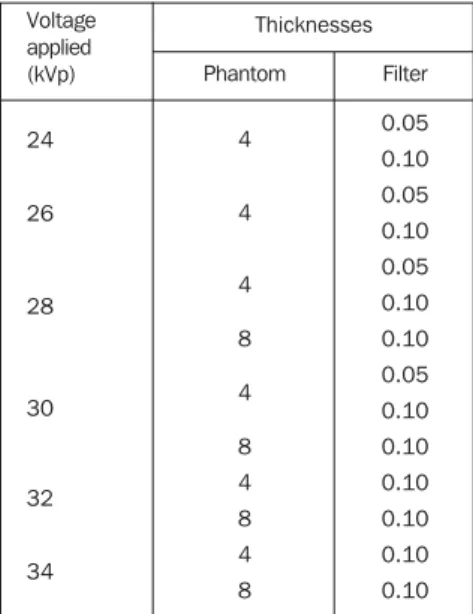
This study was developed with a Lorad MIII mammography X-ray equipment. For a detailed analysis of the figure of merit and exposure time, filters of different thicknesses and materials like Rh and Mo were utilized. The Table 1 shows the different thicknesses analyzed for materials of additional filters studied.
Films utilized for data acquisition were MinR (Kodak), screen films processed in a Multiloader K(Kodak) processor.
Subject contrast and glandular were determined by means of images generated by the BR12 phantom, applying the attenuation coefficients and X-ray spectrum model proposed by Tucker et al.(2). The phantoms utilized were constituted by two 10.0 x 10.0 x 8.0 cm and 10.0 x 10.0 x 4.0 cm rectangular blocks representing respectively a dense breast and a low-density breast(4–7). Two sequences for data acquisition were necessary.
The subject contrast was estimated by means of the BR 12 phantom images with aluminum filtration (Al). This material was selected for presenting a contrast similar to that caused by microcalcifications. The phantom was positioned on the bucky horizontal center with its center distant 4 cm from the thoracic wall, i.e., 4 cm distant from the bucky external front side. One of the (0.5 ± 0.1) mm or (1.0 ± 0.1) mm Al filters was placed on the phantom and positioned on its geometrical center as described in Figure 1. The geometry combinations utilized in association with different Al filters can be observed on Table 2.
The equipment technical parameters were selected to produce optical densities between 1.00 and 1.20 on the central images (Al filter + phantom) and 1.60–2.50 optical density in the surrounding image (only from phantom). The selected techniques should control the voltage applied to the tube according to the thicknesses of the phantom, additional filtration (Mo or Rh) and Al filter, resulting in images with the desired optical densities.
The data set constituting the analysis bank included all the possible combinations of filters and 4 cm and 8 cm thickness phantoms for a voltage range applied to a 24 kVp to 34 kVp tube (at 2 kVp intervals).
The optical density was measured on the center of the image produced by the AL filter and lateral adjacent areas (right and left). The subject contrast (CO), representing the optical density difference between two different regions on the film, was calculated by means of the following equation, as proposed by Gingold et al.(8):
CO = (v2)L
where L represents the sensitometric latitude equivalent to the lateral and central optical densities average.
The correlation between subject contrast and determined latitude was established on the basis of sensitometric curves specific of the film and processing system utilized. Several sensitometric curves were drawn during the data collection, aiming at correcting alterations resulting from images processing variations.
As the so called “useful area” of the sensitometric curve presents a linear behavior and data collected in this study are in these optical densities region, linear approximation were utilized for determination of each image optical density. The “steps” values resulted in the correspondent latitude.
The glandular dose (Dg) was estimated through a semi-empirical method considering the skin entry exposure (XESE) and the normalized glandular dose (DgN), related by the following
equation:
Dg = DgN. XESE
XESE represents the primary beam entry region air exposure in the phantom, the
measurements being performed directly on the primary beam, with the field size slightly greater than the chamber volume (not considering the backscattering). Measurements were performed with the compression device under the primary beam.
Values for XESE were estimated through measurements performed in primary beam
considering mAs values for each image obtaining an optical density of 1.5 for each phantom thickness and for all the combinations of target, filter and tube voltage studied. Values for mAs were experimentally estimated.
For a comparative data analysis, the expression FDM (figure of merit) was employed. The figure of merit is the usual method for analyzing the dose effects, considering the image quality as a comparison pattern. The following equation demonstrated the relation for determining figure of merit.
FDM = CO²/Dg
RESULTS
The results reported in this study were based on semi-empirical data. Equations were created to allow data interpolation, aiming at estimating the subject contrast, the glandular dose and exposure time.
As a comparative term for the patient radiological protection analysis, we have observed the exposure time and the figure of merit, so a ratio analysis between subject contrast and glandular dose and exposure time can be configured. In some cases, the isolated figure of merit analysis may be difficult since it specifies the relation between subject contrast and glandular dose.
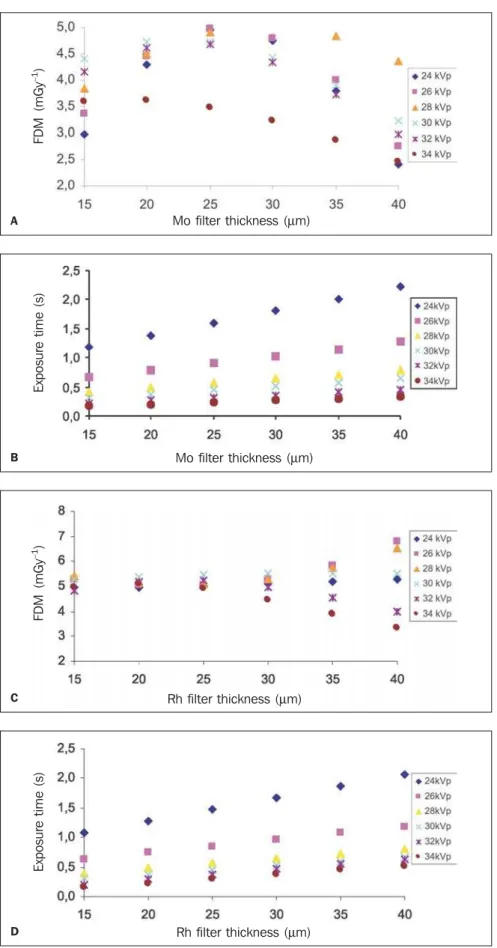
Figures 2A and 2B show the behavior of the figure of merit and exposure time for Mo additional filters and a 4 cm-thick phantom. In this case, for all the voltages applied to filter thicknesses between 15–25 µm, the figure of merit has shown an increasing trend, decreasing for the voltages applied to filter thicknesses above µm 25. Higher figures of merit were found between 25–35 µm filtrations for 26 kVp - 28 kVp voltages. Figures 2C and 2D show the figure of merit and exposure time behavior for 4 cm-thick phantoms and additional Rh filters. The graphic in Figure 2C shows lower figure of merit values than the graphic in Figure 2A for filtrations found in commercialized devices. Exposure times were similar in both situations. This demonstrates that Mo-Mo combinations between 25–35 µm filtrations and 26–28kVp voltages are the best alternatives for lower-density breasts.
On the other hand, Figures 3A and 3D demonstrate the figure of merit and exposure time behavior for additional Mo and Rh filters and 8 cm-thick phantom. In this case, the figure of merit was approximately 13 times higher for combination Mo-Rh target-filter, and exposure time presented a 3-4 times increase in average. As Rh filters usually employed in mammography devices presented a 25 µm thickness, the effectiveness of the Rh-Mo combination compared to Mo-Mo combination for generating dense breasts images is demonstrated.
Generally, the exposure time presented a linear increasing trend with increase in the tube voltage applied, and a decreasing trend for the same voltage and increase in the thickness of the material utilized as additional filter. The exposure time increased approximately 10 times for 30 kVp - 34 kVp voltages in the comparison between 4 cm and 8 cm-thick phantoms.
This process allows magnitudes estimates which support the risk-benefit analysis and can be applied directly to the mammography practice. For utilizing these equations it is necessary to know the Rh and Mo filters thicknesses expressed in micrometres. Equations generated for 4 cm-thick phantoms are recommended for low-density breasts evaluation and those generated for 8 cm-thick phantom are recommended for dense breasts evaluation.
DISCUSSION
estimates based on published glandular dose and subject contrast values analyze the additional filtration values of mammography devices (30 µm for Mo and 25 µm for Rh). Notwithstanding, in the present study the figure of merit and exposure time values were analyzed considering a 25.9–44.6 µm additional Mo filters thickness interval and a 17.4–36.7 µm additional Rh filters thickness interval, increasing the possibility of analyzing the glandular dose and subject contrast behavior.
In a simplified way, this study presents a mathematical formalism that allows estimation of glandular dose as well as subject contrast and exposure time, aiming at determining a comparative parameter of radiological protection with basis on the Rh and Mo additional filters thickness of the mammography device employed. Although the equipment characteristics (with additional filtration) are described in manuals, currently it is impossible to choose the additional filtration thickness in a mammography equipment process of purchasing. If necessary, reduction layer measurements are employed for estimating the additional filtration thickness.
Results give the technicians the opportunity to select a better combination of technical parameters (target material, filter and tube voltage), optimizing the patients´ radiological protection without compromising the image quality.
This study, utilizing the BR phantom, has limited the dose estimation for breasts presenting equal glandular tissue/fat proportions. The X-ray tube utilized for data collection had a single Mo target with Mo and Rh filters. In the future, it is our intention to continue this study, analyzing other phantom thicknesses (2 cm and 6 cm) for the same conditions already studied and for different target-filter combinations.
REFERENCES
1. Ministério da Saúde. Instituto Nacional do Câncer – INCA. (Acessado em setembro/2004). 2. Tucker DM, Barnes GT, Wu X. Molybdenum target X-ray spectra: a semi empirical model. Med Phys 1991;18:402–440.
3. Barnes GT. Mammography imaging physics: X-ray equipment considerations. RSNA Categorical Course in Breast Imaging0 1999;41–57.
4. Wu X, Barnes GT, Tucker DM. Spectral dependence of glandular tissue dose in screen-film mammography. Radiology 1991;179:143–148.
6. Wu X, Gingold EL, Barnes GT, Tucker DM. Normalized average glandular dose in molybdenum target-rhodium filter and rhodium target-rhodium filter mammography. Med Phys 1994;193:83–89.
7. International Commission on Radiation Units and Measurements. Tissue substitutes in radiation dosimetry and measurement. ICRU Document 44, 1989.
8. Gingold EL, Wu X, Barnes GT. Contrast and dose with Mo-Mo, Mo-Rh, and Rh-Rh target-filter combinations in mammography. Radiology 1995;195:639–644.
Table 1 Filters thicknesses utilized for data col-lection.
Material
Mo
Rh
Thickness (µm)
15.9 ± 0.1
20.9 ± 0.1
30.9 ± 0.1
44.6 ± 0.1
17.4 ± 0.1
22.4 ± 0.1
33.7 ± 0.1
Table 2 Combination of voltage, phantom and Al filtration thicknesses utilized for data collection.
Voltage applied (kVp) 24 26 28 30 32 34 Phantom 4 4 4 8 4 8 4 8 4 8 Filter 0.05 0.10 0.05 0.10 0.05 0.10 0.10 0.05 0.10 0.10 0.10 0.10 0.10 0.10 Thicknesses
Table 3 Data interpolation equations for estimating subject contrast, glandular dose and exposure time for two phantom thicknesses (4 cm and 8 cm) and all tube voltages (kVp) researched for Mo filters.*
Voltage (kVp) 24 26 28 30 32 4 cm –0.005x²+0.2703x–0.3609 –0.0042x²+0.2249x–0.0467 –0.0019x²+0.1091x+1.1698 –0.0011x²+0.0575x+1.753 –0.001x²+0.054x+1.6155 –0.0005x²+0.0267x+1.781 8 cm — — — –0.0006x²+0.0323x+1.4085 –0.0005x²+0.0254x+1.3774 –0.0002x²+0.0123x+1.4529 4 cm 0.0011x²–0.049x+2.7005 –9e–5x²+0.01x+1.5581 –0.0003x²+0.0146x+1.3195 0.0006x²–0.0187x+1.415 0.0011x²–0.0435x+1.5702 0.0006x²–0.01236x+1.2432 8 cm — — — 0.001x²+0.1606x+5.4368 0.0032x²–0.0635x+6.5166 0.0051x²–0.1731x+6.565 4 cm 0.0417x+0.5533 0.0242x+0.3021 0.0146x+0.2036 0.0132x+0.118 0.009x+0.091 0.0067x+0.0686 8 cm — — — 0.2437x–0.162 0.1145x+0.428 0.0728x+0.318 Subject contrast† Glandular dose (mGy)† Exposure time†
Phantom thickness (cm) Phantom thickness (cm)
Phantom thickness (cm)
* These data present interpolation equations with an estimated 10% maximum percent deviation. † In these equations the variable x represents the additional filtration thickness in micrometres.
Table 4 Data interpolation equations for estimating subject contrast, glandular dose and exposure time for two phantom thicknesses (4 cm and 8 cm) and all energies researched for Rh filters.*
Voltage (kVp) 24 26 28 30 32 34 4 cm
–4e–6x2–0.0028x+2.816
–2e–5 x2
+0.0063x+2.4552 0.0005x2–0.0207x+2.6444 –0.0007x2+0.0426x+1.7762 –0.0005x2
+0.0401x+1.6123 –0.0002x2+0.018x+1.8524
8 cm
—
— —
0.0002x2–0.0055x+1.821
0.0002x2
–0.0009x+1.6377 0.0003x2–0.0105x+1.7015
4 cm
–0.0001x2–0.0017x+1.6052
–0.0012x2
+0.059x+0.6151 –0.0006x2+0.0309x+0.7751 –0.0005x2+0.0294x+0.6349
0.0008x2
–0.0222x+1.0709 0.0011x2–0.0347x+1.1475
8 cm
—
— —
0.0021x2–0.0226x+6.8595
–0.0047x2
+0.3267–0.2042 –0.0003x2+0.0231x+0.0695
4 cm 0.0398x+0.4772 0.022x+0.3043 0.0161x+0.1615 0.0143x+0.0969 0.0175x–0.0616 0.0148x–0.0713 8 cm — — — 0.2394x+0.0082 0.149x–0.0012 0.1099x–0.3063 Subject contrast†
Glandular dose (mGy)†
Exposure time†
Phantom thickness (cm) Phantom thickness (cm)
Phantom thickness (cm)
* These data present interpolation equations with an estimated 10% maximum percent deviation. † In these equations the variable x represents the additional filtration thickness in micrometres. Figure 1. Scheme of system geometry utilized for images acquisition
Figure 2. Figure of merit (FDM) behavior and exposure time in seconds, depending on voltage for a 4 cm phantom. Figure of merit (A) and exposure time (B) for Mo filters. Figure of merit (C) and exposure time (D) for Rh filters.
A
B
C
D
E
xp
o
su
re
ti
m
e
(s
)
FD
M
(
m
G
y
–
1 )
E
xp
o
su
re
ti
m
e
(s
)
FD
M
Rh filter thickness (µm) Rh filter thickness (µm)
Figure 3. Figure of merit (FDM) behavior and exposure time in seconds, depending on filter thickness and voltage for 8 cm phantom. Figure of merit (A) and exposure time (B) for Mo filters. Figure of merit (C) and exposure time (D) for Rh filters.
D C B A
Rh filter thickness (µm) Rh filter thickness (µm) Mo filter thickness (µm)
Mo filter thickness (µm)
FD
M
FD
M
(
m
G
y
–
1)
E
xp
o
su
re
ti
m
e
(s
)
E
xp
o
su
re
ti
m
e
(s