Is Fiscal Federalism Different in the European Union? A Comparative
Analysis Through the Allocation Function
Paulo Vila Maior
Assistant Professor, Universidade Fernando Pessoa Praça Nove de Abril, 349
4249-004 Porto, Portugal E-mail: [email protected]
Paper for the 2nd. Conference on the Political Economy of International Organizations, January 29-31, 2009 at the University of Geneva and the Graduate Institute of International Studies, Switzerland.
Abstract
A political-economic model largely influenced by the monetarist school inspires European Economic and Monetary Union (EMU). Accordingly, neither income redistribution nor resource allocation is the cornerstone of economic policy mix. That role is reserved to the stabilisation function. Among those scholars who discuss whether the EU is comparable to existing cases of “conventional fiscal federalism”, the analysis is frequently concentrated on allocation and redistribution. Despite macroeconomic stabilisation is the key aspect of EMU, the paper undergoes a comparative analysis between the European Union (EU) and five mature federations (United States, Canada, Australia, Germany, and Switzerland) as far as resource allocation is concerned. It first surveys the operation of the allocation function in these countries, concluding that there are remarkable differences when the countries under examination are measured within a centralisation/decentralisation continuum. Resource allocation is subsequently reviewed in the context of EMU to capture convergences and divergences with the federations examined – and to what extent do convergent aspects contribute to put a label on the EU in terms of fiscal federalism. The awareness that the discussion is sometimes plagued with conceptual oversight – the confusion between the desirability and feasibility of fiscal federalism in the European integration context – paves the way to the empirical dimension. The paper concludes with an input from statistical data assessing to what extent inter-state solidarity exists (or is absent) in the EU.
INTRODUCTION
federalism in the European Union (EU): other monetary unions’ institutional setting comprises fiscal federalism.
Political scientists do not agree whether European integration in general should be open to the comparative method. For some, the EU is a unique polity. Therefore, the EU should stand outside the realm of comparative politics studies for their inappropriateness regarding EU’s sui generis nature (Burgess 2000, Dunn 2000, and Moravcsik 2001). Conversely, others acknowledge the potential of comparative studies. Notwithstanding they reckon the distinctive nature of European integration, they are aware of the polity dimension of the EU. For that reason, the EU cannot evade the comparison with other polities, especially with federal states (Jachtenfuchs 2002, Neyer 2006, and Inman 2007). The comparative exercise is open to contention, as some conclude that it provides a clear-cut federal nature of the EU (Elazar 2001, McKay 2001, and Menon and Weatherill 2002) while others reach the opposite conclusion (Crowley and Rowley 1998, Egeberg 2001, and Vrousalis 2006).
Two remarks for methodological purposes are needed at the outset. First, it is important to say something about the conceptual meaning of fiscal federalism. Here fiscal federalism is a constitutionalised system that focuses on the distribution of fiscal powers between the federal and state (and even local) governments in federal states (as parallels of the supranational and the national levels in the EU). This traditional understanding considers a threefold dimension (allocation-equity-stabilisation). ‘Conventional fiscal federalism’ refines this concept. It is a characteristic of federal countries where fiscal
federalism has deep-rooted traditions, with a discernible centralisation outcome as far as the overall assignment of policy competences is concerned.
stabilisation that makes fiscal federalism noticed in federal countries. Interestingly, macroeconomic stability is a key aspect of economic policy-making in the EU, insinuating another source of dissimilarity between the EU and countries where ‘conventional fiscal federalism’ exists. Nonetheless, idiosyncratic reasons lying behind the specifics of European integration – and EMU in particular, with its “culture of stability” (Underhill 2002) – explain why this function is so important in the European context.
Although distinctiveness is one core aspect of European integration, this approach does not reject the comparative method. It might be useful to survey other federations, particularly to capture the features of ‘conventional fiscal federalism’. This method can be an interesting guiding light to assess whether the EU fulfils the conditions of ‘conventional fiscal federalism’. It can be helpful on two accounts: to find out that certain elements of fiscal federalism already fit with European integration, or the strong dissimilarities backed up by the distinctiveness of the EU.
Second, the comparative method is a useful tool to assess the feasibility of ‘conventional fiscal federalism’ in the EU. I examine the design and implementation of the allocation function in five federations (Australia, Canada, Germany, Switzerland, and the United States). These federal countries are the benchmarks against which the EU is compared. A crucial analytical tool is the degree of centralisation or decentralisation in each federation. This method can shed light to the EU, especially when the EU experiences comparison with other federations.
1. RESOURCE ALLOCATION IN FEDERAL COUNTRIES
What is at stake with allocation is the provision of public goods assigned to the federal government and to lower tiers of government (Musgrave and Musgrave 1989, and Bailey 1999). One rough measure is to examine the distribution of taxing powers between the several tiers of government involved in the five federations observed (Inman and Rubinfeld 1999). It ranges from a system where concurrent powers are the key aspect, albeit hiding a strong centralisation bias, to other cases of absent rules on the allocation of taxing powers, to a third model showing a balance between the taxing powers assigned to the federal government and to lower units of government.
Taking the lesson of conventional public finance (Stiglitz 1988, and Musgrave and Musgrave 1989), the general principle is that in multi-jurisdictional units the allocation function depends on the geographical dimension of the benefit associated with the provision of a given public good. For goods and services with cross-jurisdictional negative externalities pushing towards central provision, allocation is a competence of the federal government. Conversely, when mapping the benefits accruing on to a given jurisdiction is possible, the allocation function belongs to that jurisdiction (Filippov, Ordeshook and Shvetsova 2004).
The distribution of taxing powers in the five federal countries reveals the following tendencies:
(i) A system anchored on a constitutional principle of concurrent powers between the federal, state and local levels. The United States fits into this
pattern (Eichengreen 1997).
Canada also matches these characteristics, despite some differences between the Canadian and the United States’ tax structures. A system of concurrent powers between central and provinces’ governments also prevails in Canada (Stevenson 2004). There is, however, a difference after analysing the outcome of the Canadian tax system: federal taxes account for roughly 50% of the United States’ tax income when weighted on the total collection of taxes in both countries (Simeon and Robinson 2004). Two further dissimilarities with the United States’ model emerge: indirect taxes are more important than social security payments; and within provinces, income and corporation taxes raise almost as much money as indirect taxes (Bayoumi and Masson 1996).
(ii) No rules about the distribution of taxing powers among different tiers of government: Germany falls into this category.
In Germany, a strong federal government is largely influential in several issues. Consequently, the notion of ‘unitary federation’ comes to the surface (Spahn 1993). Despite this finding, the federal Constitution does not establish precise rules for the distribution of taxing powers (Seitz 2000). Therefore competences rest on the Länder unless otherwise is stated in the Constitution (Zimmermann 1999, and Gunlicks 2003). Nonetheless, the word ‘unless’ encompasses many exceptions in the German constitutional context. In practice, what is taking place is a deformation of this functional principle. In fact, the Länder can legislate only if the federal government has not already legislated on that issue. There is evidence of tax issues been increasingly subject of federal legislation over the past forty years (Zimmermann 1999). Overall, the principle of shared competences is slightly more than dead wording. The practical consequences of the German system point to an opposite direction: one the one hand, a strict separation of fiscal competences between all tiers of government is noticed; and, on the other hand, the system exhibits a clearly centralisation bias (Seidel and Vesper 1999).
(iii) A third model is a clear separation of taxing powers between the federal government and other levels of government. Switzerland and Australia
are included in this category, although they represent different outcomes as far as the centralisation/decentralisation continuum is concerned. In Switzerland, the practical dimension of the so-called ‘tax jungle system’ (Dafflon 1999) makes it difficult to establish an unambiguous categorisation. The Swiss case, however, lays down clear guidelines on fiscal autonomy for the central, cantonal and local levels. Considerable tax competition between different cantons gives a further input to the confusion (Feld, Kirchgässner and Schaltegger 2003). Despite the breadth of tax powers assigned to the cantonal level, the rule allowing the central government to set limits on cantons’ total expenditures puts some constraints.
Australia is the most centralised example among these federations (Galligan and Wright 2002). The federal government collects 91% of total tax revenue (Spahn 1993). As a result, there is a huge imbalance between federal and states’ outlays and responsibilities, given that states fall short of revenues to meet all expenditures constitutionally assigned to them (Thorlakson 2003). Consequently, states largely depend upon transfers from the federal government – more than in any other country case under examination.
1.1. How (de)centralised are the five federations?
The above analysis makes it possible to place all five federations along a continuum between centralisation and decentralisation. These five countries will be placed on the centralisation spectrum for the provision of public goods using Riker’s and Nathan’s methods (sections 1.1.2 and 1.1.3, respectively).
1.1.1. Surveying the distribution of tax competences
centralised case among the five countries (as it will be highlighted soon after), the next place in the centralisation continuum remains open to two countries, Germany and the United States. The comparison between both countries’ federal elements, and particularly the provision of public goods and services by the federal government and lower units of government, feeds the idea that the United States is not as centralised as Germany.
In this respect, it is instructive to analyse how the powers of the federal government have been growing in these countries throughout the years. Scholars emphasise this is a characteristic that unites both the United States and Germany. Historically, these federations were more decentralised than today. This is clearly the case of the United States, where especially after 1965 creeping centralisation is taking place (with a minor retrocession during the Reagan administration) (Zimmerman 1992). A similar pattern has been widely reported in Germany, where central decision-making process is coupled with highly decentralised implementation. On this behalf, Germany offers mixed evidence of centralisation and decentralisation, thus locating it in between the extremes of the continuum.
Notwithstanding, Germany is perceived as a unitary federation (Benz 1999). In practice, the Länder are severely constrained to exercise their constitutionally guaranteed powers whenever the federal government has already produced legislation. Both aspects reveal a centralisation tendency coming to the surface. On the one hand, the qualification of Germany as a ‘unitary federation’ already encompasses the assumption of centralisation. On the other hand, the limits imposed to the Länder mean the central government benefits from the presumption to act. From the comparison between the United States and Germany, the former comes after Canada and precedes Germany in the centralisation continuum. In scaling down countries within the continuum, the United States lie in the middle while Germany comes up as the second most centralised federation.
(Worthington and Dollery 2002): (i) general revenue grants mean 50% of state revenues and they are locked to quasi-constitutional rules; (ii) states’ role is deeply rooted in the Constitution; (iii) the federal government is unable to cut all grants going to states; and (iv) in order to uphold political stability in the federation, the federal government is forced to reach an agreement with states’ governments. In sum, ‘(…) financial arrangements in Australia have been preserving and securing state independence and
the lower tier of government is far from being at the mercy of the Commonwealth’
(Spahn 1993: 44-5).
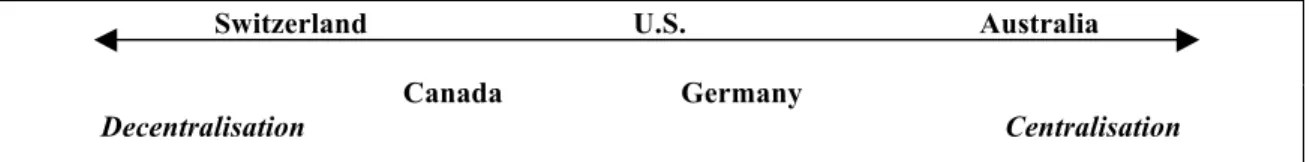
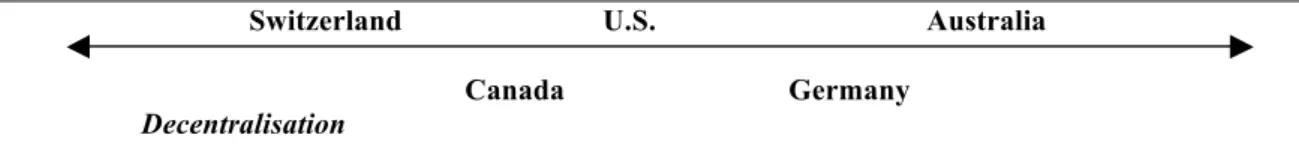
For these reasons, the exercise of mapping down a centralisation/decentralisation scale must follow prudential standards. The idea that the most decentralised federation stands at the extreme of decentralisation while the most centralised federal reflects accentuated centralisation is not entirely accurate. Relativism is the keyword when conclusions on the mapping exercise are drawn. One federal country that comes at the top of centralisation does not equate absolute centralisation, only that it is relatively more centralised than other federal countries examined. The following illustration shapes this argument.
Fig 1: A scale of relative centralisation/decentralisation in five federal countries (first hypothesis)
1.1.2. The results using Riker’s adjusted method
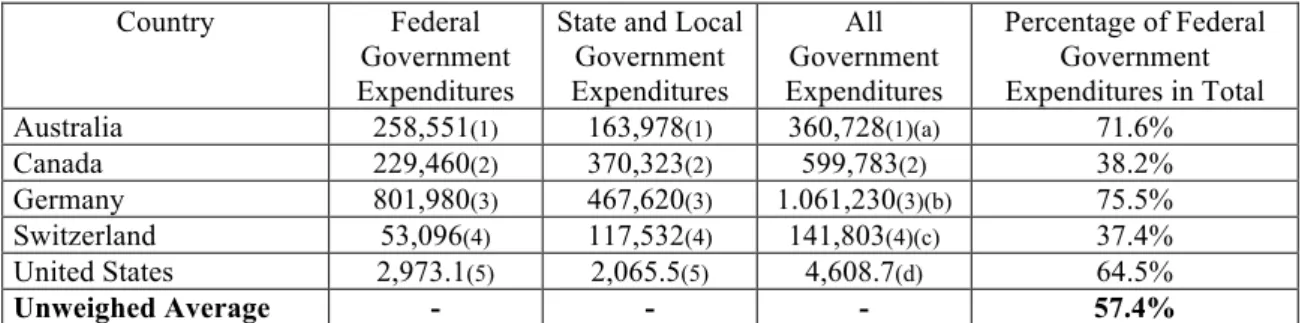
Reliable conclusions ask for alternative methods that shed empirical inputs to frame the picture of relative standings in the centralisation/decentralisation spectrum. Starting with Riker’s method, a short note presents the aspects included in this method (Riker 1964: 123-35). The degree of decentralisation is measured by (a) the estimation of central governments’ expenditures, (b) states’ expenditures, and (c) local governments’ expenditures. All three layers’ expenditures are added to estimate the percentage of central government’s total expenditures. The lower this percentage is the higher the degree of decentralisation.
Switzerland U.S. Australia
Canada Germany
Table 1: Estimating the degree of centralisation in five federal countries according to Riker’s method – percentage of federal government expenditures on total
Country Federal
Government Expenditures
State and Local Government Expenditures
All Government Expenditures
Percentage of Federal Government Expenditures in Total
Australia 258,551(1) 163,978(1) 360,728(1)(a) 71.6%
Canada 229,460(2) 370,323(2) 599,783(2) 38.2%
Germany 801,980(3) 467,620(3) 1.061,230(3)(b) 75.5%
Switzerland 53,096(4) 117,532(4) 141,803(4)(c) 37.4%
United States 2,973.1(5) 2,065.5(5) 4,608.7(d) 64.5%
Unweighed Average - - - 57.4%
Notes:
(1) Australian Government Finance Statistics, data for 2006-07 in millions of Australian Dollars. Source: Australian Bureau of Statistics (2008), assessed online at http://www.abs.gov.au/ausstats/[email protected]/mf/5512.0 in 17.09.08.
(a) The total does not match with the sum of federal, state and local governments’ expenditures due to an amount (14,588 Australian Dollars) belonging to the ‘multi-jurisdictional sector’. According to the Australian Bureau of Statistics, this sector includes “(…) units where jurisdiction is shared between two or more governments, or classification of a unit to a jurisdiction [that] is otherwise unclear”.
(2) Canada All Government Expenditures, data for 2007 in millions of Canadian Dollars. Source: Statistics Canada (2008), assessed online at http://www.statcan.ca/english/freepub/68-213-XIE/68-213-XIE2008000.pdf in 18.09.08.
(3) Expenditures of the overall public budget by levels, data for 2007 in millions of Euro. Sources: Eurostat (2008a), online at
http://epp.eurostat.ec.europa.eu/portal/page?_pageid=1996,39140985&_dad=portal&_schema=PORTAL &screen=detailref&language=en&product=EU_MAIN_TREE&root=EU_MAIN_TREE/tb/t_economy/t_ gov/t_gov_a/tec00023, assessed in 19.09.08, and Eurostat (2008b), online at
http://epp.eurostat.ec.europa.eu/portal/page?_pageid=1996,39140985&_dad=portal&_schema=PORTAL &screen=detailref&language=en&product=EU_MAIN_TREE&root=EU_MAIN_TREE/tb/t_economy/t_ na/t_nama/t_nama_gdp/tec00001, assessed in 19.09.08.
(b) Adjusted for payments between different layer budgets, therefore adding-up is not possible.
(4) General Government Operations, data for 2006 in millions of Swiss Francs. Source: online at http://www.efv.admin.ch/e/dokumentation/downloads/dokumentation/zahlen_fakten/statistik/SDDS_jahr-rechnung-schulden_en.pdf, assessed in 19.09.08.
(c) Certain categories of expenditure involve co-financing from different government levels. Thus, total government expenditure is not the mere addition of all government tiers’ expenditures.
(5) United States All Government Consumption Expenditures, data for 2007 in billions of U.S. Dollars. Source: United States Census Bureau (2008).
(d) Certain categories of expenditure involve co-financing from different government levels. Thus, total government expenditure is not the mere addition of all government tiers’ expenditures.
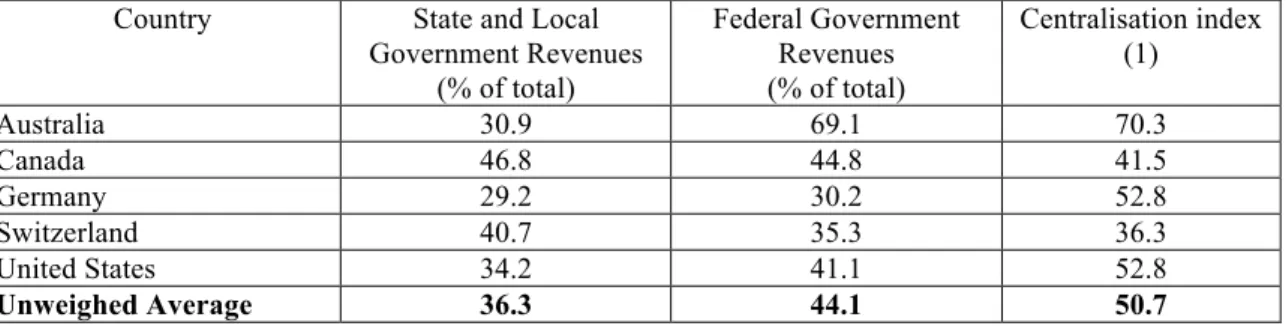
Table 2: A complement to Riker’s method – measuring the percentage of federal government revenues in total (2005)
Country State and Local Government Revenues
(% of total)
Federal Government Revenues (% of total)
Centralisation index (1)
Australia 30.9 69.1 70.3
Canada 46.8 44.8 41.5
Germany 29.2 30.2 52.8
Switzerland 40.7 35.3 36.3
United States 34.2 41.1 52.8
Unweighed Average 36.3 44.1 50.7
Source: OECD (2007).
(1) The sum of the relative weight of federal governments’ expenditures (the last column in table 1) and the relative weight of federal governments’ revenues (second column in table 2) divided by two.
The observation of the results provided by what I would call ‘adjusted Riker’s method’ deploys a slightly different centralisation/decentralisation scale.
Fig. 2: A scale of relative centralisation/decentralisation in five federal countries (second hypothesis)
The relevant difference is fed by the same centralisation index of Germany and the United States, putting both countries on a overlapping position. In the first hypothesis (a qualitative one) Germany was more centralised than the United States. According to quantitative data based on revenue and expenditures across all government layers, both countries stand in the same position alongside the centralisation/decentralisation spectrum. Another instructive lesson is the awareness that none of these countries is totally centralised or decentralised. It would be surprising that full centralisation was the outcome after surveying statistical data, for centralisation does not match with federalism’s genetic code. In fact federalism is more open to decentralisation nature, at least when its theoretical underpinnings are remembered (Rodden 2006: 31-32). The figures reveal that Switzerland, the most decentralised country, has an index of 36.3% (full decentralisation means a zero index) while Australia, the most centralised one, ranks 70.3% (centralisation means 100%).
The interesting conclusion is the awareness that federalism might mean different things when the balance between centralisation and decentralisation is at stake. The difference between Switzerland and Australia is remarkable. Figures can be interpreted as follows: in the Swiss (con)federation two thirds of fiscal competences are left to lower units of government; in the Australian federation, on the contrary, two thirds of fiscal competences (and thus the revenue for making resource allocation operational) are
Switzerland U.S. Australia
Canada Germany
Decentralisation
granted to the federal level. Therefore, federalism might have different meanings when centralisation and decentralisation are at stake. This provides support to the claim that there is not a single fiscal federalism, but instead distinct fiscal federalisms (as the
extension of the ‘many faces of federalism’ argument (Lenaerts 1990)). Such conclusion might prove useful for the feasibility of successful fiscal federalism in the EU.
1.1.3. The results using Nathan’s method
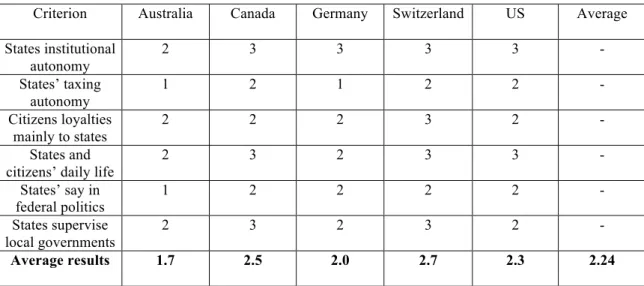
The third test returns to a combination of qualitative with quantitative measurement. The method borrows from Nathan’s analysis (Nathan 1992: 92-3) using a multi-dimensional framework with the following variables: (a) are lower government tiers autonomous to shape political institutions? (b) Are lower government tiers able to collect their own taxes? (c) Are lower government tiers the most important points of contact with citizens? (d) Do lower tiers possess important competences affecting citizens’ daily activities? (e) Are lower government tiers given a powerful say in national (federal) politics? (f) Do state governments perform a supervisory role towards local governments without any intrusion from the federal government?
To assess the five countries within this framework it is necessary to parameterise Nathan’s method variables. If the answer is affirmative in all six conditions, the expected outcome is an institutional setting consistent with a powerful say to lower tiers of government, thus a decentralised outcome.
Criterion Australia Canada Germany Switzerland US Average
States institutional autonomy
2 3 3 3 3 -
States’ taxing autonomy
1 2 1 2 2 -
Citizens loyalties mainly to states
2 2 2 3 2 -
States and citizens’ daily life
2 3 2 3 3 -
States’ say in federal politics
1 2 2 2 2 -
States supervise local governments
2 3 2 3 2 -
Average results 1.7 2.5 2.0 2.7 2.3 2.24
Fig. 3: How decentralised are the five federal countries (using Nathan’s qualitative assessment)?
To quantify I suggest a score of 3 for Y, 2 for I, and 1 for N. After computing all the variables for each federal country, the higher the result the more decentralised the country stands.
The interpretation of these data paves the way for another exercise that deploys the five federal countries within the centralisation/decentralisation scale.
Fig. 4: A scale of relative centralisation/decentralisation in five federal countries (third hypothesis)
Federal countries’ positions within the scale are the same as in the first continuum. Therefore, some continuity prevails in the three methods used to estimate where to place the five federal countries. More important than this range is the awareness that federal countries somewhat differ when placed alongside the continuum deploying how centralised/decentralised they are. This reveals different tendencies depending on the country under examination. When the allocation function is under scrutiny, some countries’ federal system is heavily centralised, while in others decentralisation prevails. The main lesson for European integration is the impossibility to draw robust inferences from a certain point alongside centralisation or decentralisation. Differentiation is the keyword. This exercise is also a useful building block if one claims that the EU cannot escape the lens of comparative studies. Like in all federal countries examined, the EU can also be measured in terms of centralisation/decentralisation and have its own place alongside the continuum of centralisation/decentralisation for the allocation function. 2. THE EUROPEAN UNION: A CASE OF DECENTRALISATION?
2.1. Resource allocation and European integration: basic principles
The methods used throughout the previous section provide an insight of resource allocation in the EU. At the same time, they are food for thought about the position of the EU in the centralisation/decentralisation continuum. Nevertheless, carrying over this task without precaution might involve some risks. The reason is the distinctiveness of the EU. Uniqueness does not imply the refutation of the comparative method. It is just a warning about the special nature of European integration that gave rise to a sui generis polity, somewhere in between a state and an international organisation (Koslowski 1999). Hence, it is difficult to draw oversimplified comparisons between the EU and
Switzerland U.S. Australia
Canada Germany
Decentralisation
other federal countries. In fact, the EU, unlike other federal entities, is not a federal state. Therefore, a nuanced approach is required to capture the distinctiveness of European integration. By implication, some of the preceding methods’ tools need to undergo adjustment to encompass the distinctiveness that shapes European integration. For example, it is difficult to come out with strict comparisons between different budgetary levels in mature federations and the equivalent (at least in theory) levels in the EU. It might be inappropriate to put at the same hierarchical level the federal budget (in federal countries) and the EU budget (in the EU). Similarly, the analogy between states’ budgets (in ‘conventional fiscal federalism’) and national budgets (in the EU) again involves a precautionary analysis. The reason for this warning is well documented in the writings highlighting European integration’s diversity (Ardy and El-Agraa 2007). A similar levelling exercise might be illusory, for different tasks belong to different budgetary levels in the EU and in federal countries.
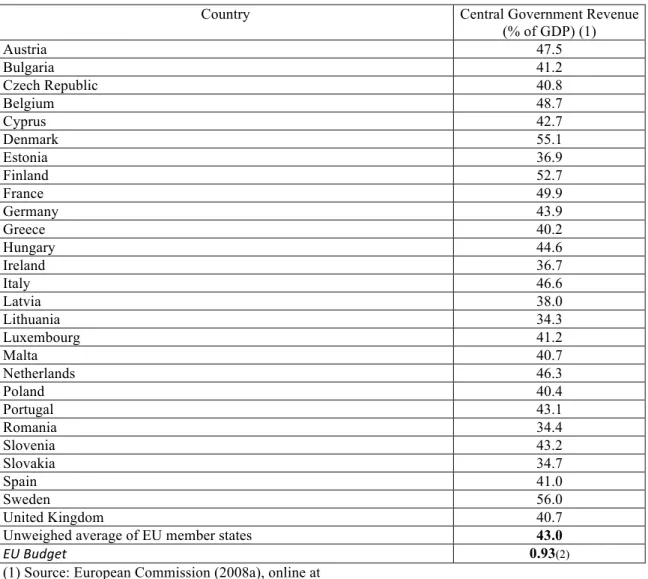
Table 3: Central government revenue in EU member states and comparison with EU budget revenues, 2007 (as % of GDP)
Country Central Government Revenue
(% of GDP) (1)
Austria 47.5
Bulgaria 41.2
Czech Republic 40.8
Belgium 48.7
Cyprus 42.7
Denmark 55.1
Estonia 36.9
Finland 52.7
France 49.9
Germany 43.9
Greece 40.2
Hungary 44.6
Ireland 36.7
Italy 46.6
Latvia 38.0
Lithuania 34.3
Luxembourg 41.2
Malta 40.7
Netherlands 46.3
Poland 40.4
Portugal 43.1
Romania 34.4
Slovenia 43.2
Slovakia 34.7
Spain 41.0
Sweden 56.0
United Kingdom 40.7
Unweighed average of EU member states 43.0
EU Budget 0.93(2)
http://ec.europa.eu/economy_finance/publications/publication12832_en.pdf, assessed in 24.09.08. (2) Source: http://eur-lex.europa.eu/budget/data/D2007_VOL1/EN/nmc-grseq42960935830-3/index.html, assessed in 24.09.08.
The inspection of the EU public finances provides an analytical device to assess how the allocation function is accomplished. Three aspects supply the potential explanation for EU budget’s inability to play a strong role in the allocation function (Hitiris 1994: 102). On the one hand, individual member states are still prominent actors in terms of budgetary politics (and policy). Secondly, widespread differentiation between member states’ traditions on the provision of public goods and services also plays a role. Last but not the least, member states face different needs, which gave rise to a different composition of public goods and services’ basket in each country. These are the endogenous reasons. Other reasons can be advanced (exogenous reasons), directly
impacting upon endogenous motivations.
Low visibility is the crucial aspect that makes the supranational budget weaker. This holds for the comparison between the EU budget and member states’ budgets in terms of revenue capacity, but also for the external comparison of the EU budget, i.e., when other federal countries’ central budgets are examined and quantified. The implication is that the EU is unable to deliver public goods and services as federal budgets elsewhere do. It is important to be aware that the allocation function in federal countries is not necessarily a symptom of central competences. When the benefits from the provision of certain public goods or services match with state’s geographical jurisdictions, the function is assigned to lower tiers of government. The federal government is entitled with a general competence to fund and/or provide public goods and services with nation-wide interests (as well as other goods and services where the federal level captured a competence in the meantime).
The main lesson from ‘conventional fiscal federalism’ is that the federal and lower tiers of government share the burden of providing public goods and services. Resource allocation does not belong only to a certain government level. To a certain extent, the EU falls into this category although supranational budget’s revenue is very limited to meet resource allocation goals – at least when the comparison between the EU budget and its counterpart in federal countries (central budgets) comes to the surface.
and Armstrong 2007). Shared competences are the baseline for the comparison between the EU and other federations for purposes of resource allocation. Problem-solving intensity assigned to the EU budget is, however, much lower than the role performed by other countries’ federal budget. This results from the combination of endogenous and exogenous factors previously emphasised in this section.
2.2. The EU in the centralisation/decentralisation spectrum
I will use the three previous methods for estimating how the EU fits into the centralisation/decentralisation continuum when compared against the federations examined. For that purpose I use all the tables from section 1 (keeping all the notes and sources that were mentioned there), with the difference that each table comes added with data for the EU.
Table 4: Estimating the extent of centralisation in five federal countries and the EU according to Riker’s method – percentage of federal government expenditures in total
Country Federal
Government Expenditures
State and Local Government Expenditures
All Government Expenditures
Percentage of Federal Government Expenditures in Total
Australia 258,551 163,978 360,728 71.6%
Canada 229,460 370,323 599,783 38.2%
Germany 801,980 467,620 1.061,230 75.5%
Switzerland 53,096 117,532 141,803 37.4%
United States 2,973.1 2,065.5 4,608.7 64.5%
European Union 115.4(1)(a) 5,309.3(2)(a) 5,424.7 2.1%
Unweighed Average Without the EU (and with the EU)
- - - 57.4%
(48.2%)
(1) Source: http://eur-lex.europa.eu/budget/data/D2007_VOL1/EN/nmc-grseq42960935830-3/index.html, assessed in 24.09.08.
(2) Source: European Commission (2008b), online at
http://ec.europa.eu/economy_finance/indicators/annual_macro_economic_database/ameco_applet.htm, assessed in 24.09.08.
(a) Figures in billions Euros, data for 2007.
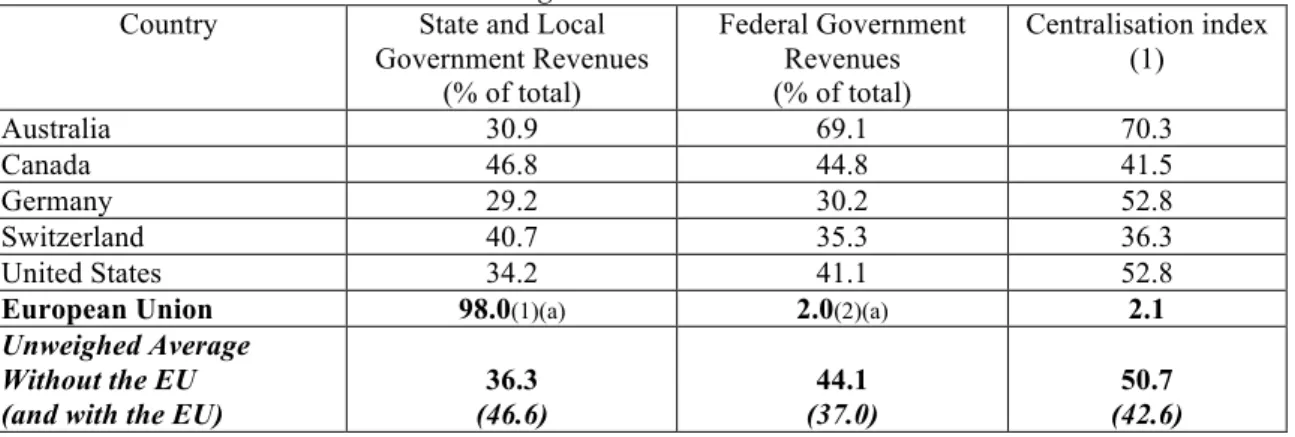
Table 5: A complement to Riker’s method – measuring the percentage of federal government and the EU budget revenues in total
Country State and Local Government Revenues
(% of total)
Federal Government Revenues (% of total)
Centralisation index (1)
Australia 30.9 69.1 70.3
Canada 46.8 44.8 41.5
Germany 29.2 30.2 52.8
Switzerland 40.7 35.3 36.3
United States 34.2 41.1 52.8
European Union 98.0(1)(a) 2.0(2)(a) 2.1
Unweighed Average Without the EU (and with the EU)
36.3 (46.6) 44.1 (37.0) 50.7 (42.6)
(1) Source: European Commission (2008b), online at
(2) Source: http://eur-lex.europa.eu/budget/data/D2007_VOL1/EN/nmc-grseq42960935830-3/index.html, assessed in 24.09.08.
(a) Data for 2007.
Turning to the complement of Riker’s method, in order to provide an overall picture addressing both items within all layers of budgetary power, I estimated revenues’ relative weight. The same exercise was done for the EU, according to the data depicted in table 5, above. Standing in line with the results of the ‘Riker-adjusted method’, and taken the other federal countries are as benchmarks, figure 5 plots the EU within the centralisation/decentralisation scale.
Fig. 5: A scale of relative centralisation/decentralisation in five federal countries and the EU (using ‘Riker’s-adjusted method’)
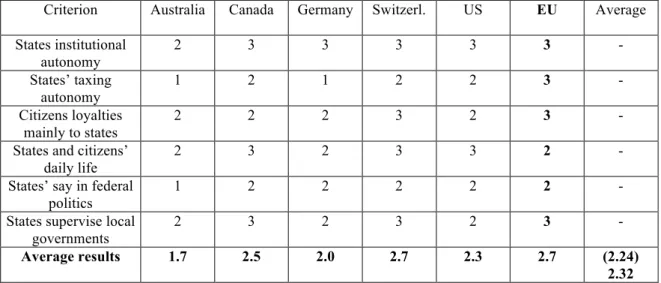
Turning to Nathan’s method, another version of fig. 3 directly compares the figures associated with the EU and the data already known for the other federations.
Table 6: How decentralised are the five federal countries and the EU (using Nathan’s qualitative assessment)?
Criterion Australia Canada Germany Switzerl. US EU Average
States institutional autonomy
2 3 3 3 3 3 -
States’ taxing autonomy
1 2 1 2 2 3 -
Citizens loyalties mainly to states
2 2 2 3 2 3 -
States and citizens’ daily life
2 3 2 3 3 2 -
States’ say in federal politics
1 2 2 2 2 2 -
States supervise local governments
2 3 2 3 2 3 -
Average results 1.7 2.5 2.0 2.7 2.3 2.7 (2.24) 2.32
As it happened with the foregoing method, the next step consists of deploying the results into the scale that ranks the continuum between centralisation and decentralisation for concluding whether the position of the EU is different when assessed through both methods.
Fig. 6: A scale of relative centralisation/decentralisation in five federal countries and the EU (using Nathan’s method)
Switzerland U.S. Australia
E.U. Canada Germany
Decentralisation Centralisation
Switzerland/EU U.S. Australia
Canada Germany
Decentralisation
Comparing figures 5 and 6, the difference (looking only to the inclusion of the EU in the scale) is that while according to ‘Riker’s adjusted method’ the EU is the most decentralised case among the countries observed, figure 6 positions the EU and Switzerland roughly at the same decentralisation standard. Nevertheless, it stands out clear that the EU ranks far more decentralised that the remaining federations.
All the evidence suggests that the EU is a case of decentralisation. One explanation lies
on endogenous aspects stemming from the powerful differentiation among member states and the deep-rooted sense of nationhood within member states (but not at the supranational level). Exogenous aspects supply the second explanation. They result from endogenous aspects and act as a powerful constraint on a more ambitious EU budget that creates a hard to remove ceiling. For these reasons, the EU has intrinsic federal elements and lies at the pole of decentralisation when compared with the other federations alongside the centralisation/decentralisation continuum.
CONCLUSION: IS THERE A PLACE FOR MORE CENTRALISED ALLOCATION IN THE EUROPEAN UNION?
Aside from this positive analysis, a normative question touches the future of European integration: do further developments in European integration call more centralisation, i.e., more supranational provision of public goods that currently fall under national
budgets? As a follow-up of this question, one might wonder if, strictly from the angle of
resource allocation, the EU is prepared to assemble the basic features of ‘conventional fiscal federalism’.
Is it feasible, under the current conditions of European integration, to envisage a centralisation leap of resource allocation in the EU? Three reasons deny the centralisation scenario. Firstly, creeping centralisation requires a change in the current political climate, notably the convergence of national governments’ preferences towards increasing EU budget own resources. Without fulfilling this condition, EU’s ability to play a stronger role in resource allocation is hampered.
Two obstacles play a huge influence against further centralisation of resource allocation. On the one hand, on the previous multi-annual financial framework (Agenda 2000) member states showed their unwillingness to increase the EU budget revenues (Galloway 1999, and Koester and El-Agraa 2007). On the other hand, the 2004-2007 enlargement added another hurdle to the goal of increasing the EU budget because member states and supranational institutions bargained an outcome of zero increase for budget outlays. Negotiations about multi-annual financial perspectives for 2007-13 showed deep divergences between national representatives, as the press has repeatedly reported1.
The second aspect is the awareness that a solution that gives more powers to the supranational tier entails a political and economic incongruity. Economically speaking, centralisation clashes against the principle of assigning public goods’ provision to the lowest government tier, especially when it is easy to find out the territorial delimitation of benefits. More importantly, centralisation runs against subsidiarity, one building block of European integration. To envisage the EU budget increasingly funding public goods goes against the belief that supranational bureaucrats are far away from places where problems are tangible and affect peoples’ daily life. Supranational bureaucrats’ increasing interference paves the way for unreasonable solutions, since some decisions regarding the provision of public goods might involve a myopic assessment of local populations’ needs.
Politically, increased centralisation in the EU clashes against what is going on worldwide. Considering that national governments lost crucial macroeconomic tolls from the beginning of EMU, a further shrinking of economic policy powers seems infeasible. Furthermore, one cannot ignore an important political aspect: some doubts arise about the legitimacy of the supranational decision-making process, at least when viewed from conventional, state-centric parameters, (Caporaso 1996, and Eriksen and
1
Fossum 2000). Hence, national governments have a powerful incentive to keep at home the large bulk of decisions concerning the provision of public goods. On the one hand, national politicians avoid losing another important ingredient of economic governance. On the other hand, they see themselves as the primary source of loyalty vis-à-vis citizens (Buiter 1999, and Stone Sweet, Fligstein, and Sandholtz 2001). These economic and political motivations suggest that reinforced centralisation in the EU is infeasible.
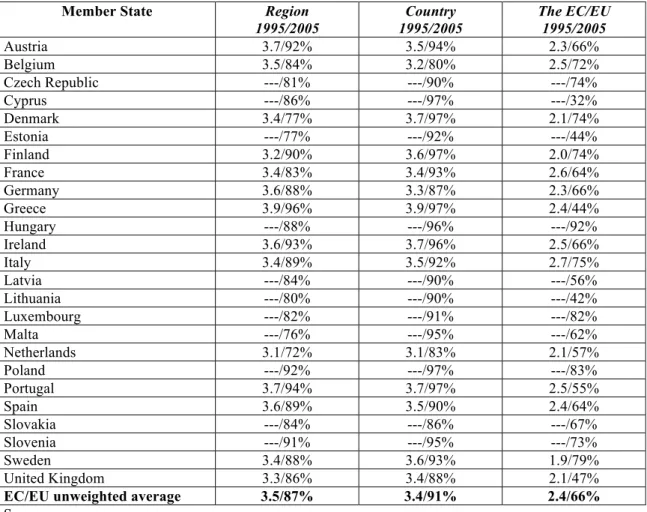
Thirdly, a related argument comes to the surface: the lack of solidarity among member states of the EU prevents the growth of supranational budget’s resources. The peoples of Europe are perceived to be largely divorced from European integration (Bellamy and Castiglione, 2000). One method of assessing this aspect is to examine peoples’ perceptions of European integration. Table 7 provides a rough measure, giving information of where citizens look at when they seek solutions for their problems.
Table 7: Feeling attached to a place (1995/2005)
Member State Region 1995/2005
Country 1995/2005
The EC/EU 1995/2005
Austria 3.7/92% 3.5/94% 2.3/66%
Belgium 3.5/84% 3.2/80% 2.5/72%
Czech Republic ---/81% ---/90% ---/74%
Cyprus ---/86% ---/97% ---/32%
Denmark 3.4/77% 3.7/97% 2.1/74%
Estonia ---/77% ---/92% ---/44%
Finland 3.2/90% 3.6/97% 2.0/74%
France 3.4/83% 3.4/93% 2.6/64%
Germany 3.6/88% 3.3/87% 2.3/66%
Greece 3.9/96% 3.9/97% 2.4/44%
Hungary ---/88% ---/96% ---/92%
Ireland 3.6/93% 3.7/96% 2.5/66%
Italy 3.4/89% 3.5/92% 2.7/75%
Latvia ---/84% ---/90% ---/56%
Lithuania ---/80% ---/90% ---/42%
Luxembourg ---/82% ---/91% ---/82%
Malta ---/76% ---/95% ---/62%
Netherlands 3.1/72% 3.1/83% 2.1/57%
Poland ---/92% ---/97% ---/83%
Portugal 3.7/94% 3.7/97% 2.5/55%
Spain 3.6/89% 3.5/90% 2.4/64%
Slovakia ---/84% ---/86% ---/67%
Slovenia ---/91% ---/95% ---/73%
Sweden 3.4/88% 3.6/93% 1.9/79%
United Kingdom 3.3/86% 3.4/88% 2.1/47%
EC/EU unweighted average 3.5/87% 3.4/91% 2.4/66%
Sources:
1) Data for 1995 adapted from Hooghe and Marks (2001: 55), Table 3.1. (Methodological note: Question: People may feel different degrees of attachment to their region, to their country, or to the EC. Please tell how attached do you feel to…? The data were adjusted from a larger survey where different answers were envisaged for measuring how attached people felt to these three hypothesis: ‘very attached’ (code 4), ‘fairly attached (code 3)’, ‘not very attached’ (code 2), and ‘not at all attached’ (code 1)’).
The examination of 1995 data shows that people were more concerned with their own problems, turning the attention to the regional or the national level of decision-making. The attachment to domestic layers is significantly higher in all member states. For both layers the answers rank near the higher code of attachment (“very attached”). This data contrasts with the way respondents feel attached to the EU: the average is 2.4, somewhere in between the “not very attached” and the “fairly attached” categories. There are interesting variations across member states. In some member states the degree of attachment towards the EU is closer to code 2 (Denmark, Finland, the Netherlands, Sweden and the United Kingdom), meaning that they are not particularly committed to European integration. Conversely, only one member state (Italy) shows a result close to code 3, showing a commitment to the EU that almost ranks the level of “fairly attachment”. The interesting finding here is that the lower level of enthusiasm and involvement with European integration is located at the north of the EU territory.
Data for 2005 do not follow the same methodology. They score a country-by-country average attachment (per cent) to the several layers involved in EU politics. The 2005 poll reproduces the long-lasting tendency of people fundamentally attached to their member state, or even region, and not so much to the EU. The average of member states’ attachment towards the EU (66%) is much lower than the one that shows peoples’ commitment towards their home countries (91%). Interestingly, heterogeneity emerges following a cross-country data examination. The degree of attachment to the EU varies from 32% (Cyprus) to 92% (Hungary). Thus, dispersion increased by comparison with the 1995 poll. Only five member states present a degree of attachment to the EU higher than 75%. Maybe it is bewildering that some of the newest member states rank in the bottom five of the scale (Cyprus, Lithuania, and Estonia).
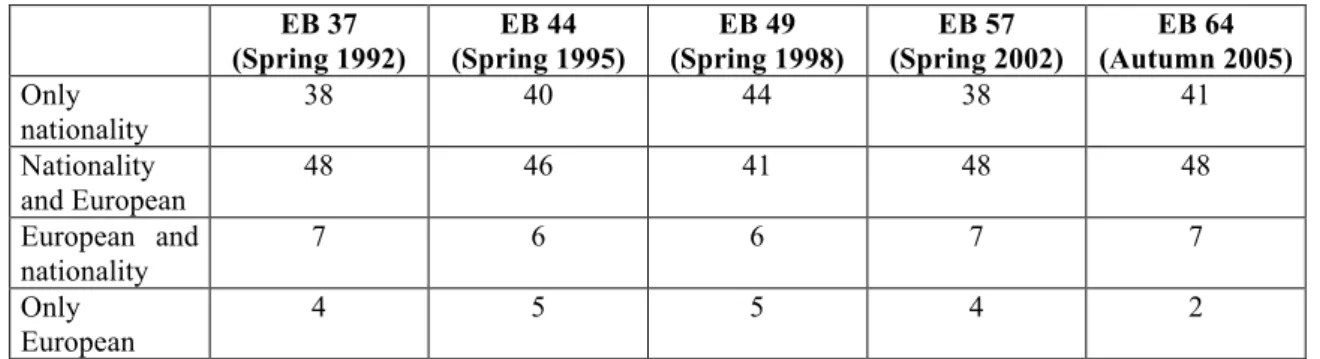
Table 8: European versus national identity 1992 to 2005, EC12/EU15/EU25
EB 37 (Spring 1992)
EB 44 (Spring 1995)
EB 49 (Spring 1998)
EB 57 (Spring 2002)
EB 64 (Autumn 2005)
Only nationality
38 40 44 38 41
Nationality and European
48 46 41 48 48
European and nationality
7 6 6 7 7
Only European
4 5 5 4 2
Sources:
1) Data from Eurobarometer 37, 44, and 49 in McKay (1999: 167). Data for 2002 in European Commission (2002), Table 4.5.
2) Data for 2005 in European Commission (2005b: 46).
There is a sharp difference between two broad categories of behaviour: on the one hand, persons who find themselves only national or recognise their nationality comes before European identity; on the other hand, those who put “Europeaness” above nationality, or even the more radical ones who consider themselves only Europeans. Polls show a stable pattern over time when both categories are compared. Throughout the years, the “pro-European identity” peaked 11 points at best. Instead of finding out a growing perception of “pro-European identity”, recent data shows the opposite: it decreased from 11 to 9 points in 2005, which breaks the stable pattern observed throughout the time series. Conversely, “national identity” ranked on unprecedented levels (89 points). From this perspective, it stands clear how national identity comes after European identity (for a large distance).
REFERENCES
Alesina, Alberto, Roberto Perotti, and Enrico Spolaore (1995), Together or Separately? Issues on the Costs and Benefits of Political and Fiscal Unions, European Economic Review, 39: 3-4, pp. 751-758.
Ardy, Brian and Ali M. El-Agraa (2007), The General Budget, in El-Agraa, Ali M. (Ed.), The European Union: Economics and Policies, 8ed., Cambridge: Cambridge University Press, pp. 353-371.
Armstrong, Harvey (2007), Regional Policy, in El-Agraa, Ali M. (Ed.), The European Union: Economics and Policies, 8ed., Cambridge: Cambridge University Press, pp. 421-439.
Australian Bureau of Statistics (2008), Government Finance Statistics, Australia, 2006-7, Canberra.
Bailey, Stephen J. (1999), Local Government Economics – Principles and Practice, Basingstoke: Macmillan.
Bayoumi, Tamim and Paul R. Masson (1996), What Can the Fiscal Systems in the United States and Canada Tell Us about EMU?, in Welfens, Paul J. (Ed.), European Monetary Integration – EMS Developments and International Post-Maastricht Perspectives, 3ed., Berlin: Springer.
Bellamy, Richard and Dario Castiglione (2000), The uses of democracy – Reflections on the European democratic deficit, in Eriksen, Erik Oddvar and John Erik Fossum (Eds.), Democracy in the European Union: Integration Through Deliberation?, London: Routledge, pp. 65-84.
Benz, Arthur (1999), From Unitary to Asymmetric Federalism in Germany: Taking Stock After 50 Years, Publius: The Journal of Federalism, 29: 4, pp. 55-78. Bolleyer, Nicole (2006), Federal Dynamics in Canada, the United States, and
Switzerland: How Substates’ Internal Organization Affects Intergovernmental Relations, Publius: The Journal of Federalism, 36: 4, pp. 471-502.
Börzel, Tanja (2003), What Can Federalism Teach us About the European Union? The German Experience, paper given at the Royal Institute of International Affairs conference ‘Governing Together in the New Europe’, 12 and 13 April, 2003, Cambridge.
Buiter, Willem H. (1999), Alice in Euroland, Journal of Common Market Studies, 37: 2, pp. 181-209.
Burgess, Michael (2000), Federalism and European Union – The Building of Europe, 1950-2000, London: Routledge.
Caporaso, James A. (1996), The European Union and Forms of State: Westphalian, Regulatory or Post-Modern?, Journal of Common Market Studies, 34: 1, pp. 29-52.
Dafflon, Bernard (1999), Fiscal Federalism in Switzerland: a Survey of Constitutional Issues, Budget Responsibility and Equilisation, in Fossati, Amedeo and Giorgio Panella (Eds.), Fiscal Federalism in the European Union, London: Routledge, pp. 255-286.
Dunn, John (2000), The Cunning of Unreason – Making Sense of Politics, London: Harper Collins.
Egeberg, Morten (2001), How federal? The Organizational Dimension of Integration in the EU (and elsewhere), Journal of European Public Policy, 8: 5, pp. 728-46. Eichengreen, Barry (1997), European Monetary Unification: Theory, Practice, and
Analysis, Cambridge, Massachusetts: The MIT Press.
El-Agraa, Ali M. (2007), The basic statistics, in El-Agraa, Ali M. (Ed.), The European Union: Economics and Policies, 8ed., Cambridge: Cambridge University Press, pp. 84-98.
Elazar, Daniel (2001), The United States and the European Union: Models for Their Epochs, in Nicolaidis, Kalypso and Robert Howse (Eds.), The Federal Vision – Legitimacy and Levels of Governance in the United States and the European Union, Oxford: Oxford University Press, pp. 31-53.
Eriksen, Erik O. Erik and John E. Fossum (2000), Post-national Integration, in Eriksen, Erik Oddvar and John Erik Fossum (Eds.), Democracy in the European Union – Integration Through Deliberation?, London: Routledge.
European Commission (2002), Eurobarometer 57 (Spring 2002), Luxembourg: Office for Official Publications of the European Communities.
--- (2005a), Eurobarometer 63 (Spring 2005), Luxembourg: Office for Official Publications of the European Communities.
--- (2005b), Eurobarometer 64 (Autumn 2005), Luxembourg: Office for Official Publications of the European Communities.
--- (2008a), Public Finances in EMU – 2008, European Economy X-2008, Brussels: Directorate-General for Economic and Financial Affairs.
--- (2008b), AMECO Database – Annual Macro-economic Database, Luxembourg: Office for Official Publications of the European Communities. Eurostat (2008a), General Government Revenue and Expenditure, in Eurostat, Eurostat
Metadata in SDDS Format, Brussels.
--- (2008b), Annual National Accounts: Main Aggregates, in Eurostat, Eurostat Metadata in SDDS Format, Brussels.
Galloway, David (1999), Agenda 2000 – Packaging the Deal, Journal of Common Market Studies, 37: Annual Review, pp. 9-35.
Gunlicks, Arthur (2003), The Länder and German Federalism, Manchester: Manchester University Press.
Filippov, Mikhail, Peter C. Ordeshook and Olga Shvetsova (2004), Designing Federalism – A Theory of Self-Sustainable Federal Institutions, Cambridge: Cambridge University Press.
Galligan, Brian and John S. F. Wright (2002), Australian Federalism: A Prospective Assessment, Publius: The Journal of Federalism, 32: 2, pp. 147-166.
Hitiris, Theo (1994), European Union Economics, 3ed., Hemel Hempstead: Harvester Wheatsheaf.
Hooghe, Liesbeth and Gary Marks (2001), Multi-Level Governance and European Integration, Lanham: Rowman and Littlefield.
Inman, Robert P. (2007), Federalism’s Values and the Value of Federalism, CESifo Economic Studies, 53: 4, pp. 522–560.
--- and Daniel L. Rubinfeld (1999), Designing Tax Policy in Federalist Economies: An Overview, Journal of Public Economics, 60: 3, pp. 307-334. Jachtenfuchs, Markus (2002), Deepening and Widening Integration Theory, Journal of
European Public Policy, 9: 4, pp. 650-657.
Kletzer, Kenneth (1999), Macroeconomic Stabilization with a Common Currency: Does European Monetary Unification Create a Need for Fiscal Insurance or Federalism?, in Eichengreen, Barry and Jeffry Frieden (Eds.), Forging and Integrated Europe, Ann Arbor: The University of Michigan Press.
Koester, Ulrich and Ali M. El-Agraa (2007), (2007) The Common Agricultural Policy, in El-Agraa, Ali M. (Ed.), The European Union: Economics and Policies, 8ed., Cambridge: Cambridge University Press, pp. 373-409.
Koslowski, Rey (1999), A Constructivist Approach to Understanding the European Union as a Federal Polity”, Journal of European Public Policy, 6: 4, pp. 561-578. Laffan, Brigid (1997), The Finances of the European Union, Basingstoke: Macmillan. Lenaerts, Koen (1990), Constitutionalism and the Many Faces of Federalism, The
American Journal of Comparative Law, 38: 2, pp. 205-263.
Martin, Reiner (1999), Regional Policy, in McDonald, Frank and Stephen Dearden (Eds.), European Economic Integration, 3ed., Harlow: Longman, pp. 209-237. McKay, David (1999), Federalism and European Union – A Political Economy
Perspective, Oxford: Oxford University Press.
--- (2001), Designing Europe – Comparative Lessons from the Federal Experience, Oxford: Oxford University Press.
Menon, Anand and Stephen Weatherill (2002), Legitimacy, Accountability, and Delegation in the European Union, in Arnull, Anthony and Daniel Wincott (Eds.), Accountability and Legitimacy in the European Union, Oxford: Oxford University Press, pp. 113-131.
Moravcsik, Andrew (2001), Federalism in the European Union: Rhetoric and Reality, in Nicolaidis, Kalypso and Robert Howse (Eds.), The Federal Vision – Legitimacy and Levels of Governance in the United States and the European Union, Oxford: Oxford University Press, pp. 161-187.
Nathan, Richard P. (1992), Defining Modern Federalism, in Scheiber, Harry N. (Ed.), North American and Comparative Federalism – Essays for the 1990s, Berkeley: University of California (Institute of Governmental Studies Press).
Neyer, Jürgen (2006), The Deliberative Turn in Integration Theory, Journal of European Public Policy, 13: 5, pp. 779-791.
Organization for Economic Cooperation and Development (OECD) (2007), Revenue Statistics 1965-2006: Special Feature: the Balance Between Direct and Indirect Taxes, Paris: OECD.
Pinder, John (1998), From Closed Doors to European Democracy – Beyond the Intergovernmental Conferences, in Westlake, Martin (Ed.), The European Union Beyond Amsterdam – New Concepts of European Integration. London: Routledge, pp. 47-60
Riker, William H. (1964), Federalism – Origins, Operation, Significance, Boston: Little, Brown & Co...
Rodden, Jonathan A. (2006), Hamilton’s Paradox – The Promise and Peril of Fiscal Federalism, Cambridge: Cambridge University Press.
Rosen, Harvey S. (1995), Public Finance, 4ed., Chicago: Irwin.
Rydon, Joan (1993), The Australian Tradition of Federalism and Federation, in Burgess, Michael and Alain-G. Gagnon (Eds.), Comparative Federalism and Federation – Competing Traditions and Future Directions, Toronto: University of Toronto Press, pp. 227-243.
Seidel, Bernhard and Dieter Vesper (1999), Fiscal Federalism – an International Comparison, Deutsches Institut für Wirtschaftsforschung Discussion Paper Nº. 183.
Seitz, Helmut (2000), Fiscal Policy, Deficits and Politics of Subnational Governments: the Case of the German Länder, Public Choice, 3: 4, pp. 183-218.
Simeon, Richard and Ian Robinson (2004), The Dynamics of Canadian Federalism, in Bickerton, James and Alain-G. Gagnon (Eds.), Canadian Politics, 4ed., Peterborough, Broadview Press, pp. 101-126.
Spahn, Paul B. (1993), The Community Budget for a Economic and Monetary Union, Basingstoke: Macmillan.
--- and Anwar Shah (1997), Intergovernmental Fiscal Relations in Australia, in Roy, Jayanta (Ed.), Macroeconomic Management and Fiscal Decentralization, Washington: The World Bank, pp. 49-72.
Statistics Canada (2008), Public Sector Statistics – Financial Management System 2007/2008, Ottawa, Ministry of Industry.
Stevenson, Gareth (2004), Unfulfilled Union: Canadian Federalism and National Unity, 4ed., Montreal: McGill-Queen’s University Press.
Stiglitz, Joseph E. (1988), Economics of the Public Sector, 2ed., New York: W. W. Norton.
(Eds.), The Institutionalization of Europe, Oxford: Oxford University Press, pp. 1-28.
Stotsky, Janet G. and Emil M. Sunley (1997), United States, in Ter-Minassian, Teresa (Ed.), Fiscal Federalism in Theory and Practice, New York: International Monetary Fund, pp. 359-383.
Thorlakson, Lori (2003), Comparing Federal Institutions: Power and Representation in Six Federations, West European Politics, 26: 2, pp. 1-22.
Underhill, Geoffrey R. D. (2002), Global Integration, EMU, and Monetary Governance in the European Union: The Political Economy of the ‘Stability Culture’, in Dyson, Kenneth (Ed.), European States and the Euro: Europeanization, Variation, and Convergence, Oxford: Oxford University Press, pp. 31-52.
United States Census Bureau (2008), Statistical Abstract of the United States, Washington DC: US Government Printing Office.
Von Hagen, Jürgen (1993), Monetary Union and Fiscal Union: a Perspective From Fiscal Federalism”, in Masson, Paul R. and Mark P. Taylor (Eds.), Policy Issues in the Operation of Currency Unions, Cambridge: Cambridge University Press, pp. 264-295.
Vrousalis, Nicholas (2006), The Strains of Commitment: A Federal System Needs a Common Fiscal Policy, Journal of European Integration, 28: 2, pp. 181-192. Worthington, Andrew and Brian Dollery (2002), The Debate on American Federalism:
Local Government Finance Interrelationships with State and Commonwealth Governments, Australian Journal of Public Administration, 59: 4, pp. 25-35. Zimmerman, Joseph F. (1992), Contemporary American Federalism – the Growth of
National Power, Leicester: Leicester University Press.
Zimmermann, Horst (1999), Experiences with German Fiscal Federalism: How To Preserve the Decentral Content?, in Fossati, Amedeo and Giorgio Panella (Eds.), Fiscal Federalism in the European Union, London: Routledge, pp. 162-175.
Internet references
http://eur-lex.europa.eu/budget/data/D2007_VOL1/EN/nmc-grseq42960935830-3/index.html
http://www.efv.admin.ch/e/dokumentation/downloads/dokumentation/zahlen_fakten/sta tistik/SDDS_jahr-rechnung-schulden_en.pdf