CREATING VALUE IN HOUSING PROJECTS: THE USE OF POST-OCCUPANCY ANALYSIS TO DEVELOP NEW PROJECTS
Thaís da C. L. Alves1, George S. Costa2, José de P. Barros Neto3 1
Structural Engineering and Construction Department, Federal University of Ceará, Campus do Pici, s/n, Bloco 710, Pici, 60455-760, Fortaleza, CE, Brazil, [email protected]
2
Structural Engineering and Construction Department, Federal University of Ceará, [email protected]
3
Structural Engineering and Construction Department, Federal University of Ceará, [email protected]
ABSTRACT
Value generation is a goal of the Lean Production/Construction philosophy. However, defining value is difficult as value may vary according to user requirements and the capacity to afford desirable products and services. This paper presents two post-occupancy studies carried out in Brazilian housing projects and discusses how the results were collected, analyzed, and how they can be used for developing new projects. The first study presents the method used to collect and analyze data regarding users’ opinions about housing units in low-income housing projects funded by the Brazilian Government. The second study presents the method used to capture the opinion of users of high-rise housing projects for medium- and high-income families. Results were categorized to reflect client satisfaction vs. how much they value specific items (importance) and provided designers and developers with clues about what clients actually value and how close/far the developers are from meeting or exceeding client expectations.
INTRODUCTION
One of the main goals of Lean Production is value generation for the end-user. However, capturing customer requirements and translating these into design parameters and ultimately into perceived value is not easy. According to Womack and Jones (1998, p.5): “Value can only be defined by the end-user. And it is only meaningful when expressed in terms of a specific product (a good or a service, and often both at once) which meets the customer’s needs at a specific price at a specific time.” Juran (1990) suggests that quality of a good or service is related to the development of products that meet customer desires. Juran highlights that customers often reveal their needs using their own language and their own points of view, which
may not be captured and explicitly translated into design parameters even by specialists. Different methods have been used to capture client requirements in different product development areas. The post-occupancy analysis (POA) is one of the methods that has been used to capture customer satisfaction regarding housing units.
It is worth noting that construction products have unique characteristics: the product is large, bulky, expensive, fixed and has a long lead time from design to completion and delivery to the end-user (Koskela, 1992). Due to these characteristics, it is hard to find alternative clients for the products offered by construction companies given that the product cannot be transported and sold in a location different from the one it was planned for.
Due to the aforementioned reasons, it is critical to the construction industry to study methods that both organize the capturing and processing of information related to client requirements, and help translate these requirements to design and construction teams.
PRODUCT DEVELOPMENT AND POST OCCUPANCY ANALYSIS
According to Syal et al. (2005, p.3), who defined a housing research agenda for NSF, “addressing deficiencies in the existing housing stock” comprises a topic of investigation for improving quality and productivity in the housing industry. A structured method to capture and translate customer needs into quality buildings is necessary in order to understand client values and address these deficiencies.
Ulrich and Eppinger (2000) point out that the identification of customer needs is the first stage of the concept development phase for a new product. The POA is a method that uses interviews, as well as direct observation, to capture client’s needs and understand how satisfied the client is while using the product.
The literature presents different examples of how client’s needs are captured and evaluated. Forsythe (2007) presents a conceptual framework to study client satisfaction in housing construction. Forsythe highlights the importance of understanding how client expectations build over the purchasing process and how they contribute to client satisfaction once the project is delivered. His idea is to understand what makes clients give different ratings for the project, the construction company, and the developer throughout the project’s life cycle, and ultimately to understand how expectations are confirmed or disconfirmed during the long lead time from purchasing a housing unit to receiving it.
Along these lines, Tobica and Stroh (2001) carried out a study to understand customer satisfaction in terms of design, housing unit quality, and service (all factors which are under developers’ control). They used a questionnaire which allowed customers to give performance and importance ratings for 51 items in the three categories. They found out that the item service is a major determinant of customer satisfaction, which reveals that end-user satisfaction is not related only to the housing unit itself.
Reis (1997) studied how user participation in the design of low-income projects affects user satisfaction levels. He stresses the importance of collecting data about which factors affect client satisfaction and the need to properly incorporate these in the new product development process for low-income housing projects.
Similarly, Leite et al. (2005) stress the need to properly address client requirements for low-income projects. They suggest that, as public agencies take care of registering clients who need a house, officials could also capture customer requirements in terms of what customers value. However, often this does not happen: by the time a housing unit is assigned to the client, the design process is already over. Also, customer requirements could be shared between financing agents, city councils, and construction companies. In order to best organize these requirements, Lima et al. (2008) suggest Quality Function Deployment (QFD) as a tool to help developers and designers make sure requirements are not lost throughout the process.
According to the literature, customer satisfaction can be explained by a combination of items. Items frequently cited as drivers of user satisfaction levels include: issues related to the quality of the unit; how adequate the unit is to the customer’s needs; and the service provided by construction companies. However, capturing customer requirements and translating them into value-added features requires an organized method covering data collection through analysis and presentation of results. This paper expands on previous research carried out by Leite et al. (2005) and Lima et al. (2008) and suggests that construction designers should know the factors that contribute to client satisfaction as well as what items clients value the most in housing projects. According to the research presented here, the item clients value the most is project location, regardless of their income. Given that in many parts of the world good and affordable pieces of real states are getting scarcer, developers have to make sure they can differentiate their projects according to what clients value and are willing to pay.
RESEARCH METHOD
The objective of this paper is to present how post-occupancy analysis can be used to provide value-adding feedback to developers and design teams during the development of new projects. The authors aim to contribute to the development of products that have high value-adding features. The research method described in this paper was used for two major research projects and has been evolving over the past 5 years. The method comprises the phases of questionnaire development, research plan, data collection, data analysis, and definition of critical items.
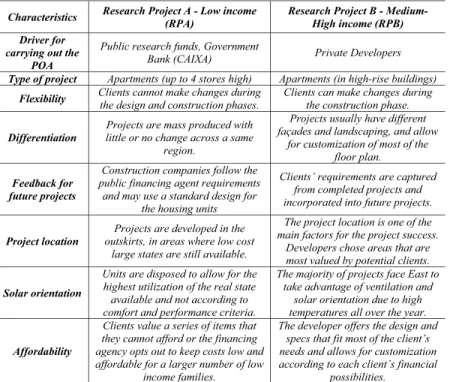
The two major research projects that used this method differ only regarding the housing units analyzed. The Research Project A (RPA) analyzed client requirements for low-income housing projects and was developed simultaneously in five cities in different regions of Brazil (i.e., Fortaleza/CE, Feira de Santana/BA, Londrina/PR, Porto Alegre/RS, Pelotas/RS). A total of 727 clients were interviewed in these five cities. The Research Project B (RPB) comprised four POA carried out in the city of Fortaleza/CE. The main characteristic of this second project is that the POA involves medium- to high-income housing units and was motivated by developers who were interested in knowing more about their clients’ needs and satisfaction levels regarding the projects they offer. Table 1 provides a characterization of both projects analyzed.
Characteristics Research Project A - Low income (RPA)
Research Project B - Medium-High income (RPB) Driver for
carrying out the POA
Public research funds, Government
Bank (CAIXA) Private Developers
Type of project Apartments (up to 4 stores high) Apartments (in high-rise buildings)
Flexibility Clients cannot make changes during the design and construction phases.
Clients can make changes during the construction phase.
Differentiation
Projects are mass produced with little or no change across a same
region.
Projects usually have different façades and landscaping, and allow
for customization of most of the floor plan.
Feedback for future projects
Construction companies follow the public financing agent requirements
and may use a standard design for the housing units
Clients’ requirements are captured from completed projects and incorporated into future projects.
Project location
Projects are developed in the outskirts, in areas where low cost
large states are still available.
The project location is one of the main factors for the project success.
Developers chose areas that are most valued by potential clients.
Solar orientation
Units are disposed to allow for the highest utilization of the real state available and not according to comfort and performance criteria.
The majority of projects face East to take advantage of ventilation and
solar orientation due to high temperatures all over the year.
Affordability
Clients value a series of items that they cannot afford or the financing agency opts out to keep costs low and affordable for a larger number of low
income families.
The developer offers the design and specs that fit most of the client’s needs and allows for customization according to each client’s financial
possibilities.
Research Project A – Low-income housing units (RPA)
In RPA, the first phase used a questionnaire developed by researchers at NORIE/UFRGS, a research group located at the southern part of Brazil (Miron, 2002; Leite, 2005). The questionnaire comprised 63 items regarding: information about the housing unit; characteristics about the client interviewed and the family; and the five items the client liked and disliked the most. The other questions were related to client satisfaction regarding characteristics of the housing complex and the housing unit in terms of electrical and hydraulic systems; space distribution; comfort in terms of ventilation and natural light; quality of finishings, windows and doors; and safety. Finally, the last five questions asked clients about overall satisfaction with the housing unit; any changes they had made to the unit or intended to make; and how the unit compared to their previous unit, as well as to other similar units built by other construction companies.
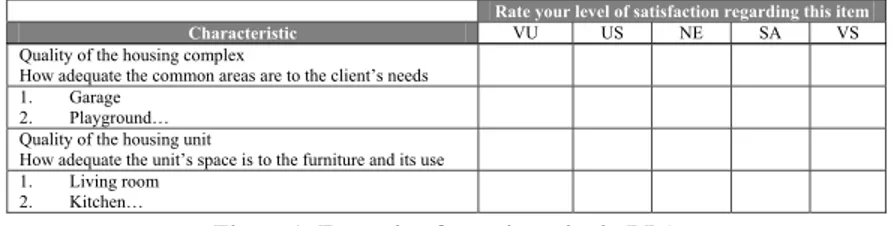
In the RPA questionnaire (figure 1) clients could indicate their level of satisfaction for 44 items (questions) related to the housing unit and the housing complex based on a 5-point scale: very unsatisfied (VU), unsatisfied (US), neutral (NE), satisfied (SA), and very satisfied (VS).
Table 1: Characteristics of the low and medium-high income projects analyzed
Quality of the housing complex
How adequate the common areas are to the client’s needs
1. Garage
2. Playground…
Quality of the housing unit
How adequate the unit’s space is to the furniture and its use
1. Living room
2. Kitchen…
Figure 1: Example of questionnaire in RPA
The second and third phases of RPA were carried out similarly to RPB. In the third phase, the data was collected after at least one client living in each housing unit was contacted in advance, so that a group of researchers could visit the housing complex and interview the clients. “In person” interviews were carried out mainly by a group of undergraduate students trained to use the questionnaire and deal with situations that could arise during the interview process. The researchers took pictures and recorded observations (drawings and comments) to illustrate client comments about the housing units/complex.
The fourth phase (data analysis) of RPA was carried out by grouping client answers in histograms that categorized answers according to the 5-point scale from very unsatisfied to very satisfied with the housing unit/complex characteristics. RPA also utilized a cross-data analysis, with researchers using the software SPSS® to evaluate correlations between different groups of answers. An example of cross-data analysis was to investigate how the level of satisfaction with the current housing unit correlated with how much the client liked their previous unit. Finally, the fifth phase comprised the analysis of the 5 critical items that the clients liked and disliked the most.
Research Project B – Medium- to high-income housing units (RPB)
The research method used in RPB evolved from the one used in RPA. The first major change regarding the methods used in RPA and RPB was the structure of the questionnaire used for POA. In RPB, the questionnaire was altered to capture the level of satisfaction as well as the level of importance given by the clients to different characteristics of the housing unit and the housing complex in which the unit was located. The questionnaire was also shortened.
The next major change in the questionnaire was the use of a Likert scale varying from 0 to 10 in which the clients could express their level of satisfaction with a specific item as well as express how important/unimportant that item was for them (Figure 2). This allowed the researchers to calculate a delta between the level of importance (what the client values) and the level of satisfaction (how the client feels about the item) indicated by the client. The ideal situation would be for the importance and satisfaction levels to be the same, which would reflect that a client’s satisfaction level is compatible with the importance level that client gives a certain item.
Rate your level of satisfaction regarding this item
Very unsatisfied 0 1 2 3 4 5 6 7 8 9 10 Very satisfied
Rate the level of importance this item has for you
Not important 0 1 2 3 4 5 6 7 8 9 10 Very important
Figure 2: Likert scale used in the questionnaire
Rate your level of satisfaction regarding this item
Characteristic VU US NE SA VS
The rationale behind the method used in RPB was based on the work of Noriaki Kano, who suggested that there are different kinds of attributes to be considered in a product or service (Kano et al. 1984 apud Matzler and Hinterhuber, 1998). Kano differentiates between attributes that must be present in a good or service and those that differentiate these products and services from others currently offered in the market. According to Kano’s model there are three types of attributes:
• Threshold/Basic attributes (“must-be” requirements): these are essential for
the good/service to sell as the clients take them for granted. These do not increase client satisfaction with the product but cause extreme dissatisfaction if they are not found in the product/service.
• One-dimensional attributes (performance/linear): client satisfaction level
increases with the improvement of these attributes, and decreases when these attributes are not properly offered. Clients relate the differentiation on goods and services’ prices to how well these attributes function.
• Attractive attributes (exciters/delighters): these are related to a great level of
satisfaction for those clients who are willing to pay extra money to have these attributes present in a product/service. These attributes are not explicitly required by clients. Differently from the one dimensional attributes, clients are not dissatisfied if the attribute is not present.
The importance-satisfaction matrix presented in Figure 3 shows an example of multi-dimensional scaling (MDS), which is a technique that graphically represents interviewees’ perceptions and preferences regarding attributes present in a product or service (Slack, 1997, Malhotra, 2001). The MDS has been used as a Marketing research tool to help in the analysis of market segmentation, new product development, and price analysis. The data collected with a questionnaire using a Likert scale, as the one shown in Figure 2, provides the researcher with two coordinates (importance, satisfaction), which are marked in a importance-satisfaction matrix (figure 3).
Satisfaction > Importance
Importance
S
a
tis
fa
ctio
n
Importance > Satisfaction
Figure 3: Importance-Satisfaction matrix
Analysis of coordinates in different areas of the importance-satisfaction matrix allows developers and design teams to focus on different issues:
• Items the clients value the most: e.g., items with high importance ratings. • Requirements the company is failing to fulfill: e.g., items with high
importance and low satisfaction ratings.
• Requirements overly fulfilled that don’t increase client satisfaction: e.g., high
satisfaction and low importance level.
• Requirements that may increase/decrease client satisfaction in a linear
fashion: e.g., items on the central diagonal indicate that client satisfaction improves as the company improves product/service features and decreases as the company fails to fulfill these requirements.
• Items within segments defined by lines parallel to the central diagonal: e.g.,
items under the central diagonal (importance < satisfaction ratings) may need more urgent action depending on the delta between the satisfaction and importance ratings.
RESULTS AND ANALYSIS
This section presents the results and analysis carried out for both projects, with a discussion regarding how the methods were used to provide stakeholders with information about what clients value most in the housing units analyzed.
Results and analysis for RPA
The results presented for RPA were part of the Requali network project carried out by five universities in five different cities in Brazil, i.e., UFRGS, UFPel, UEL, UEFS and UFC (leading institution). The main goal of Requali was to provide stakeholders with information for the development of new housing projects for low-income families. The Requali network carried out 727 interviews with clients of government funded projects in five cities. In the city of Fortaleza, the same city where RPB was developed, 125 interviews were carried out in three different projects (out of a total of 224 units). The projects evaluated were funded by the Brazilian Government under the House Leasing Program (PAR). The PAR units had to be built under tight budget and schedule constraints set by the funding agency, and there was a cap for the maximum price paid for each unit delivered. Once PAR projects were approved, the construction companies were assured a government owned bank (CAIXA) would acquire all of them and take care of the leasing process.
The results of RPA showed that clients were very satisfied with the housing units, with the highest levels of satisfaction found in the Southern Region Brazil, i.e., in Londrina, Porto Alegre, and Pelotas, where 85% of the clients were satisfied or very satisfied with the units.
The five items customers liked the most were: location (32.3%), safety (23.3%), design of the housing unit (19.4%), the PAR Program (13.8%), and living in a housing complex/condo (11.1%). The five items clients disliked the most were: the project management company (29.3%); the condo fees (19.5%); location (17.9%); design of the condo common areas (17.7%); and safety (16.5%). It is worth noting that project location and safety were spontaneously cited as items that clients both liked and disliked the most, suggesting that both items deserve special attention as they strongly contribute to client satisfaction.
The study also shows that clients in different regions of the country value different items of the projects. This can be explained by cultural differences across the country. In Southern cities, with lower temperatures during the winter, clients consider the solar orientation of the units facing the sun as a positive factor. In the
Northeast region this was viewed as a negative factor, as they are closer to the Equator and face higher temperatures.
Also, as the clients cannot alter the unit during the design and construction phases of PAR projects, they make changes after the unit is delivered. In the city of Fortaleza, the main change observed was the addition of bars in the unit’s windows and doors due to safety concerns (pointed out as a critical item). Finally, in Fortaleza, the cross-analysis revealed that the most highly satisfied group was ‘adults without kids’ followed by ‘couples without kids.’ This suggests the units are not adequate for families, as the level of satisfaction of groups with kids was low when compared to other groups.
Results and analysis for RPB
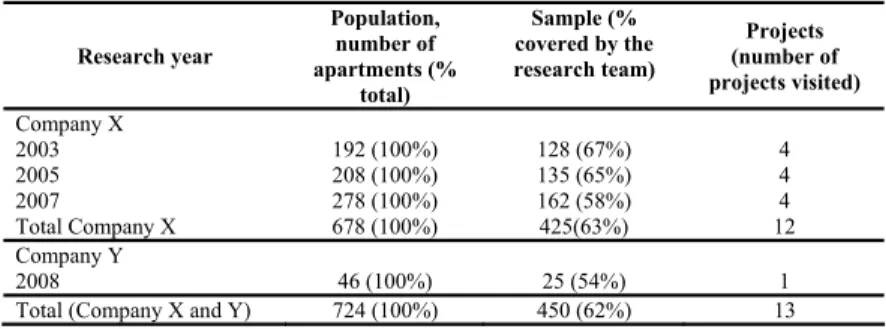
The RPB comprise four different POA solicited by two construction companies (Table 2). The projects investigated have similar characteristics, i.e., high-rise buildings for medium- to high-income families. The POA was carried out by the GERCON – construction research group at the Federal University of Ceará (UFC). For RPB, 450 clients from 13 projects were interviewed in 4 years. Due to space constraints, only the results for Company X in 2007 are presented to illustrate how the method used in RPB was used and validated.
The main reason cited by clients to buy a unit in the projects offered by Company X was location (37%), followed by size of apartment/space (22%) and the leisure area/common area (12%). All three items are very critical items as developers have strived to meet these criteria while orienting the units to the East. Avoiding afternoon sun is important due to Fortaleza’s high temperatures and proximity to the Equator (~ Latitude: -03° 43' 02''; ~ Longitude: 38° 32' 35'').
Table 2: Summary projects and samples for RPB
Research year
Population, number of apartments (%
total)
Sample (% covered by the research team)
Projects (number of projects visited)
Company X
2003 192 (100%) 128 (67%) 4
2005 208 (100%) 135 (65%) 4
2007 278 (100%) 162 (58%) 4
Total Company X 678 (100%) 425(63%) 12
Company Y
2008 46 (100%) 25 (54%) 1
Total (Company X and Y) 724 (100%) 450 (62%) 13
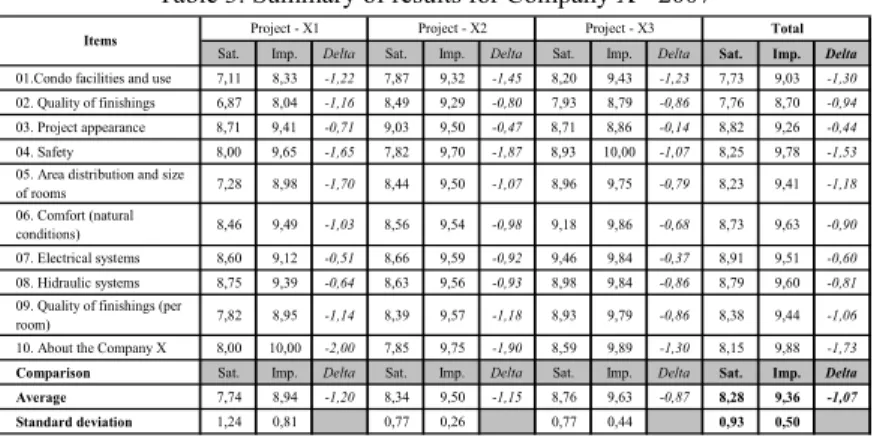
Table 3 shows a summary presented to developers at Company X. Overall, on a Likert scale varying from 0 to 10, clients of Company X are satisfied (8.28) but there is a negative delta (satisfaction - importance ratings) given that on average importance ratings are higher (9.36) than satisfaction ratings. The item ‘project appearance’ presents the lowest absolute delta, which means that client satisfaction and importance ratings for this item are close (0.44), i.e. the company delivered what clients expected. The highest absolute delta can be found in the ratings clients gave to the company overall service (1.73), i.e., clients want the company to deliver a better service.
Table 3: Summary of results for Company X - 2007
Sat. Imp. Delta Sat. Imp. Delta Sat. Imp. Delta Sat. Imp. Delta 01.Condo facilities and use 7,11 8,33 -1,22 7,87 9,32 -1,45 8,20 9,43 -1,23 7,73 9,03 -1,30
02. Quality of finishings 6,87 8,04 -1,16 8,49 9,29 -0,80 7,93 8,79 -0,86 7,76 8,70 -0,94
03. Project appearance 8,71 9,41 -0,71 9,03 9,50 -0,47 8,71 8,86 -0,14 8,82 9,26 -0,44
04. Safety 8,00 9,65 -1,65 7,82 9,70 -1,87 8,93 10,00 -1,07 8,25 9,78 -1,53
05. Area distribution and size
of rooms 7,28 8,98 -1,70 8,44 9,50 -1,07 8,96 9,75 -0,79 8,23 9,41 -1,18 06. Comfort (natural
conditions) 8,46 9,49 -1,03 8,56 9,54 -0,98 9,18 9,86 -0,68 8,73 9,63 -0,90 07. Electrical systems 8,60 9,12 -0,51 8,66 9,59 -0,92 9,46 9,84 -0,37 8,91 9,51 -0,60
08. Hidraulic systems 8,75 9,39 -0,64 8,63 9,56 -0,93 8,98 9,84 -0,86 8,79 9,60 -0,81
09. Quality of finishings (per
room) 7,82 8,95 -1,14 8,39 9,57 -1,18 8,93 9,79 -0,86 8,38 9,44 -1,06 10. About the Company X 8,00 10,00 -2,00 7,85 9,75 -1,90 8,59 9,89 -1,30 8,15 9,88 -1,73 Comparison Sat. Imp. Delta Sat. Imp. Delta Sat. Imp. Delta Sat. Imp. Delta
Average 7,74 8,94 -1,20 8,34 9,50 -1,15 8,76 9,63 -0,87 8,28 9,36 -1,07
Standard deviation 1,24 0,81 0,77 0,26 0,77 0,44 0,93 0,50
Items Project - X1 Project - X2 Project - X3 Total
In previous years (2003, 2005), clients also said the company needed to meet deadlines and honor commitments, and they also complained that the company took too long to solve maintenance problems. Finally, the negative deltas have shown that company X has not exceeded client expectations, as none of the deltas were positive. On average, importance was higher than satisfaction for all items. Another interpretation is that the negative deltas show that company X has room for improvement, and it is not investing money in features clients do not value.
CONCLUSIONS
The paper presented the method used to collect and analyze data in different types of housing projects ranging from low-income, mass-produced projects to medium- to high-income, high-rise apartments with some degree of internal customization. In both studies some similarities were found, i.e., importance of project location, space distribution, and safety, regardless of how much income clients earn. There was evolution in the methodology from the first to the second project, so that the tools and the analysis were better able to portray the items clients value and, at the same time, indicate how satisfied the clients are with these items. When the results were presented to developers and Government agencies, the researchers led a discussion focused on the items that clients value the most and how they can be incorporated in future projects. The way results are presented in RPB allows public agencies and developers to prioritize what actions are more urgent depending on where project characteristics stand in the importance-satisfaction matrix and how low or high their deltas are. It is worth noting that in major cities, good pieces of real states are becoming scarce and less affordable, and clients highly value the location of projects. Therefore, developers will have to be more creative and precise while addressing client’s needs.
REFERENCES
Forsythe, P.J. (2007) A conceptual framework for studying customer satisfaction in residential construction. Construction Mgmt and Econ. February, 25, 171-182 Juran, J. M. (1990) Juran Planejando para a qualidade. (In Portuguese: Juran
planning for quality) São Paulo: Pioneira.
Koskela, L. Application of the New Production Philosophy to Construction. Stanford University, CIFE, 1992, Technical Report # 72, 87 pp.
Leite, F. (2005) Contribuições para o gerenciamento de requisitos do cliente em empreendimentos do Programa de Arrendamento Residencial. (in Portuguese) Master’s thesis. Porto Alegre: NORIE/UFRGS
Leite, F.L.; Miron, L.I.G., and Formoso, C.T. (2005) Opportunities for client requirements management in low-income house building projects in Brazil. Proc. 13th Annual Conf. of the Intl Group for Lean Construction (IGLC 13). Sydney, Australia
Lima, L. P., Formoso, C. T. and Echevest M.E.S. (2008) Client Requirements Processing in Low-Income House-Building Using Visual Displays and the House of Quality, Proc. 16th Annual Conf. of the Intl Group for Lean Construction (IGLC 16), 459 -470, Manchester, UK
Malhotra, N. (2001) Pesquisa de Marketing: uma orientação aplicada (in Portuguese, translation of Marketing Research: an applied orientation), 3rd ed., Porto Alegre: Bookman
Matzler, K. and Hinterhuber, H.H. (1998) How to make product development projects more successful by integrating Kano’s model of customer satisfaction into quality function deployment. Technovation, v. 18, No.1 , 25-38
Miron, L. (2002) Diretrizes para o gerenciamento os requisitos do cliente final no processo de desenvolvimento do produto em empreendimentos habitacionais. (in Portuguese) Master’s thesis. Porto Alegre: NORIE/UFRGS
Reis, A (1997) Participação do usuário no projeto de habitação popular (In Portuguese). Ambiente Construído, Junho, 31-44
Slack, N. et al. Administração da produção (in Portuguese, Operations Management), São Paulo: Atlas, 1997.
Syal, M. et al. (2005) Housing research agenda for NSF-PATH. Journal of Architectural Engineering, ASCE, March, 1-6
Tobica, Z.M. and Stroh, R.C. Customer satisfaction in home building. Journal of Construction Engineering and Management, Vol.127, No. 1, 82-86
Ulrich, K.T. and Eppinger, S.D. (2000) Product design and development. 2nd ed. Boston: Irwin McGRaw-Hill, 358pp
Womack, J.P. and Jones, D.T. A Mentalidade Enxuta nas Empresas. (In Portuguese: translation of Lean Thinking) Rio de Janeiro: Campus, 1998. 427p.