PB 215
Comparative study of methods for the quantification of biofilm on
complete dentures
Estudo comparativo de métodos para quantificação de biofilme
em próteses totais
Helena de Freitas Oliveira Paranhos* Cláudia Helena Lovato da Silva**
ABSTRACT: This study compared the application and reliability of 4 methods for biofilm quantification (comput-erized, paper-weighing, point-counting, and planimetric) in complete dentures, verifying the correlation between them. The internal surfaces of 62 complete dentures were stained (5% erythrosine) and photographed. The slides were projected on paper, and the areas (total and biofilm-covered) were outlined with a pencil. These areas were measured with an equidistant point grid (point-counting method), a digital planimeter (planimetric method), and for the paper weighing method they were cut and weighed with a precision scale. For the computerized method, ImageTool software was used. In order to perform a validation test of the methods, all of them were applied to slide projections of geometric figures with known dimensions. The correlation tests showed high correlation values (r = 0.82 to 0.99) among the methods. The validation test (ANOVA) showed no statistically significant differences among the values obtained from the measurement of figures using all four quantitative methods and the real di-mensions of these geometric figures. Quantitative methods were efficient and reliable for measuring quantity of biofilm in complete dentures, and may be useful in experimental studies on the efficacy of hygiene products. The computerized method was fast and easy to perform.
DESCRIPTORS: Denture, complete; Biofilms.
RESUMO: Este estudo comparou a aplicação e a confiabilidade de quatro métodos de quantificação de biofilme (computadorizado, pesagem de papel, contagem de pontos e planimétrico) em próteses totais, verificando a corre-lação entre eles. As superfícies internas de 62 próteses totais foram coradas (eritrosina a 5%) e fotografadas. Os diapositivos foram projetados em papel, e as áreas (total e com biofilme corado) foram contornadas com grafite. Estas áreas foram medidas com uma grade de pontos eqüidistantes (método de contagem de pontos), um planí-metro digital (método planimétrico) e, para o método de pesagem de papel, foram recortadas e pesadas em balança de precisão. No método computadorizado, foram medidas com um software (ImageTool). Com o objetivo de realizar um teste de validação dos quatro métodos, estes foram aplicados também em diapositivos de figuras geométricas de dimensões conhecidas. Os testes de correlação mostraram altos valores de correlação (r = 0,82 a 0,99) entre os métodos. O teste de validação (ANOVA) não mostrou diferença estatisticamente significante entre as medidas reais dos desenhos geométricos e aquelas obtidas pelos quatro métodos quantitativos. Os métodos quantitativos mostraram-se eficazes e confiáveis na mensuração dos níveis de biofilme em próteses totais, podendo ser úteis em estudos experimentais da eficiência de produtos de higiene. O método computadorizado mostrou-se rápido e de fácil aplicação.
DESCRITORES: Prótese total; Biofilmes.
INTRODUCTION
Several studies have focused on the efficacy of substances and methods for cleansing complete dentures. However, few studies have concentrated on the materials and methods used for quantifi-cation of biofilm (a parameter for the efficacy of hygiene procedures). Biofilm quantification meth-ods vary greatly, making comparison of results difficult. In some experiments, biofilm is clinically
quantified in vivo2,7,9,10,17,19,21,27 using biofilm
dis-closing agents, protein evaluation and microbio-logical quantification. Due to the complexity of these clinical studies, several in vitro laboratorial procedures have been developed20.
A small number of studies have evaluated and discussed the quantification methods used in clinical experiments4,5,8,13,18,24. In these studies, the
216 217
216 217
need for standardization has been mentioned. One of the commonly used methods is biofilm disclo-sure associated with quantitative or scoring meth-ods20. The aim of the present study is to evaluate
the applicability and reliability of four methods for clinical evaluation of quantity of biofilm in com-plete dentures (computerized, paper-weighing, point-counting, and planimetric) associated with biofilm-disclosing agents.
MATERIAL AND METHOD
Sixty-two complete denture wearers were se-lected for this study (22 men and 40 women, aged between 45 and 80 years). The internal surface of the denture (which consisted of pink-colored, thermally cured acrylic resin) was stained with an aqueous solution of 5% erythrosine (Art. 1355 Erythrosin, E. Merck, Darmstadt, Germany). The denture was positioned on a clamp (Universal Adriática S/A, São Paulo, SP, Brazil – intermedi-ate shank at 0°), through its external surface. The stained surface was photographed with a camera (Canon EOS Elan II E QD, Canon Inc., Tokyo, Ja-pan) fixed on a stand (CS-4 Copy Stand Testrite, Newark, NJ, USA) using a slide film (Asa 100, Ko-dak Brasileira Com. e Ind. Ltda. São Paulo, Brazil), with the focus centered on the median palatine raphe, halfway between the maxillary frenum and the posterior margin of the denture.
Application of the biofilm quantification methods
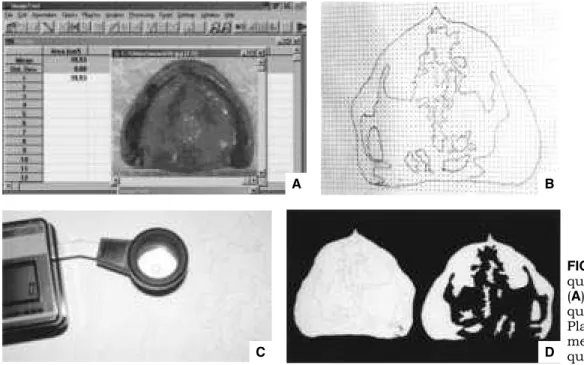
For the computerized method (1), slides were scanned (CanoScan 2700F, Canon Inc., Tokyo, Japan; 680 dpi) and, using these images, the total internal surface of the denture and biofilm-covered areas were measured, using the software ImageTool 2.02 (Windows, Texas, USA) (Figure 1A). The paper-weighing (2), point-counting (3) and planimetric methods (4) were applied to 3 figures obtained by projecting the slides in a dark room, using a Kodak Ektagraphic III projector (Kodak Brasileira Com. e Ind. Ltda. São Paulo, Brazil) placed on a wooden post (1.70 m high) fixed to the ground. Slides were projected on paper (297 x 420 mm and 75 g/m2,
Chamex Print & Copy paper, Chame Chamex Bra-sil, São Paulo, Brazil), resulting in images amplified ten times (36 x 24 cm). The areas of interest (total and biofilm-covered) were outlined using a lead pencil. For the point-counting method, a grid with equidistant points (0.5 cm) was designed using the Page Maker software (Adobe, California, USA); this grid was copied onto an overhead transpar-ency sheet (polyester film, 210 x 297 mm, 40 µm, Chamex, International Paper do Brasil Ltda., Mogi Guaçu, SP, Brazil). The figures were fixed to the working surface with masking tape, and the grid was superimposed on each figure, in order to count the number of points over the total surface and biofilm-covered areas (Figure 1B). For the planim-etric method, the figures representing the areas
FIGURE 1 - ImageTool quantification method (A). Point-counting quantification method (B). Planimetric quantification method (C). Paper-weighing quantification method (D).
B
C D
216 217
216 217
(total and biofilm-covered) were also fixed on a working surface and measured (cm²) using a digital planimeter (Placom KP 92N, Tokyo, Japan) (Fig-ure 1C). For the paper-weighing method, the areas of interest were cut using scissors (Tramontina, RS, Brazil), and the resulting shapes (Figure 1D) were weighed using a precision scale (Metler To-ledo GMbH, Greifensee, Switzerland). For all the four methods, the percentage of biofilm was cal-culated as the ratio between biofilm-covered area (multiplied by 100) and total internal surface of the denture.
Validation test
In order to perform a complementary valida-tion test, a pair of compasses and a ruler were used to draw four geometric figures (Figure 2). All quan-tification methods studied were applied to all fig-ures. Figures were prepared as follows: one white cardboard rectangle (288 x 192 mm), with draw-ings of 20 circles of various diameters (Figure 2A); one black cardboard rectangle (299 x 192 mm), to which 22 gray circles of various diameters were glued (Figure 2B); two black cardboard circles to which 10 gray cardboard circles of smaller diam-eter were glued (Figure 2C and 2D). For each fig-ure, the total area of each rectangle (base × height) and circles (π × r2) were calculated. The percentage
occupied by each inner circle was calculated as the
ratio of its area (multiplied by 100) and the total surface of the geometric figure. All figures were photographed following the same procedure used for photographing the dentures. For the comput-erized method, the areas (total area of the geometric figure and each inner circle) were measured over the scanned slide. After projection of the slides on paper and outlining of the areas of interest, these were cut out and measured by the paper-weigh-ing, point-counting (using a grid), and planimetric methods. In each method, the percentage of the area occupied by each inner circle was calculated as the ratio between its area (multiplied by 100) and the total area of the geometric figure.
In order to compare the percentage values obtained from each method and to evaluate the proportionality relation among them, the regres-sion and correlation test (Pearson’s test) were ap-plied. The partial correlation test was applied in order to compare “r” values. This was done with the purpose to evaluate the best correlation of the association of the different methods. The validation test was performed with the analysis of variance (ANOVA). This test was applied with the purpose to evaluate statistical equality or difference among methods and between them and the real dimen-sions of the geometric figures.
FIGURE 2 (A, B, C, D) - Geomet-ric figures (validation test).
A B
218 219
218 219
RESULTS
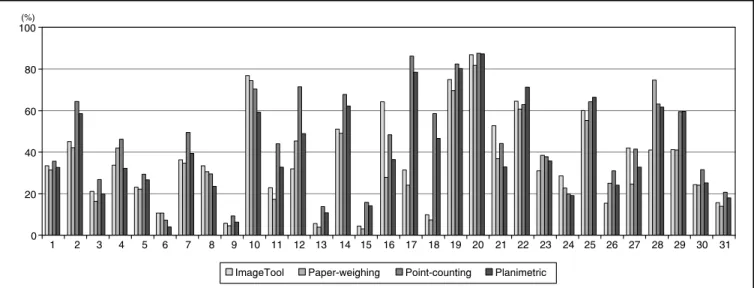
The biofilm percentages are shown in Graph 1 and Graph 2. Table 1 shows the distribution of the number of complete dentures according to the percentage of biofilm.
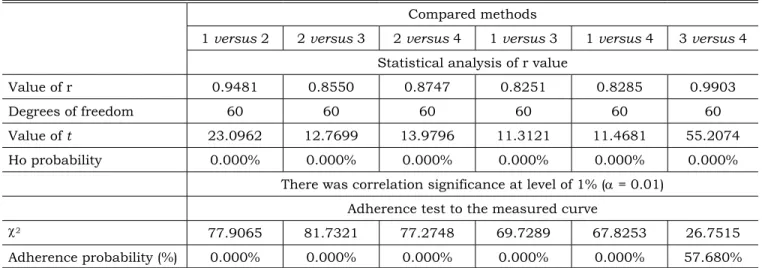
The results of the correlation test are shown in Table 2. Table 3 shows the results of partial correlation.
Table 4 shows the results of the validation test, while Table 5 presents the statistical test ap-plied (analysis of variance - ANOVA).
DISCUSSION
The difficulties for achieving reliable compari-sons among methods for cleansing complete den-tures are related to the fact that different methods are chosen for clinical quantification of biofilm levels26. The level of precision, accuracy, reliability,
and validity of the quantification method chosen should be considered18. An accurate methodology
could be attained by the use of disclosing agents associated with morphometric methods4. Another
factor to be considered is the viability of differ-ent examiners apply a methodology, allowing the reproducibility of the diagnosis inter-examiners. This allows the comparison of results obtained by different research groups1,17,18. Distinction should
also be made between methods that quantify and those that qualify the biofilm layer20. Although the
protein quantification method2,9 seems to be
ac-curate, contamination by saliva may occur. Scan-ning microscopy is more adequate for obtaiScan-ning
qualitative information about the biofilm2.
Micro-biological quantification methods19,21 are very
ac-curate, but time-consuming. They also make the comparison of results difficult when different types of culture medium and methods are used for the collection of microorganism samples20. The
disclos-ing agent method is the most widely applied to complete dentures. Its association to quantitative methods3,6,9,15,19,23,27,29 is less common. However,
few studies discuss the application and reliability of these methods4,8,18,23,24.
In the present study, the photographic method was chosen because the quantification is known to be difficult through visual inspection4. The
chal-lenges presented by the standardization of denture positioning, lighting and contrast of the photo-graphs were previously addressed18. In order to
standardize such conditions, the use of digital im-aging has been suggested27. In the present study,
controlled conditions of lighting and film process-ing were applied. Previous analyses of this photo-graphic method, used for comparing total surface areas (internal and external) of complete dentures, showed high correlation coefficients6,23.
In the literature, several denominations to the methods that quantify the biofilm in complete dentures that are not related to subjective meth-ods were found (scoring method). Those methmeth-ods were denominated as quantitative methods in this study. In others studies, those methods were de-nominated as based on physical and analytical parameters12, photographic16, morphometric3,4, or
with quantitative image superimposition18. The
GRAPH 1 - Percentage of biofilm in 31 maxillary complete dentures obtained using quantitative methods (1-31).
1 2 3 4 5 6 7 8 9 10 11 12 13 14 15 16 17 18 19 20 21 22 23 24 25 26 27 28 29 30 31 0
20 40 60 80 100(%)
218 219
218 219
point-counting method3,4 showed high correlation
values, but this result was based on measurements performed twice by the same examiner. The plani-metric method was reported as used for quantifica-tion analysis on natural teeth14,25. Both methods
presented sensitivity for the detection of biofilm levels in complete dentures8. The paper-weighing
method was previously applied to natural teeth12
and complete dentures22,29 and its reproducibility
was tested23. The use of the computerized method
is relatively new for complete dentures. Minagi et al.19 (1987) used computerized analysis; however,
dentures were fragmented before quantification. Sheen, Harrison27 (2000) used computerized
digit-al imaging, but they digit-also highlighted the need for apply reproducibility tests on their method. The computerized method in this study was used for the evaluation of a hygiene product6 and brushes28
for cleansing complete dentures, but its validity was not tested.
Graphs 1 and 2 show that methods of biofilm quantification, although more challenging than scoring methods, offer objective and accurate re-sults. Since these methods do not rely on ability, calibration, or number of examiners, they should be the methods of choice in clinical experiments for the evaluation of complete denture cleansers. The difficulty in differentiating biofilm from food residues and stains in the photographs is con-sidered a limitation of these methods27 and might
explain the disagreement among some values in Graphs 1 and 2.
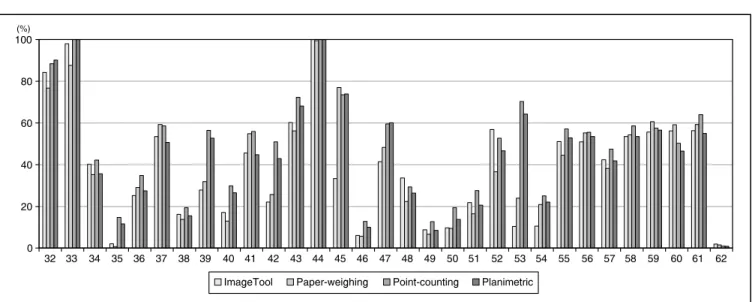
Although the examiner was trained on the four methods the time spent to measure the areas of in-terest was considerably high for all methods. How-ever, the computerized method was clearly faster (average time: 20 minutes), since the measure-ments were performed directly from the scanned image and the program measured the selected area. On the quantitative methods of paper-weigh-GRAPH 2 - Percentage of biofilm in 31 maxillary complete dentures obtained using quantitative methods (32-62).
0
32 33 34 35 36 37 38 39 40 41 42 43 44 45 46 47 48 49 50 51 52 53 54 55 56 57 58 59 60 61 62 20
40 60 80 100(%)
ImageTool Paper-weighing Point-counting Planimetric
TABLE 1 - Quantitative methods: distribution of the number of complete dentures according to the percentage of
biofilm.
Class intervals
(percentage of biofilm) ImageTool (1)n % Paper-weighing (2)n % Point-counting (3)n % Planimetric (4)n %
1) 0 0 0 0 0 0 0 0 0
2) 0.01 to 25.49% 23 37.1 25 40.3 13 21.0 18 29.0
3) 25.50 to 50.49% 19 30.6 19 30.6 20 32.3 20 32.3
4) 50.50 to 75.49% 15 24.2 13 21.0 23 37.1 18 29.0
220 221
220 221
ing, point-counting and planimetric, besides the time spent to trace the areas, time was also spent to count the points, use the planimeter and cut the paper (average time: 40 minutes). Specifically for the weighing method, the time spent during weighing has to be considered. The computerized
TABLE 3 - Results of the partial correlation test - R1 versus R2 (1 - paper-weighing/ImageTool; 2 - paper-weigh-ing/point-counting; 3 - paper-weighing/planimetric; 4 - ImageTool/point-counting; 5 - ImageTool/planimetric; 6 - point-counting/planimetric).
Correlated
methods R
1st sample 2nd sampleR
Degrees of freedom (1st and2nd
samples)
Variance
common value Z probabilityHo Significance 1st 2nd
1 versus 2 0.9481 0.8550 59 0.1841 4.1339 0.00% 1% (α = 0.01) 1 versus 3 0.9481 0.8747 59 0.1841 3.5325 0.04% 1% (α = 0.01) 1 versus 4 0.9481 0.8251 59 0.1841 4.9164 0.00% 1% (α = 0.01) 1 versus 5 0.9481 0.8285 59 0.1841 4.8338 0.00% 1% (α = 0.01) 1 versus 6 0.9481 0.9903 59 0.1841 6.5237 0.00% 1% (α = 0.01) 2 versus 3 0.8550 0.8747 59 0.1841 0.6014 54.76% Not significant 2 versus 4 0.8550 0.8251 59 0.1841 0.7824 43.40% Not significant 2 versus 5 0.8550 0.8285 59 0.1841 0.6999 48.40% 1% (α = 0.01) 2 versus 6 0.8550 0.9903 59 0.1841 10.6576 0.00% 1% (α = 0.01) 3 versus 4 0.8747 0.8251 59 0.1841 1.3838 16.64% Not significant 3 versus 5 0.8747 0.8285 59 0.1841 1.3013 19.32% Not significant 3 versus 6 0.8747 0.9903 59 0.1841 10.0562 0.00% 1% (α = 0.01) 4 versus 5 0.8251 0.8285 59 0.1841 0.0825 93.42% Not significant 4 versus 6 0.8251 0.9903 59 0.1841 11.4400 0.00% 1% (α = 0.01) 5 versus 6 0.8285 0.9903 59 0.1841 11.3575 0.00% 1% (α = 0.01)
TABLE 2 - Regression and correlation tests (ImageTool-1, paper-weighing-2, point-counting-3 e planimetric-4).
Compared methods
1 versus 2 2 versus 3 2 versus 4 1 versus 3 1 versus 4 3 versus 4 Statistical analysis of r value
Value of r 0.9481 0.8550 0.8747 0.8251 0.8285 0.9903
Degrees of freedom 60 60 60 60 60 60
Value of t 23.0962 12.7699 13.9796 11.3121 11.4681 55.2074
Ho probability 0.000% 0.000% 0.000% 0.000% 0.000% 0.000%
There was correlation significance at level of 1% (α = 0.01) Adherence test to the measured curve
χ2 77.9065 81.7321 77.2748 69.7289 67.8253 26.7515
Adherence probability (%) 0.000% 0.000% 0.000% 0.000% 0.000% 57.680%
method can also be performed without a scanner, if a digital camera is connected to the computer27,28.
Hutchins, Parker11 (1973) and Silva et al.29 (2002)
220 221
220 221
Circles RD IT PW PC PN
Fi
gu
re
A
1 21.13 20.79 20.99 20.38 21.21 2 0.82 0.80 0.76 0.82 0.83 3 1.45 1.38 1.37 1.44 1.43 4 2.05 2.01 1.98 2.02 2.00 5 4.61 4.58 4.27 4.44 4.47 6 2.05 2.02 1.98 1.98 1.15 7 0.57 0.64 0.60 0.62 0.67 8 1.19 1.21 1.17 1.30 1.18 9 2.62 2.68 2.63 2.70 2.62 10 0.96 0.94 0.93 1.09 0.87 11 0.89 0.91 0.86 0.99 0.90 12 0.57 0.61 0.58 0.62 0.58 13 0.26 0.30 0.27 0.27 0.25 14 2.87 2.88 2.96 2.94 2.90 15 0.63 0.64 0.63 0.68 0.64 16 1.03 1.07 1.04 1.03 1.05 17 1.03 1.10 1.12 1.13 1.56 18 1.64 1.65 1.76 1.68 1.70 19 0.36 0.39 0.38 0.41 0.41 20 0.57 0.33 0.36 0.31 0.32
Fi
gu
re
B
1 21.13 21.05 20.88 20.35 20.65 2 0.75 0.81 0.78 0.84 0.78 3 0.32 0.33 0.31 0.34 0.35 4 1.03 1.10 1.08 1.18 1.11 5 0.51 0.57 0.58 0.54 0.54 6 5.63 5.93 6.05 5.80 6.00 7 0.41 0.48 0.44 0.49 0.47 8 0.46 0.52 0.49 0.56 0.50 9 0.57 0.60 0.61 0.54 0.57 10 3.69 3.75 3.59 3.50 3.72 11 0.05 0.06 0.06 0.07 0.03 12 8.20 8.39 8.45 8.26 8.25 13 0.51 0.57 0.52 0.54 0.56 14 0.69 0.69 0.70 0.71 0.67 15 1.32 1.35 1.31 1.39 1.33 16 0.08 0.09 0.08 0.10 0.07 17 0.32 0.35 0.32 0.38 0.31 18 0.57 0.58 0.53 0.56 0.53 19 1.94 1.98 1.89 2.01 1.90 20 0.46 0.49 0.47 0.52 0.50 21 0.89 0.90 0.84 0.94 0.66 22 2.33 2.37 2.21 2.29 2.27
Circles RD IT PW PC PN
Fi
gu
re
C
1 28.03 28.91 28.18 28.99 28.80 2 0.35 0.40 0.39 0.44 0.33 3 3.11 3.33 3.32 3.71 3.35 4 2.34 2.49 2.41 2.77 2.54 5 3.54 3.78 3.59 3.93 3.83 6 3.11 3.17 3.28 3.57 3.26 7 3.77 3.90 4.00 4.15 3.95 8 4.00 4.53 4.47 4.81 4.55 9 3.11 3.53 3.38 3.79 3.50 10 3.77 3.96 3.95 4.22 4.31
Fi
gu
re
D
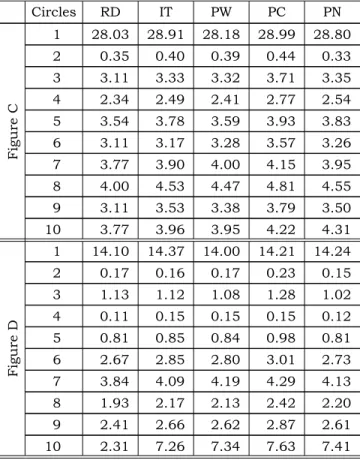
1 14.10 14.37 14.00 14.21 14.24 2 0.17 0.16 0.17 0.23 0.15 3 1.13 1.12 1.08 1.28 1.02 4 0.11 0.15 0.15 0.15 0.12 5 0.81 0.85 0.84 0.98 0.81 6 2.67 2.85 2.80 3.01 2.73 7 3.84 4.09 4.19 4.29 4.13 8 1.93 2.17 2.13 2.42 2.20 9 2.41 2.66 2.62 2.87 2.61 10 2.31 7.26 7.34 7.63 7.41 RD: real dimension, IT: ImageTool, PW: paper-weighing, PC: point-counting, PN: planimetric.
TABLE 5 - Analysis of variance results (validation
test).
Analysis of variance Source
of
variation SS DF MS (F) Ho prob. Between
methods 0.1053 4 0.0263 0.32 13.8261 Residue 19.7137 244 0.0810
Total
variation 97.2552 309
Means - single factor of variation: methods
Real dimension 0.10669
Paper-weighing 0.09415
ImageTool 0.13771
Point-counting 0.14318
Planimetric 0.11887
Statistically equal means
SS: Sum of squares, DF: degrees of freedom, MS: mean squares, prob:. probability.
TABLE 4 - Validation test: percentage of the inner circle areas (real dimensions and measurements obtained using
222 223
222 223
of good coloration and easy removal from the den-ture. It is important to note that when biofilm is to be measured on denture bases made of clear acrylic resin, a colored background to contrast with the disclosing agent should be used11,29. In
the present study, clear-base dentures were not selected, in order to eliminate this variable.
The point-counting procedure presented the highest values for biofilm level (n = 41; 66.1%), while the paper-weighing method showed the low-est values (n = 37; 59.6%) (Graphs 1 and 2). These results are in agreement with those observed by Fernandes et al.8 (2002). However, the data in
Table 1 show that, for all 4 methods, within each class interval, the distribution of the number of prosthesis did not vary, showing that most den-tures were placed within the 2 to 4 class inter-vals (1% to 75% of the internal surface covered by biofilm) and few of them showed high levels of biofilm (class interval number 5 – 75% to 100% of the internal surface covered by biofilm). The data in Table 1 confirm the standard of the re-sults in Graphs 1 and 2, so to the paper-weighing method the high number of complete dentures (25) was in class interval number 2 (up to 25% of biofilm) showing lower biofilm levels, and for the point-counting method most dentures were in class interval number 4 (from 51% to 75% biofilm), showing higher biofilm levels.
The validation tests were used to evaluate the four quantitative methods applying them to known dimensions (real values). No significant differences were found between measurements obtained by all four methods and between them and real dimen-sions of the geometric shapes. The same tendency presented on Graphs 1 and 2 was also observed with the method of point-counting showing the highest average, and the paper-weighing method the lowest one (Table 5). The paper-weighing meth-od showed the closest results when compared with the real dimensions, followed by the planimetric method.
Correlation results showed high (0.82 to 0.99) and significant (p < 0.01) coefficients. Percentages (Graphs 1 and 2), distribution of number of den-tures (Table 1) and high correlation values (Ta-ble 2) suggest that all four methods can be used for quantification of biofilm in complete dentures. The statistical significance (Table 3) of correlation factors for the association of paper-weighing/ ImageTool, compared to the associations paper-weighing/point-counting and paper-weighing/pla-nimetric methods indicates the best correlation for
the first association. This result is satisfactory, since the paper-weighing method presented high correlation values in a previous study of duplicate measurements on 222 slides of complete denture photographs23. These results indicate that the
computerized method (ImageTool) is reliable, since its correlation with the paper-weighing method was high. The correlation values between the associa-tion weighing/point-counting and paper-weighing/planimetric were lower (0.85 and 0.87, respectively, Table 3). The planimeter is very dif-ficult to be applied in small areas (0.2 to 0.5 cm²) and its application to even smaller areas (0.1 cm²) is virtually impossible. The point-counting method can be performed directly on the slide projection, but it is the most challenging method, presenting the greatest possibility of error.
Methods for biofilm quantification should be regarded as important procedures by those who work with complete dentures as the maintenance of prosthetic devices represents a challenge for patients and practioners. Nevertheless, biofilm quantification methods are frequently unknown or applied either in a negligent manner or without compliance to adequately established criteria.
CONCLUSIONS
According to the results obtained, it may be concluded that:
1. Quantitative methods showed efficacy in the clinical measurement of biofilm levels on complete denture surfaces. Therefore, these methods may be useful in studies in order to evaluate the efficacy of denture cleansers. 2. The correlation coefficients obtained varied
from 0.82 to 0.99. This represents a high correlation rate among the four quantitative methods evaluated in this study.
3. Considering the time spent in the application of each procedure, the computerized method may be the first choice for quantification of biofilm on the surface of complete dentures.
ACKNOWLEDGMENTS
222 223
222 223
REFERENCES
1. Abelson DC. Denture plaque and denture cleansers: review of the literature. Gerodontics 1985;1:202-6.
2. Altman MD, Yost KG, Pitts G. A spectrofluorometric pro-tein assay of plaque on dentures and of denture cleaning efficacy. J Prosthet Dent 1979;42:502-6.
3. Ambjornsen E, Rise J. The effect of verbal information and demonstration on denture hygiene in elderly people. Acta Odontol Scand 1985;43:19-24.
4. Ambjornsen E, Rise J, Haugejorden O. A study of examiner errors associated with measurement of denture plaque. Acta Odontol Scand 1984;42:183-91.
5. Ambjornsen E, Valderhaug J, Norheim PW, Floystrand F. Assessment of an additive index for plaque accumula-tion on complete maxillary dentures. Acta Odontol Scand 1982;40:203-8.
6. Andruciolli MCD, Macedo LD, Lara EHG, Panzeri H, Para-nhos HFO. Avaliação de pasta higienizadora de próteses totais sobre o biofilme da dentadura em pacientes com es-tomatite de dentadura. Pesqui Odontol Bras 2002;16:84. 7. Augsburger RH, Elahi JM. Evaluation of seven proprietary
denture cleansers. J Prosthet Dent 1982;47:356-9. 8. Fernandes RAG, Zaniquelli O, Paranhos HFO. Análise dos
métodos de contagem de pontos e planímetro na quantifi-cação do biofilme da dentadura – um estudo de validação metodológica. Pesqui Odontol Bras 2002;16:63-8. 9. Ghalichebaf M, Graser GN, Zander HA. The efficacy of
den-ture-cleansing agents. J Prosthet Dent 1982;48:515-20. 10. Gornitsky M, Paradis I, Landaverde G, Malo AM, Velly
AM. A clinical and microbiological evaluation of denture cleansers for geriatric patients in long-term care institu-tions. J Can Dent Assoc 2002;68:39-45.
11. Hutchins DW, Parker WA. A clinical evaluation of the ability of denture cleaning solutions to remove dental plaque from prosthetic devices. N Y State Dent J 1973;39:363-7. 12. Ito IY, Verri RA, Ribas JP, de Lima SNM, Palamin RY,
Campos GM. Efeitos do cloreto de cetilpiridínio na inibição da placa dental. Odont Moderno 1980;7:8-23.
13. Jeganathan S, Thean HPY, Thong KT, Chan YC, Singh M. A clinically viable index for quantifying denture plaque. Quintessence Int 1996;27:569-73.
14. Keenan MP, Shillingburg HT, Duncanson MG, Wade CK. Effects of cast gold surface finishing on plaque reten-tion. J Prosthet Dent 1980;43:168-73.
15. Lovato CH, Paranhos HFO, Ito IY. Aplicação clínica de evidenciadores de biofilme em próteses totais. RPG Rev Pós Grad 2000;7:311-9.
16. Manderson RD, Brown D. A clinical and laboratorial investigation of a new denture cleaner. J Dent 1978;6:222-8.
17. McCabe JF, Murray ID, Kelly PJ. The efficacy of den-ture cleansers. Eur J Prosthodont Restor Dent 1995;3:203-7.
18. McCabe JF, Murray ID, Laurie J, Kelly PJ. A method for scoring denture plaque. Eur J Prosthodont Restor Dent 1996;4:59-64.
19. Minagi S, Tsunoda T, Yoshida K, Tsuru H. Objec-tive testing of the efficiency of denture-cleansing agents. J Prosthet Dent 1987;58:595-8.
20. Nikawa H, Hamada T, Yamashiro H, Kumagai H. A review of in vitro and in vivo methods to evaluate the efficacy of denture cleansers. Int J Prosthodont 1999;12:153-9. 21. Odman PA. The effectiveness of an enzyme-containing
denture cleanser. Quintessence Int 1992;23:187-90. 22. Paranhos HFO, Lara EHG, Panzeri H, Candido RC,
Ito IY. Capacity of denture plaque/biofilm removal and antimicrobial action of a new denture paste. Braz Dent J 2000a;11:97-104.
23. Paranhos HFO, Lara EHG, Panzeri H, Ito IY, Par-dini LC. Evaluation of a specific method of denture biofilm quantification. J Dent Res 2000b;79:470.
24. Poulsen S, Budtz-Jorgensen E, Knudsen AM, Nielsen L, Kelstrup J. Evaluation of two methods of scoring denture plaque. Acta Odontol Scand 1983;41:283-6.
25. Quirynen M, Marechal M, Busscher H, el-Abiad M, Arends J, van Steenberghe D. The influence of surface characteristics on the early bacterial colonization of intra-oral hard surfaces. J Clin Dent 1988;(Suppl 1A):A14-9. 26. Shannon IL, McCrary BR, Starcke EN. Removal of
salivary deposits by commercial denture cleansers. Gen Dent 1976;24:30-4.
27. Sheen SR, Harrison A. Assessment of plaque preven-tion on dentures using an experimental cleanser. J Prosthet Dent 2000;84:594-601.
28. Silva CHL. Avaliação da eficiência do uso caseiro de um evidenciador de biofilme associado a uma técnica mecânica de higiene de próteses totais [Tese de Doutorado]. Ribeirão Preto: Faculdade de Odontologia de Ribeirão Preto da USP; 2002.
29. Silva CHL, Paranhos HFO, Ito IY. Evidenciadores de biofilme em prótese total: avaliação clínica e antimicrobia-na. Pesqui Odontol Bras 2002;16:270-5.