1
BARRIERS TO INNOVATION IN THE BRAZILIAN ECONOMY: IMPACTS AND LESSONS FOR PUBLIC POLICY*
Mauricio Canêdo-Pinheiro FGV/EPGE and UERJ/FCE
Filipe Lage de Sousa UFF and BNDES Vinícius Barcelos de Oliveira
FGV/EPGE
Abstract
In an effort to understand the barriers of innovation, we explore a firm-level database from different waves of the Brazilian innovation survey. Our initial objective is to understand what main determinants of each obstacle for innovation are and whether complementarities between them exist. Subsequently, we address whether firms cooperate to overcome these barriers. Last, but not least, we investigate whether these barriers affect innovation inputs (R&D investments, for example) and outputs (product and/or process innovation). We find that the financial obstacles have a negative on cooperation and innovative activities, but they are not the most important obstacle to innovation outputs, as knowledge barrier presents robust outcomes deterring firms to introduce a new product or process.
JEL Codes: O31, O32, O33
Keywords: Barriers to innovation, Engagement in innovation activities, Innovative firms,
Non-innovators
* This paper was funded by Applied Research Network form FGV. This paper is also part
of the research project "Assessing the Impacts of Market Failures on Innovation in LAC Countries", led and financed by the Competitiveness, Technology, and Innovation Division of the Inter-American Development Bank (IDB). The information and opinions presented here are entirely those of the authors, and do not necessarily reflect the views of the IDB, its Board of Executive Directors, or the countries they represent.
2
1. Introduction
As observed in the literature review on productivity’s determinants by (Syverson 2011), innovation is an important catalyzer for productivity growth. However, innovation is a risky investment and most of the literature has focused its attention on financial obstacles to innovate, see (Hall 2002) for a literature survey on financial barriers. Recent papers on innovation obstacles [see (Álvarez and Crespi 2015) as an example] remain emphasizing access to credit as the main barrier to innovate and other aspects have been neglected, such as market constraints, access to knowledge, regulations, and others. Due to the availability of different waves of innovation surveys in different countries, literature started to find that these other barriers are as relevant as financial constraints [see (Pellegrino and Savona 2017) for the UK and (Mohan, Strobl, and Watson 2017) for the Caribbean countries], especially market conditions. There is scarcity knowledge on the effects of these other barriers to innovation, especially in developing world.
The problem of slow productivity growth remains a relevant issue in Latin American and Caribbean (LAC) countries, see (Pagés 2010). In an effort to understand the barriers of innovation, the Inter-American Development Bank led an investigation in four LAC countries: Argentina, Brazil, Chile, and Uruguay.1 Among these four countries, Brazil is an interesting case for such investigation because the volume of government support to mitigate financial barriers has increased substantially in the last years. These public policies have also reached a different spectrum of firms, as there were new financial tools to support innovation. Additionally, there was also a shift of government policies towards more support for innovation in the private sector rather than for innovation activities made in universities and research centers (Canêdo-Pinheiro 2013). As an illustration, 6.4% of Brazilian manufacturing firms have received government support to innovate in 2005, while the same share reached 14.5% in 2014 (Cânedo-Pinheiro and Figueiredo 2017). On one hand, the existent literature shows that, in general terms, these public policies worked reasonably well. There is evidence that everything else constant, the public support increased the innovative efforts in the private sector, not merely crowded out other sources of private funding to innovation.2 On the other hand, other evidence shows that these policies had a limited impact on the efforts of the private sector to innovate. For example, although the percentage of innovative firms increased 5 p.p. from 2005 to 2008, it retracted 2 p.p. in 2014.3 A similar trend was observed for expenditures on innovation (such as its share in terms of sales). Given the size of government support to mitigate the financial obstacles faced by Brazilian firms during this period (an increase of 8p.p. of firms receiving government support), private sector’s innovation effort might have been more noticeable (not only an increase of 3 p.p.). Therefore, other barriers might have taken place which prevented private-sector effort to correspond the size of government support. For instance, it was also observed a substantial increase in the private sector perception of the severity of obstacles to innovation regarding knowledge, especially the lack of qualified workforce [(Kühl and Da Cunha 2013; Cânedo-Pinheiro and Figueiredo 2017)]. Therefore, it is relevant to understand what are the effective barriers hampering innovation efforts in the private sector.
1 See (Arza and López 2018) for Argentina, (Zahler, Goya, and Caamaño 2018)for Chile and (Bukstein, Hernández, and Usher 2018) for Uruguay.
2 See Canêdo-Pinheiro & Figueiredo (2017) for a literature review on this subject.
3 Percentage of innovative firms in the manufacturing sector was 33.4% in 2005, 38.4% in 2008 and 36.3% in
3
Given this background, this paper investigates the Brazilian case using firm-level data from different waves of the innovation survey. In these surveys, it is feasible to group these obstacles into five categories: financial; knowledge, market; organizational; regulatory. Based on this classification, our initial objective is to understand what main determinants of each obstacle for innovation are and whether complementarities between them exist. Subsequently, we address whether firms cooperate to overcome these barriers. Last, but not least, we investigate whether these barriers affect innovation inputs (R&D investments, for example) not only by their propensity to innovate but also their intensity, as well as innovation outputs (product and/or process innovation).
We find that the financial obstacles have a negative on all categories of innovative inputs and outputs. However, knowledge barriers present similar negative impact on innovation outputs (product and process innovation) as financial obstacles, which explains partially why financial support provided by the government was not able to deliver an outcome similar to the amount provided.
Additionally, large and small firms also differ in terms of what other barriers affect their innovation outcomes. While knowledge obstacle is more evident in small firms as observed in other developing countries (Mohan et al, 2017), organizational and market barriers tend to affect only larger firms. Moreover, it seems that Brazilian large firms might face market barriers as those in developed countries (Pellegrino & Savona, 2017).
Therefore, public policies aiming to boost innovation in the Brazilian private sector need to address not only those affecting any firm size (financial barrier), but also those affecting distinct firms’ size (market and organizational for large firms and knowledge for small). Contrary to the existent literature, our results do not back up the negative effect of regulatory barriers on innovation outcomes, which was evidenced in Pellegrino & Savona (2017) and Mohan et al (2017).
The paper is structured as follows. Section 2 describes the dataset and the relevant sample. Section 3 describes the methodology and results of the investigation on the determinants of barriers to innovation. Section 4 does the same to the relationship between obstacles to innovation and cooperation. Section 5 investigates the impact of these obstacles on innovation inputs and outputs. Section 6 list some policy recommendations and the final remarks.
2. Dataset and Relevant Sample 2.1. Data Sources
Our main information source is the firm-level data from the Brazilian innovation survey, named PINTEC by its acronym in Portuguese, from the Brazilian Statistical Institute (IBGE). It is a sample survey, inspired by the Oslo Manual, which means that it is comparable to other similar surveys worldwide.4
We use five waves of this survey (2001-2003, 2003-2005, 2006-2008, 2009-2011 and 2012-2014) which enables us to construct an unbalanced panel of firms and tocontrol the time-invariant non-observable characteristics.5
4 The interviews are done by telephone and with the support of a computer system that guarantees the
consistency of the answers (Computer Assisted Telephone Interview – CATI System).
4
PINTEC’s sample is stratified with respect to firm size (number of employees), sector, state and innovation potential. Firms with less than 10 employees are not surveyed and larger firms (with 500 or more employees) are allocated in a specific stratum and selected with probability equal to one (certain stratum). The other firms are allocated to sampled strata, which were defined by crossing information on state and sectors. These strata (called natural strata) are then subdivided into two strata (called final strata), one with potential innovators and other with the remaining firms.6 The sample is disproportionately allocated in these two final strata, so that approximately 80% of the firms selected for a sample, in each natural stratum, are companies very likely to be innovative.7
Once PINTEC cover mostly innovation-related information, we merged it with an additional survey from IBGE, Annual Manufacturing Survey (PIA is its acronym in Portuguese), to expand the set of available data on firms. PIA is compatible to PINTEC in methodological terms, such as same sector classification, and covers all manufacturing and mining firms with 30 or more employees (smaller firms are sampled on a probabilistic basis).
Moreover, PINTEC was restricted to manufacturing and mining sector until the 2001-2003 survey. In the following surveys, the coverage was amplified to some few service sectors. In other words, given the PINTEC and PIA samples, the focus of this paper is mostly the manufacturing and mining firms with 30 or more employees.8
2.2. Relevant Sample
Figure 1 below describes the PINTEC’s response flow. Notice that both innovators and
non-innovators firms answer the questions on obstacles to innovation. Basically, non-innovators answer all groups of questions, except the group 2B, while non-innovators with incomplete or abandoned projects answer all of them, except the questions on innovations descriptions (group 3).
Firms that neither innovate nor have incomplete or abandoned projects answer group 1, 2A and 2B questions, skip group 3 to group 12 questions and then answer the last three groups of questions (13 to 15), including questions on barriers to innovation.
6 In summary, potential innovators are defined by IBGE as firms that, in the survey period, were included in the
registers of beneficiaries of innovation public policies or in the Brazilian patent registers. The ones that were innovators in the previous surveys are also defined as potential innovators.
7 In natural strata where the total number of firms in the population is less than or equal to five, all firms are
included in the sample with probability of selection equal to one.
8 Only few firms below 30 employees are available at PINTEC, which impinge us to use firms below this
5
Figure 1: PINTEC’s Response Flow
In turn, Figure 2 shows the PINTEC’s response flow only with respect to obstacles to innovations (group 13 questions). It’s important to point out that, to explain the reason for the absence of innovative activities, non-innovators without projects should select only one of the three options: (a) no need, because of previous innovations; (b) no need, because of market conditions; (c) other factors blocked the development or implementation of innovation. If the answer is (c) the company must answer the importance scale questions on obstacles to innovate. Otherwise, it must skip these importance scale questions and answer group 14 questions on organizational and marketing innovations. Innovators and non-innovators with incomplete or abandoned projects must answer the same important questions on obstacles, but only if they report facing barriers to innovation.
Product or Process Innovation? No No Yes Yes Innovations Descriptions Innovative Activities Public Support Barriers to Innovate Cooperation Impacts Sources of Information Internal R&D External R&D Organizational and Marketing Innovations Firms Characteristics Funding Incomplete or Abandoned Projects? Biotechnology and Nanotechnology Adoption Informal Innovation Property Rights 2A 1 3 4 5 6 7 8 9 10 11 12 13 14 15 2B
6
Figure 2: PINTEC’s Response Flow – Group 13 Questions (Barriers to Innovation)
So, from the innovation (and barriers to innovation) perspective, it is feasible to sort Brazilian firms in three groups:
Innovation-active – includes innovators, which implemented product or process
innovation, and failed innovators, those that did not innovate but tried to do so (with incomplete or abandoned innovation projects);
Potential Innovators – firms that, because of obstacles to innovation, were not active
in innovation;
Non-Innovation Oriented – firms that, despite not facing obstacles to innovation, did
not engage in innovative activities.
Factors High Medium Importance Low Not Relevant
Excessive Economic Risks
□
□
□
□
High Innovation Costs
□
□
□
□
Scarcity of Financial Support
□
□
□
□
Shortage of Qualified Workforce
□
□
□
□
Lack of Information on Technology
□
□
□
□
Lack of Market Information
□
□
□
□
Lack of Proper Technical External Services
□
□
□
□
Scarcity of Cooperation Possibilities
□
□
□
□
Weak Consumer Demand
□
□
□
□
Rigid Organization
□
□
□
□
Centralization of Innovation in Another Firm within the Group
□
□
□
□
Difficulties to Adapt to the Norms and Standards□
□
□
□
14
Organizational and Marketing Innovations Yes No Previous Innovation Market Conditions Innovators Non-Innovators with Incomplete or Abandoned Projects Non-Innovators without Projects Barriers to Innovate? Why no Innovative Activities? Other Factors7
Non-innovation oriented firms tend to report that barriers to innovation are not relevant. This fact may generate a positive correlation between the obstacles to innovation and the propensity to innovate (Savignac 2008). Therefore, we exclude the non-innovation oriented firms from our sample to correct this sample selection problem, as made in (Pellegrino and Savona 2017) – see Figure 3 for details.9 This selected group is named as relevant sample and used throughout this paper for all empirical results.10
Figure 3: Selection of the Relevant Sample
Obs.: Numbers represent firm-year observations
2.3. Variables
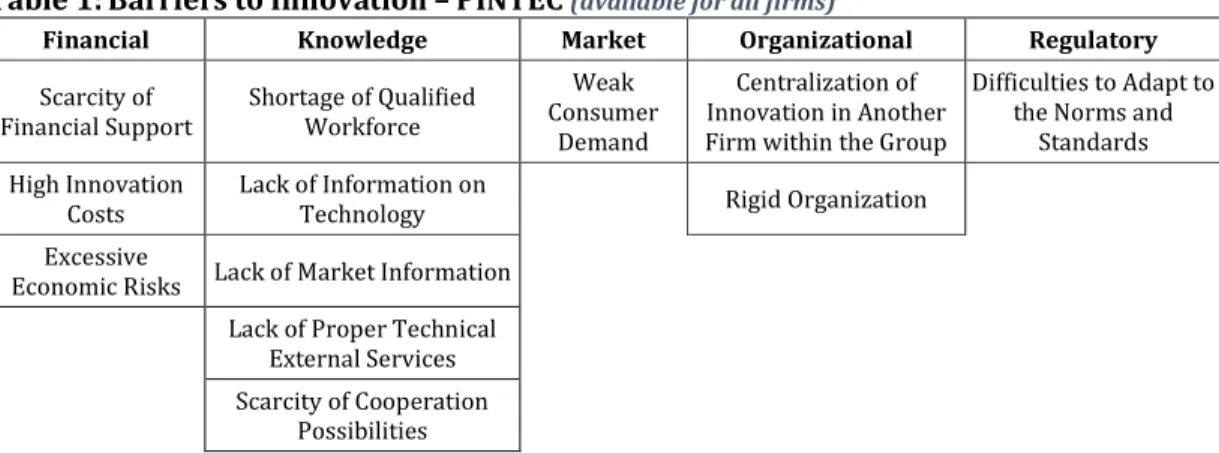
PINTEC permit the identification of the main barriers faced by firms, innovation-active or not (see Table 1 for more details). For the sake of comparison with the previous literature, we define that a firm faces a certain type of obstacle if it considers this obstacle of high importance into the five categories described previously. For example a firm is said to face financial obstacles if it gives high importance to excessive economics risks, high innovation costs or scarcity of financial support. The same logic holds for the remaining obstacles.
9 Note that we use the same methodology of (Pellegrino and Savona 2017) for defining the relevant sample. However, we gave names different from those given by (Pellegrino and Savona 2017) for the three groups of companies. In fact, we follow the Unesco Institute for Statistics denominations [(UIS 2015)].
10 Outcomes with all firms are also available upon request, but they do not add any economic interpretation to the phenomenon investigated.
All Firms (49.454) Innovation-active (26.033) Innovators (24.729) Failed Innovators (1.304) Innovation-innactive (23.421) Potential Innovators (4.935) Non-Innovation Oriented (18.486)
8
Table 1: Barriers to Innovation – PINTEC (available for all firms)
Financial Knowledge Market Organizational Regulatory Scarcity of Financial Support Shortage of Qualified Workforce Weak Consumer Demand Centralization of Innovation in Another Firm within the Group
Difficulties to Adapt to the Norms and
Standards High Innovation
Costs
Lack of Information on
Technology Rigid Organization Excessive
Economic Risks Lack of Market Information Lack of Proper Technical
External Services Scarcity of Cooperation
Possibilities
Note: The answer is provided in importance scale: not relevant (0), low (1), medium (2), high (3). See Appendix B for a detailed description of the obstacles.
It is also possible to obtain information on cooperative activities with other economic agents (see Table 2 for more details). As in obstacles, firms classify them into the same level of importance, yet we define that a firm cooperates only if it attributes high importance to this cooperation, following our strategy in the barriers case.
Table 2: Cooperation – PINTEC
(only available for innovators and failed innovators)
With Firms With Research Institutions and Related
Clients or Consumers University and Research Institutes
Suppliers Technical Assistance and Centers of Professional Capacitation Competitors Testing, Experiment and Certification Institutions Other Firms Within the
Group Consultancy Firms
Note: The answer is given in importance scale: non-relevant (0), low (1), medium (2), high (3). It is also available the partners’ localization, as well as the main goal of the partnership.
For innovation, PINTEC provides information on innovation inputs and outputs. For innovation outputs, it provides whether the firm has introduced a new product or process over the last three years, which limits our analysis to only propensity to innovate since there is no information on how much of their revenue is derived by the introduction of new products. For innovation inputs, it is feasible to investigate broadly, because there is the information on how much the firm has spent in different innovative activities (see Table 3 for more details).
9
Table 3: Innovative Activities – PINTEC
(only available for innovators and failed innovators)
R&D Other Tangibles Tangibles
Internal External Acquisition of Knowledge
Software Acquisition
External Training Machinery and equipment
Acquisition Introduction of
Innovations into the Market Others
Note: The answer is given not only in terms of scale of importance – not developed (0), low (1), medium (2) and high (3) – but also in magnitude (expenditure).
Finally, Appendix A presents a list and a description of the variables of interest used in this paper, obtained (directly or indirectly) from PINTEC and PIA.
2.4. Some Descriptive Statistics
Following the groups defined in Section 2.2, we present some descriptive statistics on obstacles to innovation in Table 4, which shows the proportion of firms that have acknowledged each type of barriers with high importance by the groups defined in Figure 3. In total, the share of potential innovators facing barriers to innovate tends to be around the double (precisely 86.2%) of any other category (for instance, this percentage is 37.9% for active innovators).
Within the different types of barriers, financial issues appear to be the most relevant obstacle hampering firms to innovate. For example, 38.7% of oriented innovators, which includes potential and active innovators, admit financial constraints impinge them to innovate and percentage of firms regarding other barriers are significantly lower (20.6% for knowledge barriers, 5.1% for market issues, 6.9% for the organization and 7.6% for regulations). Moreover, differences between potential innovators and active innovators are even more pronounced in financial aspect than any other issue, since 76.7% of potential innovators face financial obstacles, while the percentage for active innovators is only 31.5%. For instance, the numbers for knowledge obstacles are 32.5% and 18.3%, respectively. It is important to emphasize that these discrepancies are much wider in the Brazilian case than in developed countries [(Pellegrino and Savona 2017) for the UK as an example] or in a developing context [(Mohan, Strobl, and Watson 2017) for the Caribbean countries as an example]. In the UK, the percentage of firms reporting knowledge, financial and market obstacles are extremely similar (the maximum difference is 0.9 percentage points), while in the Brazilian context difference is over double-digit percentage points (around 15 percentage points). In the Caribbean context, differences of these shares are on average around 5 percentage points between potential and active innovators. Therefore, this preliminary evidence suggests that financial obstacles seem to be much more relevant for Brazilian firms than in other parts of the world.
10
Table 4: Obstacles to Innovation (All Years)
Innovators Failed Innovators Innovation Active Potential Innovators Innovation Oriented
Excessive Economic Risks 19.7% 26.1% 20.0% 50.1% 24.8%
High Innovation Costs 21.7% 29.3% 22.1% 59.4% 28.0%
Scarcity of Financial Support 15.0% 19.5% 15.2% 36.7% 18.7%
Financial 31.1% 39.6% 31.5% 76.7% 38.7%
Shortage of Qualified
Workforce 10.9% 13.6% 11.1% 19.4% 12.4%
Lack of Information on
Technology 5.2% 6.6% 5.2% 8.2% 5.7%
Lack of Market Information 4.3% 5.8% 4.4% 6.3% 4.7%
Lack of Proper Technical
External Services 5.5% 7.1% 5.6% 9.3% 6.2%
Scarcity of Cooperation
Possibilities 5.6% 7.8% 5.7% 11.8% 6.7%
Knowledge 18.0% 23.1% 18.3% 32.5% 20.6%
Weak Consumer Demand 4.2% 4.8% 4.2% 10.0% 5.1%
Market 4.2% 4.8% 4.2% 10.0% 5.1%
Rigid Organization 4.8% 6.8% 4.9% 10.0% 5.8%
Centralization of Innovation in Another Firm within the Group
1.1% 1.2% 1.1% 3.4% 1.5%
Organizational 5.7% 7.5% 5.8% 12.8% 6.9%
Difficulties to Adapt to the
Norms and Standards 6.5% 8.7% 6.6% 12.7% 7.6%
Regulatory 6.5% 8.7% 6.6% 12.7% 7.6%
Total 37.4% 48.3% 37.9% 86.2% 45.6%
Regarding Cooperation, Table 5 shows the proportion of innovators and failed innovators (as well as the joint group, named active innovators) in each type of feasible cooperation.11 Overall, less than 1/5 of the active innovators has cooperated either with firms or with research institutions and related. However, most of this cooperation are made with other firms (16.9%) rather than with research institutions and related (7.1%). Moreover, the higher frequency of cooperation among all subcategories is with suppliers (around 10%), since it is in this type of cooperation which firms tend to have the more benefits as better inputs result in improvement in their productivity. Failed innovators tend to do less cooperation than innovators itself, which is consistent with the idea that successful ones are those that tend to find solutions outside of their own boundaries. Overall, our first descriptive statistics suggest that a positive association between cooperation and innovation exist.
11 Remembering that only innovators and failed innovators responded the issue of cooperation. All non-innovators do not cooperate, since they do not innovate.
11
Table 5: Cooperation (All Years)
Innovators Failed Innovators Innovation Active Clients or Consumers 9.5% 5.8% 9.3% Suppliers 10.8% 7.2% 10.6% Competitors 1.9% 0.5% 1.9%
Other Firms Within the Group 5.0% 2.6% 4.8%
Consultancy Firms 3.2% 2.3% 3.1%
Firms 17.1% 12.4% 16.9%
University and Research Institutes 4.6% 2.7% 4.5%
Technical Assistance and Centers of Professional Capacitation 2.4% 1.1% 2.3% Testing, Experiment and Certification Institutions 3.5% 1.3% 3.4%
Research Institutions and Related 7.2% 4.2% 7.1%
Total 18.6% 13.8% 18.4%
3. What Are the Determinants of Barriers to Innovation? 3.1. Empirical Strategy
To investigate this issue, we pursue two empirical strategies. First, we calculate binary correlations between obstacles and use them to delineate complementarities and to group obstacles. However, we must be cautious with this approach. Binary correlation does not imply causality between two obstacles: the relationship between them may be caused by of a third variable that simultaneously influences them.
For that reason, we follow (Galia and Legros 2004) by also implementing an econometric approach that permits us to explore the correlations between barriers, conditional on common explanatory variables. Therefore, a family of (multivariate) Probit models is estimated, as described below:
= 1 if
∗ = + > 0,
0 if ∗ = + ≤ 0, (1)
where = 1, … , represents the firm, = 1, … , the year and = 1, … , the type of obstacle to innovation. Moreover, B represents endogenous observable variables that indicates if a firm has faced relevant obstacles to innovation, B* is its respective latent variable, are an error term and X are exogenous covariates that includes size (number of employees), multinational status, sector, time and region dummies, export status, binary variables indicating whether firms belongs to a group, among others.
Once the obstacles are used as endogenous regressors in models of cooperation and innovation, for the sake of model identification, we need to include in (1) variables that explain the prevalence of barriers to innovation but not the choice to cooperate or to innovate (or the magnitude of innovation expenditures). For financial obstacles, we use collateral and profitability measures as instrumental variables [Savignac (2008) and Álvarez & Crespi (2015)]. For the remaining obstacles, we opt for using a kind of Hausman-type instruments: for a firm, we calculate the average of the prevalence of each Hausman-type of obstacle taken over all the other firms in the same sector, year and region. That is, for the firm the instrumental variables ( ) are defined as:
12
= ( − 1) , (2)
where = 1, … , denotes region, = 1, … , indicates sector, is the number of firms in the region r, sector s and year t. The remaining variables are defined as before.
Moreover, if there is unobservable heterogeneity between firms, endogeneity is a potential problem. If this unobserved heterogeneity is time-invariant, firm fixed effects can tackle this issue effectively in linear models. However, including firm fixed effects in non-linear models like (1) turn the estimates biased and inconsistent [Greene (2004)]. One possible strategy is estimating the model with random effects, but this option is inadequate if individual effects are correlated to the error term.
Considering that correlation between individual effects and errors exist, we can estimate the fixed effects as a function of the average (taken over time) of the individual variables and include these averages as additional covariates, as suggested in Zabel (1992). That is, the error term in (1) is defined as:
= + , (3)
where and is a multivariate normal distributed error term.
From (1) and (3) we can estimate (by a Probit) the impact of characteristics of firms on the prevalence of obstacles to innovation and, by calculating binary correlations between the disturbances terms ( ) for a distinct type of obstacles, explore more suitably the relationship between these barriers.
3.2. Results
(A) Correlations between Obstacles
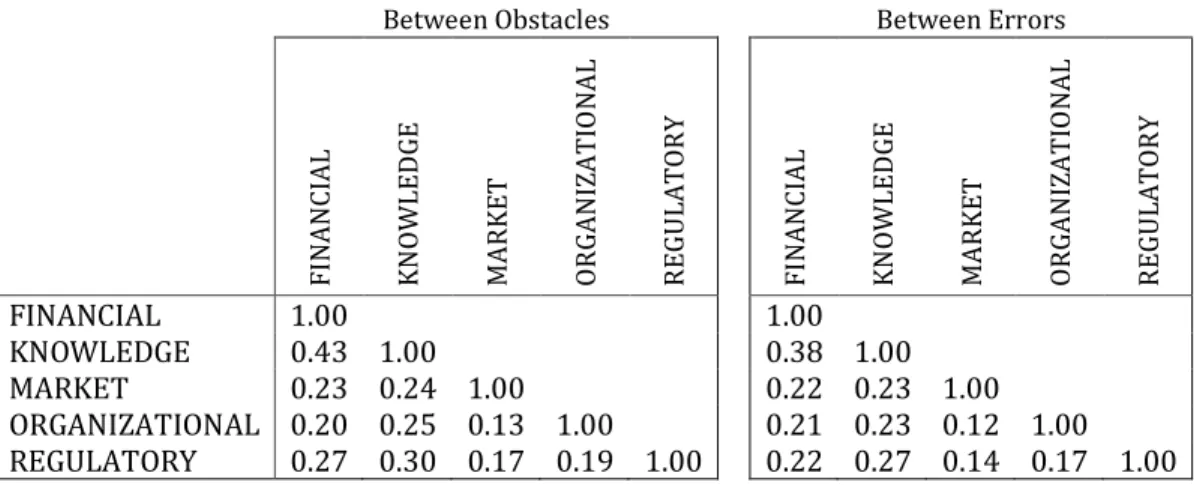
There is no substantial difference between the two kinds of correlations (between obstacles and between errors – see Table 6). That is, even controlling for the determinants of barriers to innovation, correlations between obstacles do not change too much. Basically, financial and knowledge obstacles are the most correlated (and more relevant – see Table 1) barriers.
Table 6: Some Correlations
Between Obstacles Between Errors
FI N ANCIAL KNOWLED GE MA R KET OR GANIZA TI O N AL R EGU LATOR Y FI N ANCIAL KNOWLED GE MA R KET OR GANIZA TI O N AL R EGU LATOR Y FINANCIAL 1.00 1.00 KNOWLEDGE 0.43 1.00 0.38 1.00 MARKET 0.23 0.24 1.00 0.22 0.23 1.00 ORGANIZATIONAL 0.20 0.25 0.13 1.00 0.21 0.23 0.12 1.00 REGULATORY 0.27 0.30 0.17 0.19 1.00 0.22 0.27 0.14 0.17 1.00 = −1 =1
13
(B) Determinants of Obstacles
Results are shown in Table 7-Table 8. First, there are no substantial changes when we included the Mundlak’s fixed effects to control for time-invariant unobserved heterogeneity. The marginal effects are quite the same.
Moreover, the instruments seem to work well, particularly the ones concerning market and regulatory obstacles. It makes sense, since these two barriers, differently from financial, knowledge and organizational obstacles, are external to the firms. So, we hope that instruments built as sector-year-region averages of barriers prevalence should be stronger for external barriers. In turn, the other financial obstacles instrumental variables – COLLATERAL – lost statistical significance when we included fixed effects.
Considering our favorite specification, the one estimated with fixed effects (see Table 8), we notice that multinationals face fewer obstlacles in total, which is mainly driven by financial, knowledge and regulatory obstacles. Exporters also face fewer regulatory obstacles: apparently, the contact with global market alleviate this type of barrier to innovation. Moreover, firms that take part of a group and multinationals faces more organizational obstacles. It makes sense, once they are more exposed to the situation where the foreign headquarter or the controller company decides to take investment in innovative activities abroad (or to another firm in the same group).
Furthermore, in comparison with 2003, controlled for other regressors, firms faced typically fewer obstacles in 2005. However, for the remaining years, firms experienced an important increase in barriers to innovation. These results deserve further investigation, but may reflect the deterioration of the macroeconomic and business environment that took place in the last ten years in Brazil [Canêdo-Pinheiro & Figueiredo (2017)].
14
Table 7: Determinants of Obstacles – Relevant Sample, No Fixed Effects (Margins)
Fi na nc ial K no wl edg e Marke t Org a ni zatio na l Regu lat ory T o ta l MULT -0.075***(0.010) -0.050***(0.009) (0.004)0.001 0.040***(0.005) -0.014**(0.006) -0.049***(0.010) GROUP (0.008)0.001 (0.007)-0.009 (0.004)0.002 0.021***(0.004) (0.004)-0.007 0.026***(0.008) SIZE (0.004)-0.002 -0.027***(0.002) -0.005***(0.001) -0.003**(0.001) -0.012***(0.002) (0.004)-0.001 EXPORT 0.012* -0.011* 0.001 -0.007* -0.007* 0.007 (0.007) (0.006) (0.003) (0.004) (0.004) (0.007) HUMAN CAPITAL (0.000)-0.000 -0.000*(0.000) (0.000)0.000 (0.000)0.000 (0.000)-0.000 (0.000)0.000 INFO -0.200***(0.017) 0.051***(0.013) (0.007)-0.001 (0.008)-0.008 0.026***(0.009) -0.228***(0.017) EBITDA 0.000 0.000 (0.000) (0.000) COLLATERAL -0.015***(0.003) -0.016***(0.003) IV-OBSTACLES (0.057)-0.078 IV-FINANCIAL (0.058)0.039 IV-KNOWLEDGE -0.086 (0.058) IV-MARKET 0.156***(0.047) IV-ORGANIZATIONAL (0.065)-0.035 IV-REGULATORY 0.112**(0.053) 2005 -0.081***(0.009) -0.033***(0.007) (0.004)-0.001 (0.004)-0.001 -0.009**(0.004) -0.086***(0.010) 2008 0.025**(0.010) 0.063***(0.008) 0.009**(0.004) 0.028***(0.004) 0.011**(0.005) 0.064***(0.010) 2011 0.012 0.119*** 0.026*** 0.047*** 0.030*** 0.043*** (0.010) (0.009) (0.004) (0.005) (0.005) (0.010) 2014 0.075*** 0.092*** 0.030*** 0.052*** 0.046*** 0.091*** (0.011) (0.009) (0.005) (0.006) (0.006) (0.011) Fixed Effects No No No No No No
Constant, region and sector marginal effects were omitted for convenience. In parentheses the standard deviation, clustered with respect to firms. The symbols *, ** and *** indicate significance at 10%, 5% and 1%, respectively.
15
Table 8: Determinants of Obstacles – Relevant Sample, Fixed Effects (Margins)
Fi na nc ial K no wl edg e Marke t Org a ni zatio na l Regu lat ory T o ta l MULT -0.072***(0.011) -0.047***(0.009) (0.005)0.003 0.040***(0.005) -0.013**(0.006) -0.047***(0.011) GROUP (0.008)0.002 (0.007)-0.009 (0.004)0.003 0.021***(0.004) (0.004)-0.006 0.027***(0.008) SIZE (0.009)-0.012 -0.020***(0.006) (0.003)-0.003 (0.004)-0.001 (0.004)-0.005 (0.009)-0.006 EXPORT 0.002 0.003 0.006 -0.002 -0.013* -0.002 (0.014) (0.012) (0.007) (0.007) (0.008) (0.014) HUMAN CAPITAL (0.000)0.000 (0.000)0.000 0.000***(0.000) (0.000)0.000 (0.000)0.000* (0.000)0.000 INFO -0.189***(0.023) (0.019)0.031 (0.011)0.009 (0.012)0.004 0.034***(0.012) -0.221***(0.023) EBITDA 0.000 0.000 (0.000) (0.000) COLLATERAL (0.005)0.005 (0.005)0.001 IV-OBSTACLES (0.057)-0.081 IV-FINANCIAL (0.058)0.034 IV-KNOWLEDGE -0.087 (0.058) IV-MARKET 0.155***(0.047) IV-ORGANIZATIONAL (0.065)-0.035 IV-REGULATORY 0.109**(0.053) 2005 -0.085***(0.010) -0.034***(0.007) (0.004)-0.002 (0.004)-0.002 -0.010**(0.004) -0.089***(0.010) 2008 (0.010)0.017* 0.062***(0.008) 0.009**(0.004) 0.028***(0.004) (0.005)0.009* 0.056***(0.010) 2011 -0.001 0.114*** 0.025*** 0.046*** 0.027*** 0.031*** (0.011) (0.009) (0.005) (0.005) (0.005) (0.011) 2014 0.059*** 0.086*** 0.028*** 0.051*** 0.042*** 0.075*** (0.012) (0.009) (0.005) (0.006) (0.006) (0.013)
Fixed Effects Yes Yes Yes Yes Yes Yes
Constant, region and sector marginal effects were omitted for convenience. In parentheses the standard deviation, clustered with respect to firms. The symbols *, ** and *** indicate significance at 10%, 5% and 1%, respectively.
16
4. Do Obstacles to Innovation Induces Cooperation? 4.1. Empirical Strategy
Following Antonioli et al. (2016), we answer this question by estimating the model:
= ⎩ ⎪ ⎪ ⎨ ⎪ ⎪ ⎧ 1 if ∗ = + + > 0, 0 if ∗ = + + ≤ 0, (4)
where = 1, … , represents the type of cooperation, C is a binary variable assuming value of one when a certain type of cooperation occurs, are controls (basically the same variables of section 3), is the random error term and the other variables are defined as before.
As in section 3, model (4) is estimated as a (multivariate) Probit model and the same procedure to deal with fixed effects on nonlinear models is adopted. However, in this case, we apply the instrumentation and the panel fixed effects strategy one at a time. That is, we estimate models with fixed effects and B as covariates, and models with no fixed effects and
as regressors.
Moreover, once the question about cooperation is solely made to innovation-active firms, at first it would be only feasible to investigate if cooperation is impacted by barriers that affect innovation intensity (but not the propensity to innovate). To deal with this problem we imputed a zero value on cooperation variable (C) for non-innovation oriented firms. We are comfortable with this strategy, once it makes sense for firms not interested in innovation activities not to be interested in cooperation to innovate. In any case, we estimate the same models without the imputation and the results do not change substantially.
Notice that, with the normality assumption, and once B is a dummy variable, we only need one varying exogenous regressor in each of the K equations to guarantee the identification [Wilde (2000)]. However, if we depart from normality assumption, the identification is not guaranteed and may be useful to rely on instruments to deal with this issue. For this reason, in (4), instead of B, we use its predicted values obtained from model (1). Remember that model (1) includes regressors ( , COLLATERAL and EBITDA – the instruments) that are not included in Q.
4.2. Results
Results are shown in Table 9. For each kind of cooperation (with firms and with research institutions and related) and for cooperation at all, we estimate three versions of model (4): (a) with no fixed effects and observed values of barriers; (b) with fixed effects and observed values of barriers; (c) with no fixed effects and predicted values of barriers. That is, altogether we estimated nine different models on cooperation.
Considers the first specification (no fixed effects and observed values of barriers – models A1 to A3). Financial, knowledge and organizational barriers reduce the probability of collaboration in innovation activities. However, results change when we look at cooperation with specific partners. Organizational and regulatory barriers cause companies to cooperate more with research institutions. This seems to indicate that cooperation is a way for companies to circumvent these types of barriers to innovation. On the other hand, financial reduce the likelihood of cooperation with research institutions. Financial,
17
organizational and regulatory obstacles reduce collaboration with other firms. It is interesting that when we control for non-observable firm effects (models B1 to B3), results remain qualitatively similar (same significant parameters).
Controlling for endogeneity on obstacles to innovations (models C1 to C3), some outcomes change significance and interpretation.12 Nevertheless, financial barriers continue negative, regardless which type of institution is considered. Organizational also remains negative for cooperation in general and with firms, yet its positive association with research institutions shifts to non-significant. All other outcomes with knowledge and regulatory barriers lost statistical significance, but knowledge obstacles effect became positive for cooperation with research institutions. That is, firms seem to look for partnerships with universities and research labs to mitigate knowledge barriers to innovation activities.
Outcomes for other variables also differ between models A and B to C. As Multinational, larger and information sources are positively related to cooperation in general in models A and B, only information sources remain positive for model C. Moreover, multinational status seems to boost cooperation with other firms and deter cooperation with research institutes and related when models A and B are considered. Group status only affects (positively) the propensity to collaborate with firms (Models A and C). In turn, size seems to boost cooperation, but this effect vanishes when using predicted barriers as regressors.
We are also interested in evaluating the potentially distinct impact of barriers to innovation on small (less than 100 employees) and large companies (100 or more employees). To do so, we estimated the nine versions of the model (4) using small and large firm subsamples. Results are shown in Table 10 and Table 11 and are not quite different from the whole relevant sample models. Again, financial and organizational barriers tend to reduce cooperation in general and with firms, but not significant with research institutions for large firms. Regarding other barriers, outcomes differ between large and small firms. For instance, market obstacles become negatively related to cooperation for large firms, especially in cooperation with firms, in Models A and B. While for small firms, regulatory obstacles do not deter or boost cooperation, as oppose to some outcomes for all and large firms.
Overall, our outcomes suggest that among all obstacles investigated in this research, financial barriers present the most robust result across all specifications. Therefore, removing financial constraints enables firms to cooperate with research institutions and other firms, especially with the last one as results are larger in magnitude and more robust.
12 Notice that the incremental effects of the barriers on models (A1)-(A3) and (B1-B3) are not directly
comparable with marginal effects on models (C1)-(C3). The first ones are calculated as the impact of a discrete variation (from 0 to 1) and the latter refers to infinitesimal changes.
18
Table 9: Determinants of Cooperation – Relevant Sample (Margins)
Constant, region and sector effects were omitted for convenience. In parentheses, the standard deviation, clustered with respect to firms. The symbols *, ** and *** indicate significance at 10%, 5% and 1%, respectively.
(A1) (A2) (A3) (B1) (B2) (B3) (C1) (C2) (C3)
With Firms
With Research Institutions and
Related
Total With Firms Institutions and With Research Related
Total With Firms
With Research Institutions and Related Total MULT 0.072***(0.012) -0.046***(0.010) 0.042***(0.010) 0.068***(0.012) -0.045***(0.010) 0.040***(0.011) (0.040)0.066 -0.077***(0.030) (0.035)0.022 GROUP 0.018* 0.000 0.002 0.015 0.000 0.002 0.068*** 0.015 0.037** (0.010) (0.008) (0.009) (0.010) (0.008) (0.009) (0.018) (0.014) (0.017) SIZE 0.020***(0.003) 0.012***(0.003) 0.019***(0.003) (0.009)0.007 0.025***(0.009) 0.018**(0.008) (0.013)0.004 (0.010)0.001 (0.012)0.008 EXPORT (0.009)0.001 0.027***(0.008) (0.008)0.010 (0.018)0.004 0.043***(0.014) (0.016)0.021 (0.012)0.004 0.033***(0.010) (0.011)0.014 HUMAN CAPITAL (0.000)0.000 0.000***(0.000) (0.000)0.000 (0.000)-0.000 (0.000)0.000 (0.000)-0.000 (0.000)0.000* (0.000)0.000** (0.000)0.000* INFO 1.082*** 0.658*** 1.231*** 0.983*** 0.569*** 1.124*** 0.826*** -1.056*** 1.063*** (0.018) (0.012) (0.018) (0.032) (0.020) (0.031) (0.061) (0.212) (0.056) FINANCIAL -0.109***(0.008) -0.013*(0.007) -0.092***(0.007) -0.107***(0.008) (0.007)-0.012* -0.091***(0.007) -1.606***(0.242) -1.056***(0.212) -1.379***(0.201) KNOWLEDGE (0.008)-0.008 (0.008)0.004 -0.019***(0.007) (0.008)-0.009 (0.008)0.002 -0.019***(0.007) (0.424)0.359 (0.347)0.573* (0.369)0.430 MARKET -0.013 -0.013 -0.010 -0.013 -0.013 -0.010 -0.111 -0.333 0.136 (0.012) (0.013) (0.010) (0.012) (0.013) (0.010) (0.477) (0.608) (0.341) ORGANIZATIONAL -0.041***(0.011) 0.020**(0.010) -0.031***(0.009) -0.041***(0.011) 0.021**(0.010) -0.030***(0.009) -1.704***(0.635) (0.490)-0.617 -1.173*(0.616) REGULATORY -0.019*(0.012) (0.010)0.018* (0.009)-0.001 (0.012)-0.019* (0.010)0.018* (0.010)-0.002 (0.473)0.645 (0.377)-0.365 (0.411)0.203
Fixed Effects No No No Yes Yes Yes No No No
19
Table 10: Determinants of Cooperation – Relevant Sample, Large Firms (Margins)
Constant, region and sector effects were omitted for convenience. In parentheses, the standard deviation, clustered with respect to firms. The symbols *, ** and *** indicate significance at 10%, 5% and 1%, respectively.
(A1) (A2) (A3) (B1) (B2) (B3) (C1) (C2) (C3)
With Firms
With Research Institutions and
Related
Total With Firms Institutions and With Research Related
Total With Firms
With Research Institutions and Related Total MULT 0.086***(0.015) -0.055***(0.014) 0.046***(0.014) 0.083***(0.016) -0.053***(0.014) 0.044***(0.014) (0.052)0.051 (0.044)-0.045 (0.046)0.005 GROUP 0.022* 0.003 0.006 0.020 0.002 0.006 0.067*** 0.020 0.030 (0.013) (0.011) (0.012) (0.013) (0.011) (0.012) (0.024) (0.020) (0.022) SIZE 0.019***(0.007) (0.006)0.011* 0.019***(0.007) (0.015)0.024 0.032**(0.013) 0.031***(0.012) (0.016)0.014 0.038***(0.013) 0.036**(0.014) EXPORT (0.012)-0.012 0.035***(0.012) (0.011)0.003 (0.024)-0.007 0.052**(0.021) (0.020)0.010 (0.016)-0.001 0.039***(0.015) (0.014)0.013 HUMAN CAPITAL (0.000)0.000 0.000***(0.000) 0.000**(0.000) (0.000)-0.000 (0.000)0.000 (0.000)0.000 (0.000)0.000 0.000***(0.000) (0.000)0.000 INFO 1.117*** 0.782*** 1.266*** 1.093*** 0.690*** 1.204*** 1.173*** 0.630*** 1.264*** (0.028) (0.019) (0.030) (0.041) (0.028) (0.042) (0.089) (0.072) (0.084) FINANCIAL -0.104***(0.011) (0.011)-0.009 -0.096***(0.010) -0.103***(0.011) (0.011)-0.009 -0.095***(0.010) -1.226***(0.326) -0.780**(0.309) -1.208***(0.265) KNOWLEDGE (0.014)-0.003 (0.013)0.002 (0.012)-0.017 (0.014)-0.003 (0.013)-0.000 (0.012)-0.018 (0.803)-0.845 1.600***(0.620) (0.723)0.593 MARKET -0.043** -0.027 -0.032* -0.042** -0.026 -0.031* -0.828 -0.056 -0.306 (0.020) (0.023) (0.017) (0.020) (0.023) (0.017) (0.974) (0.671) (0.694) ORGANIZATIONAL -0.043***(0.016) (0.016)0.023 -0.028**(0.014) -0.043***(0.016) (0.016)0.026 -0.027**(0.014) -1.984**(0.937) (0.752)-0.230 (0.917)-0.664 REGULATORY (0.019)-0.022 0.049***(0.017) (0.016)0.010 (0.019)-0.023 0.049***(0.017) (0.017)0.010 (0.860)-0.110 (0.582)-0.887 (0.727)-0.940
Fixed Effects No No No Yes Yes Yes No No No
20
Table 11: Determinants of Cooperation – Relevant Sample, Small Firms (Margins)
Constant, region and sector effects were omitted for convenience. In parentheses, the standard deviation, clustered with respect to firms. The symbols *, ** and *** indicate significance at 10%, 5% and 1%, respectively.
(A1) (A2) (A3) (B1) (B2) (B3) (C1) (C2) (C3)
With Firms
With Research Institutions and
Related
Total With Firms Institutions and With Research Related
Total With Firms
With Research Institutions and Related Total MULT 0.047***(0.018) -0.056***(0.015) 0.034**(0.016) 0.042**(0.018) -0.054***(0.015) 0.035**(0.016) 0.175***(0.060) -0.107**(0.048) (0.048)0.090* GROUP 0.009 -0.002 -0.006 0.008 -0.002 -0.005 0.075*** -0.009 0.031 (0.014) (0.010) (0.013) (0.014) (0.010) (0.012) (0.027) (0.020) (0.023) SIZE (0.007)0.011 (0.006)0.010 0.015**(0.006) (0.011)-0.011 (0.013)0.008 (0.010)0.003 (0.032)-0.026 (0.023)-0.019 (0.027)-0.015 EXPORT (0.012)0.013 0.019**(0.009) (0.010)0.012 (0.028)0.011 (0.019)0.035* (0.025)0.038 (0.022)0.012 (0.016)0.018 (0.018)0.010 HUMAN CAPITAL (0.000)0.000 (0.000)0.000 (0.000)0.000 (0.000)-0.000 (0.000)0.000 (0.000)0.000 (0.000)0.000** (0.000)-0.000 (0.000)0.000 INFO 0.948*** 0.487*** 1.074*** 0.808*** 0.458*** 0.988*** 0.651*** 0.239*** 0.937*** (0.021) (0.014) (0.022) (0.045) (0.028) (0.042) (0.117) (0.084) (0.100) FINANCIAL -0.098***(0.010) (0.008)-0.010 -0.072***(0.008) -0.096***(0.010) (0.008)-0.010 -0.071***(0.008) -1.211***(0.319) -0.800***(0.242) -0.891***(0.275) KNOWLEDGE (0.009)-0.008 (0.008)0.006 -0.016**(0.008) (0.009)-0.008 (0.008)0.005 -0.016**(0.008) (0.564)1.244** (0.469)-0.044 (0.484)0.654 MARKET 0.011 -0.001 0.005 0.010 -0.001 0.005 0.045 -0.028 0.456 (0.014) (0.013) (0.011) (0.013) (0.013) (0.011) (0.946) (0.844) (0.894) ORGANIZATIONAL -0.043***(0.014) (0.010)0.015 -0.036***(0.011) -0.043***(0.013) (0.010)0.016 -0.036***(0.011) -2.583***(0.660) (0.546)-0.093 -1.620***(0.565) REGULATORY (0.013)-0.009 (0.011)-0.010 (0.010)-0.001 (0.013)-0.010 (0.011)-0.010 (0.010)-0.001 (0.603)-0.052 (0.476)0.581 (0.490)-0.112
Fixed Effects No No No Yes Yes Yes No No No
21
5. Barriers to Innovation, Innovative Activities, and Innovation Outputs 5.1. Empirical Strategy
To investigate whether these barriers affect innovation inputs and outputs, we opt to estimate the model in two stages as suggested by Crespi & Zuniga (2012) and Mohan et al. (2017). This method is an adaptation form the CDM model [Crépon et al. (1998)].
(A) First Stage
The first stage is a system with two equations which models jointly the decision to engage in innovation activities as well as how much should be invested in these activities. The first equation of this stage is:
∗ = + + , (5)
where IE* is the non-observed measure of the desired innovation effort, Z are the determinants of this effort, are the predicted obstacles from model (1), and ε is the random error term.
The second equation is a function considering whether a firm has decided to engage in innovation activities. In other words, it assumes value one if the firm has made an innovative activity and zero otherwise:
= 1 if
∗ = + + > ,
0 if ∗ = + + ≤ , (6)
where ID is an endogenous observable variable that indicates if a firm has invested or not in innovative activities, ID* is the latent variable indicating that investments in innovation are made if the value is above a determined level c, W are the determinants on their decision to invest in innovation, and is the random error term. The remaining variables are defined as previously.
Combining (5) and (6), we end up in equation (7):
=
∗ = + + if = 1,
0 if = 0, (7) where IE is the observable innovation effort made by the firm and the other variables are defined as before. We need an exclusion restriction to identify the model. Particularly, we included the variable SIZE on equation (6), but not in (5).
The additional hypothesis is that and have a multivariate Normal distribution so that the system of equations formed by (5) and (6) can be estimated as a (Type 2) Tobit. Once B is endogenous in (5) and (6), it is replaced for its predicted counterpart ( ). Furthermore, fixed effects are defined as in equation (2). Again, as in section 4, we do not apply the instrumentation and the panel fixed effects strategy simultaneously.
The database allows us to estimate the model above for different types of innovative activities. Therefore, it is feasible to evaluate, for instance, if the obstacles affect different distinct innovation activities, such as R&D (internal and external) and acquisition of equipment and machines.
22
(B) Second Stage
The second stage of our empirical strategy is an equation that relates innovative activities (inputs) to what eventually is observed in terms of innovation (outcomes):
= ∗ + + + , (8)
where TI is a dummy (observable) variable which assumes value one if the firm has innovated and zero otherwise, ∗ is the latent innovative effort predicted in the first stage,
V are the determinants of TI, and u is the random error term. The remaining variables are defined as previously. The equation (8) is estimated as a Probit.
The innovative effort may be an endogenous variable in equation (8). To correct for this shortcoming, instead of using the observable innovation efforts values (IE), we may use the predicted values of this variable obtained in the first stage ( ∗). Analogous rationale holds
for barriers to innovation. Moreover, fixed effects are defined as in equation (2), but not implemented together with the instrumental variable strategy.
5.2. Results
(A) Propensity to Invest in Innovative Activities (Selection Equation)
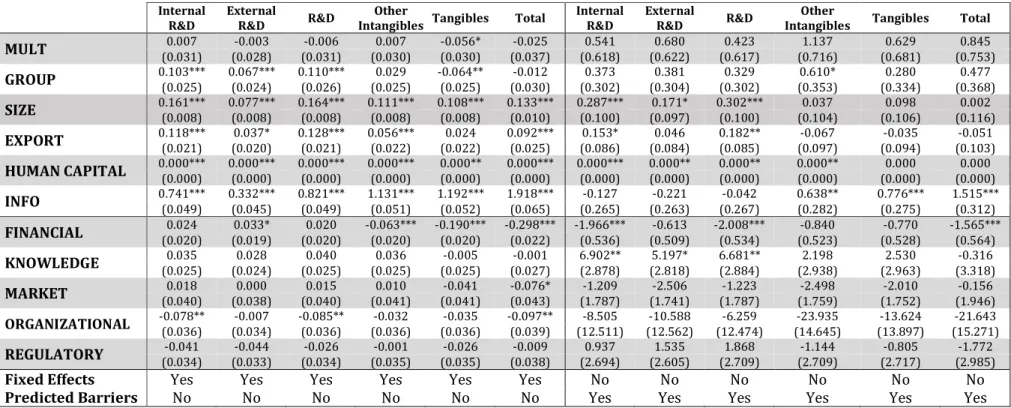
The results are shown in Table 12.13 When we use observed barriers regressors with fixed effects, we observe that financial, market and organizational are negative associated with the propensity to innovate (Total). When looking at different types of innovation inputs, only few items present parameters statistically significant. For instance, financial barriers tend to deter the propensity to spend on tangibles and other intangibles, while organizational hampers R&D, driven by internal R&D.
In turn, when we replace observed obstacles by their predicted counterpart, most of the estimates become non-significant, apart from financial barriers. Financial obstacles have a negative and statistically significant impact on the propensity to invest in innovative activities in general as when using observed obstacles. However, the impact shifts to R&D and internal R&D, instead of other intangibles or tangibles when using observed barriers. Therefore, those results are only robust for financial obstacles hampering firms to innovate, regardless of the inclusion of Mundlak’s fixed effects or the use of predicted values of barriers.
The results change a little in qualitative terms when we discriminate between large and small firms (Table 13 and Table 14). Financial obstacles remain as an important deterring barrier both to small and large firms, but results are more robust for large firms. The negative (and significant) impact on the propensity to innovate from organizational barriers shows up only on small firms when using fixed effects, but it does not remain when using predicted values of barriers, which prevent us to make any claim on these outcomes, as they do not seem robust across specifications. Market barriers also present some negative parameters, but they are not robust across specifications either.
13 Outcomes using observed barriers without fixed effects for the propensity of innovation inputs are presented in Appendix C.
23
Table 12: Determinants of Innovation Activities (Propensity) – Relevant Sample (Margins)
Internal R&D
External
R&D R&D
Other
Intangibles Tangibles Total
Internal R&D
External
R&D R&D
Other
Intangibles Tangibles Total
MULT (0.031) 0.007 (0.028) -0.003 (0.031) -0.006 (0.030) 0.007 -0.056* (0.030) (0.037) -0.025 (0.618) 0.541 (0.622) 0.680 (0.617) 0.423 (0.716) 1.137 (0.681) 0.629 (0.753) 0.845 GROUP 0.103*** (0.025) 0.067*** (0.024) 0.110*** (0.026) (0.025) 0.029 -0.064** (0.025) (0.030) -0.012 (0.302) 0.373 (0.304) 0.381 (0.302) 0.329 (0.353) 0.610* (0.334) 0.280 (0.368) 0.477 SIZE 0.161*** (0.008) 0.077*** (0.008) 0.164*** (0.008) 0.111*** (0.008) 0.108*** (0.008) 0.133*** (0.010) 0.287*** (0.100) (0.097) 0.171* 0.302*** (0.100) (0.104) 0.037 (0.106) 0.098 (0.116) 0.002 EXPORT 0.118*** (0.021) (0.020) 0.037* 0.128*** (0.021) 0.056*** (0.022) (0.022) 0.024 0.092*** (0.025) (0.086) 0.153* (0.084) 0.046 (0.085) 0.182** (0.097) -0.067 (0.094) -0.035 (0.103) -0.051 HUMAN CAPITAL 0.000*** (0.000) 0.000*** (0.000) 0.000*** (0.000) 0.000*** (0.000) 0.000** (0.000) 0.000*** (0.000) 0.000*** (0.000) 0.000** (0.000) (0.000) 0.000** 0.000** (0.000) (0.000) 0.000 (0.000) 0.000 INFO 0.741*** (0.049) 0.332*** (0.045) 0.821*** (0.049) 1.131*** (0.051) 1.192*** (0.052) 1.918*** (0.065) (0.265) -0.127 (0.263) -0.221 (0.267) -0.042 0.638** (0.282) 0.776*** (0.275) 1.515*** (0.312) FINANCIAL (0.020) 0.024 (0.019) 0.033* (0.020) 0.020 -0.063*** (0.020) -0.190*** (0.020) -0.298*** (0.022) -1.966*** (0.536) (0.509) -0.613 -2.008*** (0.534) (0.523) -0.840 (0.528) -0.770 -1.565*** (0.564) KNOWLEDGE (0.025) 0.035 (0.024) 0.028 (0.025) 0.040 (0.025) 0.036 (0.025) -0.005 (0.027) -0.001 6.902** (2.878) (2.818) 5.197* (2.884) 6.681** (2.938) 2.198 (2.963) 2.530 (3.318) -0.316 MARKET (0.040) 0.018 (0.038) 0.000 (0.040) 0.015 (0.041) 0.010 (0.041) -0.041 (0.043) -0.076* (1.787) -1.209 (1.741) -2.506 (1.787) -1.223 (1.759) -2.498 (1.752) -2.010 (1.946) -0.156 ORGANIZATIONAL -0.078** (0.036) (0.034) -0.007 -0.085** (0.036) (0.036) -0.032 (0.036) -0.035 -0.097** (0.039) (12.511) -8.505 (12.562) -10.588 (12.474) -6.259 (14.645) -23.935 (13.897) -13.624 (15.271) -21.643 REGULATORY (0.034) -0.041 (0.033) -0.044 (0.034) -0.026 (0.035) -0.001 (0.035) -0.026 (0.038) -0.009 (2.694) 0.937 (2.605) 1.535 (2.709) 1.868 (2.709) -1.144 (2.717) -0.805 (2.985) -1.772
Fixed Effects Yes Yes Yes Yes Yes Yes No No No No No No
Predicted Barriers No No No No No No Yes Yes Yes Yes Yes Yes
Constant, region, sector and year effects were omitted for convenience. In parentheses the standard deviation, clustered with respect to firms. The symbols *, ** and *** indicate significance at 10%, 5% and 1%, respectively.
24
Table 13: Determinants of Innovation Activities (Propensity) – Relevant Sample, Small Firms (Margins)
Internal R&D
External
R&D R&D
Other
Intangibles Tangibles Total
Internal R&D
External
R&D R&D
Other
Intangibles Tangibles Total
MULT (0.054) -0.012 (0.052) 0.001 (0.054) -0.039 (0.055) 0.041 (0.056) -0.022 (0.063) -0.039 (0.385) 0.124 (0.376) 0.526 (0.385) 0.079 (0.385) 0.575 (0.406) 0.301 (0.446) -0.061 GROUP (0.043) 0.077* (0.042) 0.070* 0.095** (0.043) (0.043) 0.014 (0.043) -0.040 (0.048) -0.023 (0.174) 0.142 (0.170) 0.283* (0.174) 0.150 (0.176) 0.249 (0.184) 0.091 (0.201) -0.001 SIZE 0.059*** (0.020) (0.020) 0.012 0.060*** (0.020) 0.091*** (0.020) 0.139*** (0.020) 0.139*** (0.021) (0.154) 0.021 (0.151) 0.147 (0.154) 0.065 (0.159) 0.058 (0.159) 0.202 (0.175) 0.056 EXPORT 0.148*** (0.032) (0.031) 0.045 0.157*** (0.032) (0.033) 0.057* (0.033) 0.047 0.112*** (0.036) (0.095) 0.183* (0.093) 0.119 (0.095) 0.215** (0.100) 0.022 (0.099) 0.062 (0.109) 0.059 HUMAN CAPITAL 0.000*** (0.000) 0.000*** (0.000) 0.000*** (0.000) 0.000*** (0.000) 0.000*** (0.000) 0.000*** (0.000) 0.000*** (0.000) 0.000*** (0.000) 0.000*** (0.000) (0.000) 0.000** (0.000) 0.000* (0.000) 0.000 INFO 0.609*** (0.069) 0.204*** (0.067) 0.687*** (0.070) 1.175*** (0.075) 1.283*** (0.080) 1.971*** (0.100) (0.309) -0.068 (0.304) 0.086 (0.308) 0.076 0.892*** (0.309) 1.149*** (0.320) 1.645*** (0.337) FINANCIAL (0.027) 0.040 0.054** (0.027) (0.027) 0.042 -0.079*** (0.027) -0.233*** (0.028) -0.299*** (0.029) -1.620** (0.780) (0.770) 0.188 (0.776) -1.514* (0.768) -0.361 (0.804) -0.177 (0.808) -1.301 KNOWLEDGE (0.032) 0.048 (0.032) 0.022 (0.032) 0.051 0.077** (0.032) (0.033) 0.021 (0.034) 0.024 (3.037) 4.437 (2.969) 5.367* (3.032) 4.694 (3.056) 2.279 (3.060) 2.902 (3.367) -0.460 MARKET (0.053) 0.006 (0.052) -0.019 (0.053) 0.002 (0.054) -0.023 (0.052) -0.073 (0.056) -0.100* (4.038) -0.661 (3.979) -1.223 (4.046) 0.129 (3.913) -0.008 (4.020) 3.954 (4.515) 7.373 ORGANIZATIONAL -0.117** (0.050) -0.086* (0.049) -0.135*** (0.050) (0.050) -0.077 -0.086* (0.050) -0.109** (0.052) (5.440) -2.961 (5.318) -5.037 (5.443) -2.135 (5.654) -8.864 (5.831) -5.190 (6.370) -4.183 REGULATORY (0.044) -0.024 (0.044) -0.018 (0.044) -0.006 (0.045) 0.019 (0.045) 0.020 (0.047) 0.023 (3.374) -3.992 (3.322) -1.088 (3.372) -3.237 (3.387) -2.043 (3.375) -3.514 (3.619) -3.979
Fixed Effects Yes Yes Yes Yes Yes Yes No No No No No No
Predicted Barriers No No No No No No Yes Yes Yes Yes Yes Yes
Constant, region, sector and year effects were omitted for convenience. In parentheses the standard deviation, clustered with respect to firms. The symbols *, ** and *** indicate significance at 10%, 5% and 1%, respectively.