The impact of alliances and internal R&D on the firm’s
innovation and financial performance
Fábio de Oliveira Paula 1,†
1 Pontifícia Universidade Católica, Rio de Janeiro, RJ, Brazil Jorge Ferreira da Silva 2,Ω
2 Pontifícia Universidade Católica, Rio de Janeiro, RJ, Brazil
1. INTRODUCTION
The positive influence of the innovation performance on a firm’s financial performance is extensively studied (CHENG; HUIZINGH, 2014; FAEMS; VAN LOOY; DEBACKERE, 2005). In addition to the impact on financial performance, innovation is essential for the firm’s survival in today’s uncertain environment (TEECE, 2007). Concurrently, with the approach of the relationship between innovation and firm’s performance, research has emerged examining internal and external sources of innovation (FRENZ; IETTO-GILLIES, 2009). Internal sources come mainly from R&D inside the boundaries of the organization. On the other hand, external sources can be innovations acquired from other firms, merges, acquisitions and collaboration with other players in the industry (CHESBROUGH, 2003; FAEMS, 2005).
We find that the relationship between internal R&D and innovation performance is positive in many studies (BELUSSI; SAMMARRA; SEDITAB, 2010; FAEMS, 2005), although it is dependent on the firm’s
Corresponding author:
† Pontifícia Universidade Católica, Rio de Janeiro, RJ, Brazil.
E-mail: [email protected]
Ω Pontifícia Universidade Católica, Rio de Janeiro, RJ, Brazil.
E-mail: [email protected]
Received: 10/18/2017. Revised: 02/06/2018 Accepted: 03/01/2018 Published Online: 07/24/2018
DOI: http://dx.doi.org/10.15728/bbr.2018.15.6.2
ABSTRACT
This paper intends to understand the relationships among internal and external R&D, innovation performance and financial performance in Brazilian manufacturing firms by testing a model using data from 2,810 firms. The study achieves this objective. We detected a positive relationship between external R&D from strategic alliances and innovation performance. Internal R&D, on the other hand, did not influence innovation performance directly; however, it positively moderated the relationship between strategic alliances and innovation performance, corroborating with the absorptive capacity theory. Contrary to our expectations, innovation performance had a negative influence on future financial performance. This was caused by the two-year lag between the measurement of the proxies of these two constructs, which was not long enough to allow identifying an increasing in revenues from new products and services. However, it captured the negative effect of redirecting marketing and sales resources for innovation activities, such as internal R&D, and of management costs of strategic alliances.
Keywords: Innovation Performance, Internal R&D, External R&D, Financial Performance, Manufacturing Firms.
BBR
15,6
534
structure (ARORA; BELEZON; RIOS, 2014) and on the type of knowledge developed (PÉREZ-LUNO; MEDINA; LAVADO; RODRIGUEZ, 2011). The influence of external sources on innovation performance presents several contingencies such as the type of partner (CHATTERJI; FABRIZIO, 2014; SOH; SUBRAMANIAN, 2014), the type of knowledge pursued (PÉREZ-LUNO et al. 2011) and the absorptive capacity of the firm (COHEN; LEVINTHAL, 1990). As absorptive capacity rises with higher levels of internal R&D (COHEN; LEVINTHAL, 1990; TSAI, 2009), internal and external R&D may be positively related. In contrast, some papers found a relationship of substitutability between them (HAGEDOORN; WANG, 2012).
Another relevant factor for innovation success is the environment, beginning with the country. The innovation process and the accumulation of technological capabilities for innovation development occurs in a different manner in developing countries compared to developed economies (CHOUNG; HWANG; SONG, 2014; FIGUEIREDO, 2016; KIM, 1997). According to Nelson (1993), the National System of Innovation (NSI) determines the innovative performance of national firms. Brazil occupies the 69th position in the 2016 ranking of the most innovative countries according to the Global Innovation Index (DUTTA; LAVIN; WUNSCH-VINCENT, 2016). In contrast, European countries dominate the top positions of the list, with four of the top five countries of the ranking, and 15 countries among the 25 most innovative. In addition to Brazil’s unenthusiastic position, when it comes to transforming the innovative capacity into financial results, Brazilian firms fail, even in comparison with neighbours of South America (INFOMONEY, 2015). This reality requires Brazilian firms to make enormous efforts to achieve positive results. In order to try to find lessons on how Brazilian manufacturing firms may improve its innovation and financial performance, we propose the following research question: How do internal R&D and external R&D (from strategic alliances) influence innovation performance and how can innovation have a positive impact on a firm’s performance in the context of the Brazilian manufacturing firms?
To answer the proposed question and building on the literature mentioned above, we propose a theoretical model which investigates the relationship among internal R&D, external R&D (strategic alliances), innovation performance, and financial performance of firms. The model is operationalized for Brazilian manufacturing firms using PINTEC 2011 (Innovation Survey) and PIA 2009 to 2013 (Annual Industrial Survey) databases, conducted by IBGE (Brazilian Institute of Geography and Statistics). Other research projects are also testing this model, with some adaptations, for other regions and industries, using different databases.
The remainder of the paper consists of the literature review, where we formulate the hypotheses and present the proposed model. Henceforth, we present the methodology, which includes the description of the data and the explanation of the sample selection, a description of the variables and the statistical method. Then, we describe the results and discuss them. Subsequently, we present the conclusion, containing the implications for academics and practitioners, the limitations and some suggestions for future research.
2. LITERATURE REVIEW
BBR
15,6
535
some elements of the firm’s characteristics as far as it defines the sources from where the firm will acquire or develop knowledge to generate innovation. Therefore, the choice of R&D sources, both internal and external, is central for the firm’s IP, as well as IP is central for the firm’s financial performance.
2.1. External R&D and IP
Strategic alliances represent important external sources of R&D. We can use alliances can to develop open innovation, which according to Chesbrough, is ‘the use of internal and external flows of knowledge to accelerate internal innovation and expand markets for external use of the innovation, respectively’ (CHESBROUGH, 2003). The reasons to invest in innovative collaboration are diverse, such as access to complementary assets, transference of tacit and codified knowledge and sharing of R&D costs (FAEMS et al., 2005). We find positive relationship between external sources of R&D and IP in various empirical studies (e.g., BELUSSI et al. 2010). Some researchers also found an inverted U-shape relationship (DUYSTERS; LOKSHIN, 2011) between them. The positive relationship inverts with high levels of external R&D because of the increasing coordination and monitoring costs to avoid misappropriation (HALLEN; KATILA; ROSENBERGER, 2014).
A firm may execute open innovation with several types of partners: suppliers, customers, competitors, consultants, private R&D institutes, universities and other forms of higher education, and government and public research institutes (OECD, 2005; 2008). According to von Hippel (1988), clients are the most frequent sources of innovation. Chatterji and Fabrizio (2014) detected a positive relationship between the partnership with clients and IP. Un, Cuervo-Cazurra, and Asakawa (2010) found empirical evidence that R&D alliances with suppliers provide the best results for increasing IP, followed by the collaboration with universities. In their study, alliances with competitors appeared to have a negative impact. Aschhoff and Sofka (2009) found evidence that government incentives have positive effects in the company’s innovation. Soh and Subramanian (2014) mentioned the importance of collaboration with universities. All those studies corroborate the open innovation theory and drive the proposal of the first hypothesis.
Hypothesis 1. The more a firm invests in external R&D (strategic alliances), the higher the firm’s IP.
2.2. Internal R&D and IP
Internal R&D, which is represented in several studies by R&D expenditures (e.g., HAGEDOORN; WANG, 2012) and R&D intensity (e.g., COHEN; LEVINTHAL, 1990), is mentioned in the literature mostly impacting positively innovation (BELUSSI et al., 2010; FRENZ; IETTO-GILLES, 2009; HAGEDOORN; WANG, 2012; OERLEMANS; KNOBEN; PRETORIUS, 2013). A high level of internal R&D is associated with a high level of research-based innovation, which often relates to the patenting of new technologies (HALL; BAGCHI-SEN, 2007). In a longitudinal research with start-ups, Stam and Wennberg (2009) found a positive relationship between internal R&D and new product development. The authors also found a relationship between R&D activities and a firm’s growth in high-tech industries. Most of the literature finds a positive relationship between internal R&D and innovation performance, regardless of the innovation type. All the aforementioned suggests a positive relationship between the level of in-house investment in R&D and the firm’s IP.
BBR
15,6
536
2.3. The moderating role of the absorptive capacity in the
relationship between external R&D and IP
Some authors find that internal and external R&D can be complementary or substitutes for innovation development depending on the level of investments in internal R&D. High levels of investments induce complementarity, while low levels induce substitutability. The concept of absorptive capacity (AC) introduced by Cohen and Levinthal (1990) corroborated this relationship. The authors considered that a firm’s R&D intensity is critical to the firm’s AC, which is mainly associated with an increasing in the positive effect of external R&D on IP in several empirical studies (e.g., LIN et al., 2012). Many researchers use internal R&D as a proxy of AC and find that it increases the positive effect of external R&D on IP (e.g., BELLAMY; GHOSH; HORA, 2014). Tsai (2009) detected that the effect of AC on the relationship between R&D alliances and innovation depends on the partner’s type and if the innovation is radical or incremental. On the other hand, some authors did not find a positive effect of the interaction between internal and external sources of R&D on innovation performance (e.g., MOWERY; OXLEY; SILVERMAN, 1996). Methodological issues could have provoked these contradictory results. However, we can observe that most studies focus on developed economies or Asian countries. Because the accumulation of innovation capabilities, including AC, is different for firms in developing countries compared with firms in developed countries (KIM, 1997), those contradictory results may also have occurred because of country-specific issues. Therefore, we propose the following hypothesis.
Hypothesis 3. The higher a firm’s AC, the higher is the positive effect of the investments in external R&D on the firm’s IP.
2.4. IP and financial performance
A positive relationship between IP and financial performance (FP) has been consistently found in the academia (DU; LETEN; VANHAVERBEKE, 2014; FAEMS; VISSER; ANDRIES; VAN LOOY, 2010; YAMAKAWA; YANG; LIN, 2011). Innovation is essential for firm’s survival in uncertain environments (TEECE, 2007). When a radical innovation in the industry occurs, performance of the incumbents tends to decrease, whereas new ventures pioneer the introduction of innovation (HILL; ROTHAERMEL, 2003). Even if the introduction of a radical innovation that changes industry patterns does not happen, many authors recognize the importance of innovation for performance. Tomlinson (2010) found a positive relationship between product and process innovation and factors that may indicate performance, such as firm size and sales growth. Some authors detected that open innovation activities performed by firms have a positive relationship with customer performance and FP (CHENG; HUIZINGH, 2014; DU et al., 2014). As today’s uncertainty is continually increasing, with industries rising and others dying all the time in a high product-launching speed environment, the hypothesis that IP influences positively FP in certain degree seems reasonable, besides being consistent with the theoretical foundations previously exposed.
Hypothesis 4. The higher a firm’s IP, the higher the firm’s future FP.
2.5. Current FP and future FP
BBR
15,6
537
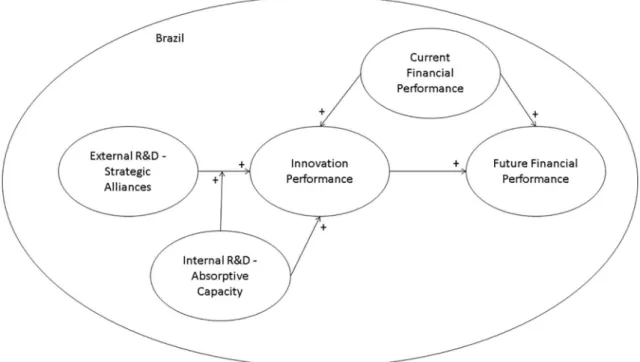
Figure 1. Theoretical Model.
may be highly correlated with IP. In addition, as long as the past performance is an important factor that influences future performance (DURAND; BRUYAKA; MANGEMATIN, 2008; TSAI, 2001), we need to include a construct representing the current FP in the model to avoid possible bias. Therefore, we derive our final two hypotheses.
Hypothesis 5a. The higher a firm’s current FP, the higher the firm’s IP.
Hypothesis 5b. The higher a firm’s current FP, the higher the firm’s future FP.
Figure 1 shows the proposed model, which is composed by the following constructs: (1) External R&D - Strategic Alliances; (2) Internal R&D - Absorptive Capacity; (3) Innovation Performance; (4) Current Financial Performance, and (5) Future Financial Performance.
3. METHOD
3.1. Data source and sample
BBR
15,6
538
3.2. Description of the variables
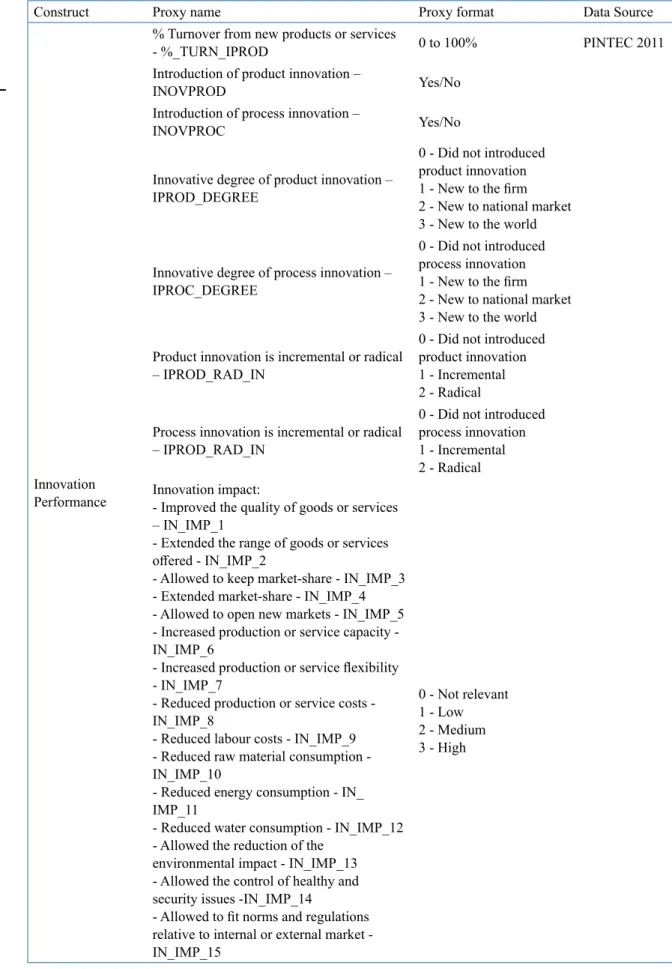
Table 1 shows the proxies that reflect the constructs with a description and the data source from which we took the data. All the constructs of the model are reflexive. An important issue about the financial performance variables is that we calculated current financial performance by the average variables of 2010 and 2011 and future financial performance used the variables of 2013. We chose 2013 because we expect that innovation performance induce better future financial performance, which we can perceive only in some later years, and 2013 is the most recent year from which we could obtain performance data.
3.3. Statistical method
As we built the database by merging several different surveys, from several different years, we did not consider common-method bias as an issue. An exploratory factor analysis (EFA) is the first step of the analysis, to reduce the dimensions of each construct. We used the factors with eigenvalue greater than 1 and, then, we applied a varimax rotation (HAIR et al. 2006). We calculate the final factors we use in the next steps of the analysis by summated-scales. Subsequently, we conducted a confirmatory factor analysis (CFA) to validate the measurement model. After this step, we conduct a structural equation modelling (SEM) to test the hypotheses and find the relationships among the constructs. We chose the Bayesian Estimation as the estimation method to run the SEM. This estimation has some advantages over others, like the maximum likelihood estimation, such as: (1) it is not based on the normality of the phenomenon; (2) runs with a smaller sample; (3) does not require linear dependence; iv) considers previous knowledge as it demands the input of a prior distribution that can be the distribution found in previous studies (KRUSCHKE; AGUINIS; JOO, 2012). We considered the convergence statistics below (1.1) as acceptable (GELMAN; CARLIN; STERN, 2013), and the confidence intervals of the relationships between the constructs is 95%.
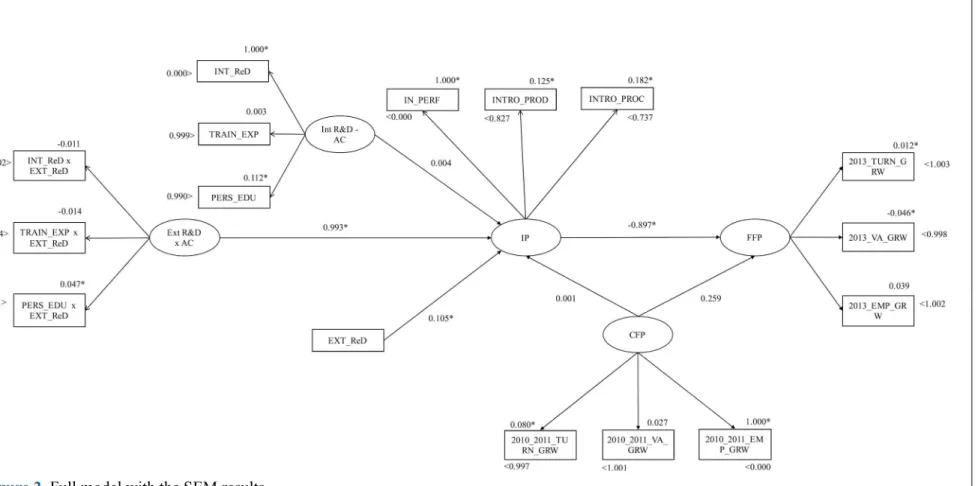
We represent the moderation of the absorptive capacity in the relationship between strategic alliances and innovation performance in the SEM, by using the mean-centering technique proposed by Little, Bovaird and Widaman (2006). Following this technique, we add a new moderation construct to the model that also loaded the construct innovation performance. We formed these constructs’ variables by multiplying all factors of the absorptive capacity construct with the factors of strategic alliances and applying the Z-score. Then, we correlated the residuals of the variables that were formed by the product of a common original factor (e.g. all variables formed by the multiplication of the first factor of absorptive capacity should have its residuals correlated) in SEM. Figure 2 presents SEM with all the factors that reflect the constructs, including the one that represents the moderation.
4. RESULTS AND ANALYSIS
BBR
15,6
539
Table 1. Constructs' proxies.
Construct Proxy name Proxy format Data Source
Innovation Performance
% Turnover from new products or services
- %_TURN_IPROD 0 to 100% PINTEC 2011 Introduction of product innovation –
INOVPROD Yes/No
Introduction of process innovation –
INOVPROC Yes/No
Innovative degree of product innovation – IPROD_DEGREE
0 - Did not introduced product innovation 1 - New to the firm 2 - New to national market 3 - New to the world
Innovative degree of process innovation – IPROC_DEGREE
0 - Did not introduced process innovation 1 - New to the firm 2 - New to national market 3 - New to the world
Product innovation is incremental or radical – IPROD_RAD_IN
0 - Did not introduced product innovation 1 - Incremental 2 - Radical
Process innovation is incremental or radical – IPROD_RAD_IN
0 - Did not introduced process innovation 1 - Incremental 2 - Radical Innovation impact:
- Improved the quality of goods or services – IN_IMP_1
- Extended the range of goods or services offered - IN_IMP_2
- Allowed to keep market-share - IN_IMP_3 - Extended market-share - IN_IMP_4 - Allowed to open new markets - IN_IMP_5 - Increased production or service capacity - IN_IMP_6
- Increased production or service flexibility - IN_IMP_7
- Reduced production or service costs - IN_IMP_8
- Reduced labour costs - IN_IMP_9 - Reduced raw material consumption - IN_IMP_10
- Reduced energy consumption - IN_ IMP_11
- Reduced water consumption - IN_IMP_12 - Allowed the reduction of the
environmental impact - IN_IMP_13 - Allowed the control of healthy and security issues -IN_IMP_14
- Allowed to fit norms and regulations relative to internal or external market - IN_IMP_15
BBR
15,6
540
Construct Proxy name Proxy format Data Source
External R&D - Strategic Alliances
Importance of the partnership by partner type:
- Clients – AL_CLI - Suppliers – AL_SUP - Rivals – AL_RIV
- Consulting firms – AL_CONSLU - Universities or research institutes – AL_ UNIV
- Professional capacitation and technical assistance centers – AL_CENTERS - Test, trial and certification centers – AL_ TEST_INST
0 - Not relevant 1 - Low 2 - Medium 3 - High
PINTEC 2011
Governmental support - SUP_GOV Yes/No Importance of acquisition of external
knowledge:
- R&D - IMP_ReD_EXT
- Other external knowledge, except software - IMP_KNOW_EXT
- Software - IMP_SOFT_EXT
- Machinery and equipment - IMP_EQ_EXT
0 - Not relevant 1 - Low 2 - Medium 3 - High
Current Financial Performance/ Future Financial Performance
Turnover growth – 2010_2011_TURN_
GRW/2013_TURN_GRW Turnover year/Turnover year -1
PIA 2009 to 2011/PIA 2012 and PIA 2013 Value added growth – 2010_2011_VA_
GRW/2013_VA_GRW Value added year/Value added year -1 Firm growth – 2010_2011_EMP_
GRW/2013_EMP_GRW Num. employees year/Num. employees year -1
Internal R&D - Absorptive Capacity
Internal R&D spending/total turnover –
INT_ReD 0 to 100% PINTEC 2011
R&D training expenses/total turnover -
TRAIN_EXP 0 to 100%
R&D personnel level of education - PERS_ EDU
0 to 3. Formula: (Num. Doctors * 3 + Num. Masters * 2 + Num. Graduates)/total R&D staff
Continuation Table 1.
innovation and 26.30% of the firms introduced process innovation. Another interesting observation we make from Table 2, is that the average performance of the firms in 2010 and 2011 overcomes the future performance of 2013. Turnover growth was on average 36.20% in 2010 and 2011 and declined to 13.6% in 2013. Employees’ growth was 9.70% on average in 2010 and 2011 and only 3.00% in 2013, and the value added improved 23.80% in one year on the average of 2010 and 2011 compared to a 21.80% growth in 2013. Although growth declined, all the performance indicators based on growth are positive, which may indicate that the manufacturing firms are still recovering from the 2008 global crisis, that hit the Brazilian industry strongly, of which the recovery started in 2010 (CUNHA; LELIS; FLIGENSPAN, 2013).
BBR
15,6
541
Table 2. Means and standard deviations of the constructs’ variables.
Construct Variable Mean Std. Dev.
Innovation Performance (IP)
INOVPROD 0.385 0.487
INOVPROC 0.263 0.441
IPROD_DEGREE 0.435 0.635
IPROD_RAD_IN 1.011 0.823
IPROC_DEGREE 0.270 0.509
IPROC_RAD_IN 1.154 0.738
%_TURN_IPROD 10.0% 22.7%
IN_IMP_1 2.176 1.124
IN_IMP_2 1.892 1.177
IN_IMP_3 2.169 1.079
IN_IMP_4 1.931 1.141
IN_IMP_5 1.783 1.196
IN_IMP_6 1.861 1.206
IN_IMP_7 1.744 1.196
IN_IMP_8 1.501 1.191
IN_IMP_9 1.393 1.187
IN_IMP_10 0.961 1.092
IN_IMP_11 0.968 1.084
IN_IMP_12 0.665 1.005
IN_IMP_13 1.287 1.250
IN_IMP_14 1.527 1.262
IN_IMP_15 1.527 1.275
External R&D - Strategic Alliances (Ext R&D)
IMP_ReD_EXT 0.502 1.015
IMP_KNOW_EXT 0.555 1.044
IMP_SOFT_EXT 1.084 1.307
IMP_EQ_EXT 1.958 1.242
AL_CLI 0.695 1.199
AL_SUP 0.769 1.217
AL_RIV 0.253 0.726
AL_CONSUL 0.385 0.871
AL_UNIV 0.439 0.942
AL_CENTERS 0.343 0.820
AL_TEST_INST 0.478 0.980
SUP_GOV 0.446 0.497
Internal R&D - Absorptive Capacity (Int R&D – AC)
INT_ReD 1.7% 11.5%
TRAIN_EXP 0.8% 0.33%
PERS_EDU 0.376 0.497
Current Financial Performance (CFP)
2010_2011_TURN_GRW 36.2% 374.3%
2010_2011_VA_GRW 23.8% 976.0%
2010_2011_EMP_GRW 9.7% 24.2%
Future Financial Performance (FFP)
2013_TURN_GRW 13.6% 94.5%
2013_VA_GRW 21.8% 333.5%
BBR
15,6
542
only two constructs: Innovation Performance (down to four factors) and External R&D - Strategic Alliances (down to one factor). We present the resulting factors of these two constructs, as a result of the EFA, after the varimax rotation in Table 3. The only variables we use, that weighted 0.7 or higher in each factor to calculate the final variable and are shown in Table 3.
Table 3. Results of the EFA.
Innovation Performance External R&D - Strategic Alliances Variable Factor 1 Factor 2 Factor 3 Factor 4 Variable Factor 1
INOVPROD 0.88 IMP_ReD_EXT
INOVPROC 0.81 IMP_KNOW_EXT
IPROD_DEGREE 0.80 IMP_SOFT_EXT
IPROD_RAD_IN IMP_EQ_EXT
IPROC_DEGREE AL_CLI 0.81
IPROC_RAD_IN AL_SUP 0.79
%_TURN_IPROD AL_RIV
IN_IMP_1 AL_CONSUL 0.76
IN_IMP_2 AL_UNIV 0.75
IN_IMP_3 0.70 AL_CENTERS 0.80
IN_IMP_4 0.77 AL_TEST_INST 0.85
IN_IMP_5 SUP_GOV
IN_IMP_6 IN_IMP_7
IN_IMP_8 0.76
IN_IMP_9 0.75
IN_IMP_10
IN_IMP_11 0.74
IN_IMP_12 IN_IMP_13 IN_IMP_14 IN_IMP_15
For Innovation Performance, we formed factor 1 by the average of IN_IMP_8, IN_ IMP_9 and IN_IMP_11, which are variables that measure the impact of the innovation on costs (in the case of these variables, production costs, labour costs and energy costs). For that reason, we termed factor 1 as Innovations’ Cost-Reduction Performance (CR_ PERF). We formed factor 2 by IN_IMP_3 and IN_IMP_4, which represent the impact on keeping and increasing the firm’s participation in the market. Therefore, we termed factor 2
Innovations’ Market Performance (IN_PERF). We formed factor 3 from the introduction or not of product innovation (INOVPROD) and from the innovativeness degree of the product innovation (IPROD_DEGREE) and, for that reason, we termed it Product Innovation Introduction (INTRO_PROD). Factor 4, which we formed from the introduction or not of
BBR
15,6
543
some type of partner for innovation. Therefore, we named this factor as Strategic Alliances
(STR_ALL). We do not consider in the SEM all the other variables of the constructs that do not form one of the factors. For the other constructs (Internal R&D - Absorptive Capacity, Current Financial Performance and Future Financial Performance), we used all the variables separately in the SEM.
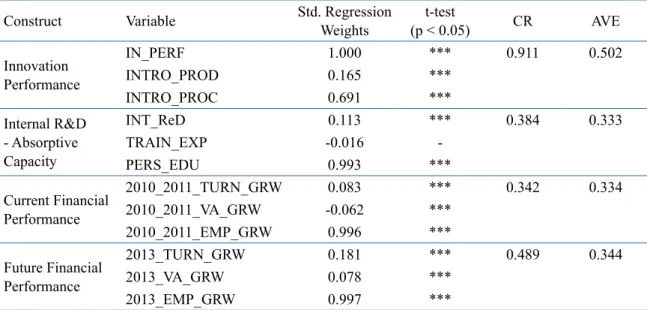
A CFA is the next step of the analysis, considering the four constructs of the model that contains more than one proxy (as we reduce the construct External R&D – Strategic Alliance down to a unique variable, it does not participate of the CFA). We conduct the CFA analysis using Bayesian estimation. After several runs and the analysis of the modification indexes, we removed the variable CR_PERF from the construct innovation performance and fixed the error variance of IN_PERF as 0. We make no other changes to the measurement model. The results of the measurement model are in Table 4.
Table 4. Results of the CFA.
Construct Variable Std. Regression Weights (p < 0.05)t-test CR AVE
Innovation Performance
IN_PERF 1.000 *** 0.911 0.502
INTRO_PROD 0.165 ***
INTRO_PROC 0.691 ***
Internal R&D - Absorptive Capacity
INT_ReD 0.113 *** 0.384 0.333
TRAIN_EXP -0.016
-PERS_EDU 0.993 ***
Current Financial Performance
2010_2011_TURN_GRW 0.083 *** 0.342 0.334
2010_2011_VA_GRW -0.062 ***
2010_2011_EMP_GRW 0.996 ***
Future Financial Performance
2013_TURN_GRW 0.181 *** 0.489 0.344
2013_VA_GRW 0.078 ***
2013_EMP_GRW 0.997 ***
Although all the standardized regression weights of the measurement model should be all greater than 0.7 to guarantee the reliability of the individual index, all the regression weights are significant, with the p-value of 0.05, except for TRAIN_EXP in the construct Internal R&D - Absorptive Capacity. However, we decided to keep it to a minimum of three proxies for each construct. The only constructs that presented the minimum level of average variance extracted – AVE, that should be 0.5, and of composite reliability – CR, that should be 0.7, is Innovation Performance. All the others are below these levels. However, some authors consider that the AVE is a very conservative criterion for convergent validity and the researcher may decide that the construct has convergent validity even with more than 50% of the variance explained by error (MALHOTRA; DASH, 2011). Considering this, Future Financial Performance is almost acceptable and we decided not to change the other constructs to keep three variables in each one.
BBR
15,6
544
between Future Financial Performance and the other three constructs are not significant. This may indicate a specific problem with the construct Future Financial Performance’s nomological validity. However, the CFA validates the construct, which presents acceptable discriminant and convergent validity. In addition, the results of SEM with this construct present a significant relationship between this construct and the construct Innovation Performance, as shown below. For these reasons, we decided to move forward without additional changes in the measurement model.
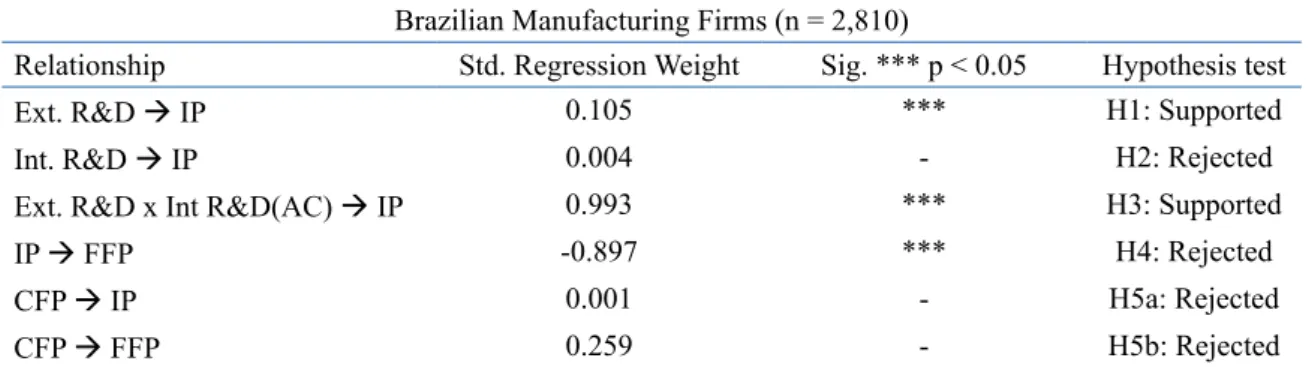
The following step of the analysis is the test of the causal model with SEM using Bayesian estimation. We summarize the results of the analysis in Table 5. Figure 2 shows the complete model, the standardized coefficients and the error terms. The model presents a fourth construct, Ext. R&D x AC, representing the moderation relationship of absorptive capacity, as previously explained. The model’s posterior predictive is 0.56, which we can consider a good fit, as it is close to 0.5 (GELMAN, 2013).
Table 5. Results of the SEM.
Brazilian Manufacturing Firms (n = 2,810)
Relationship Std. Regression Weight Sig. *** p < 0.05 Hypothesis test
Ext. R&D IP 0.105 *** H1: Supported
Int. R&D IP 0.004 - H2: Rejected
Ext. R&D x Int R&D(AC) IP 0.993 *** H3: Supported
IP FFP -0.897 *** H4: Rejected
CFP IP 0.001 - H5a: Rejected
CFP FFP 0.259 - H5b: Rejected
We examined the standard regression weights of the relationships in Table 5 to analyse the hypotheses. The first hypothesis suggested that the higher the level of external R&D of a Brazilian manufacturing firm, mainly accessed through strategic alliances, the higher its innovation performance. This hypothesis (H1) is supported, with a positive and significant (p < 0.05) path coefficient of 0.105. The open innovation that occurs mainly through strategic alliances in manufacturing Brazilian firms is corroborated by the fact that the construct External R&D is reduced to a variable formed only by the proxies representing the importance of alliances with several types of partners (clients, suppliers, consultants, universities, research centres and test institutes). We exclude the proxies that represent purely acquisition of external knowledge or R&D from the model by the EFA. All the types of partners have a similar weight in the factor that represent External R&D, which indicates that the firms that use strategic alliances for open innovation use all those types of partners and consider them similarly important.
BBR
15,6
545
BBR
15,6
546
developed partners. However, higher levels of internal R&D, or absorptive capacity, may be important to potentiate the effects of the strategic alliances on the innovation performance, as proposed by hypothesis 3. Our analysis corroborated this fact as H3 is confirmed for p < 0.05 with a path coefficient of 0.993. It is interesting to observe that the only factor of absorptive capacity that had a significant moderation effect with the strategic alliances in the model is level of education of the employees. This means that, for Brazilian manufacturing firms, it is important to have a well-educated team to work on open innovation activities, as they are more qualified to evaluate opportunities, to identify and absorb external knowledge to generate innovation. The level of internal R&D intensity still does not allow enough accumulation of capabilities to improve the absorptive capacity of these firms.
We expected to find a positive relationship between innovation performance and future financial performance, as indicated by hypothesis 4; however, we found a significant negative relationship (-0.897 with p < 0.05), rejecting H4. Although we consistently find the relationship between innovation performance and financial performance in the academia, an amount of time is necessary between the introduction of innovation and the verification of economical results from it. In this study, we considered the innovation introduced between 2009 and 2011 and the indicators of financial performance measured were from 2013. This two-year time lag was not enough for the innovations to translate into performance improvement considering indicators such as turnover growth, employees’ growth or value-added growth. However, it is enough to reflect the increase in costs and the decrease in revenues caused by the redirection of resources from marketing and sales to innovation activities (such as internal R&D), and by the management of collaboration (FAEMS et al., 2010).
We did not verify the effect of current financial performance in the innovation performance, which would indicate that successful firms innovate more (path coefficient of 0.001, not significant with p < 0.05, indicating the rejection of H5a). It suggests that Brazilian manufacturing firms that are not yet financially successful may still succeed in innovation if they accumulate enough absorptive capacity and balance their strategic alliances. The greater importance of personnel’s education in comparison with internal R&D intensity as a dimension of absorptive capacity helps the achievement of this equality of chances as the former demands less money than the latter to be improved. Neither did we find a significant effect between current financial performance and future financial performance (path coefficient of 0.259, not significant with p < 0.05, indicating the rejection of H5b). It indicates that firms are alternating in the industry leadership in time, with new entrants overcoming incumbents frequently. This may be an effect of innovations introduced previously to 2009 and reinforces the time-lag between the introduction of innovation and financial performance improvements.
5. CONCLUSION
BBR
15,6
547
The main goal of the study is twofold. First, it intended to understand how the different sources of R&D, namely internal and external, influence innovation performance, with innovation performance being the successful introduction of innovation by firms and its impacts on the firms’ processes and markets. We achieved our objective. We could evidence that, in Brazilian manufacturing firms, external R&D, mainly from strategic alliances, had a positive influence on the innovation performance, as the theory predicted. Internal R&D investments, such as R&D intensity and level of education of employees, on the other hand, did not affect the innovation performance directly. However, it increased the positive effect of the strategic alliances on the innovation performance, mainly the proxy level of education of employees. The support of this hypothesis is in line with the absorptive capacity theory. However, in the Brazilian manufacture industry case, the proxy of absorptive capacity that is currently more effective, is the one that needs less monetary investments among the three proxies (level of education of employees), which is an important dimension of absorptive
capacity but alone could not guarantee an increase of innovation performance. Therefore, we can conclude that continuous investment in all dimensions of internal R&D should be done as the level of technological capabilities accumulated by the Brazilian firms is still low. If they catch-up to the technological frontier, this accumulation of internal R&D will tend to influence the effect of the strategic alliances on the innovation outcomes more (by an increase of the absorptive capacity), as well as, affect innovation directly.
The second objective is to verify the effect of innovation performance on the firms’ future financial performance. We could not successfully verify a positive impact as predicted. On the contrary, the effect is negative. The time-lag between the innovation performance indicators and the future financial performance indicators is only of two years (2011 to 2013) and is not enough to reflect the effect of new products or services on the financial performance. However, it is interesting to find that the financial performance in the short term has a decrease provoked by innovation, introduced because of the management costs of the strategic alliances and by the redirection of marketing and sales resources to innovation activities, such as internal R&D, causing a momentary decrease in the financial performance.
One interesting finding is that product innovation had a higher incidence than process innovation (38.50% vs. 26.30%) and new products are responsible for on average 10% of the turnover of the firms in our sample. This higher incidence of product innovation may have emerged from a view by Brazilian firms and the government that product innovation is nobler and more effective to improve financial performance than process innovation, which may have caused a higher level of public financing for the former type of innovation. This may have motivated manufacturing firms to make less effort in generating process innovation, which is usually responsible for improving the production process, which lower costs and may reflect faster in the financial performance than product innovation does, which depends on marketing efforts to introduce the new product in the market and improve the firm’s market-share and revenues. This may be one of the reasons we could not identify a positive relationship between innovation performance and future financial performance, with the short time-lag available.
BBR
15,6
548
Regardless these limitations, this paper presents a valuable contribution to understand the relationship among strategic alliances, absorptive capacity, innovation performance and financial performance of the Brazilian manufacturing firms. As implications for practitioners, we identified in this study that Brazilian manufacturing industries should invest more on internal R&D, together with strategic alliances, to improve its absorptive capacity; and focus more on process innovation than we do today. These two strategies should be the focus of governmental programs that are now focusing more on product innovation. As future studies, we suggest conducting the analysis of manufacturing firms in more developed countries, which are in different innovative stages compared to Brazil. We can compare Brazilian manufacturing firms to the ones from Europe or from the USA, for instance, in order to try identifying lessons that Brazilian organizations can learn. Another possible analysis is to test the model with service firms, which are less frequently studied in the literature and have a different innovation process.
6. REFERENCES
AHUJA; LAMPERT, C. M.; TANDON, V. Moving Beyond Schumpeter: Management Research on the Determinants of Technological Innovation. The Academy of Management Annals, v. 2, n. 1, p. 1–98, 2008. ARORA, A.; BELENZON, S.; RIOS, L. A. Make, buy, organize: The interplay between research, external
knowledge, and firm structure. Strategic Management Journal, v. 35, n. 3, p. 317–337, 2014.
ASCHHOFF, B.; SOFKA, W. Innovation on demand-Can public procurement drive market success of innovations? Research Policy, v. 38, n. 8, p. 1235–1247, 2009.
BELLAMY, M. A.; GHOSH, S.; HORA, M. The influence of supply network structure on firm innovation.
Journal of Operations Management, v. 32, n. 6, p. 357–373, 2014.
BELUSSI, F.; SAMMARRA, A.; SEDITA, S. R. Learning at the boundaries in an "Open Regional Innovation System": A focus on firms’ innovation strategies in the Emilia Romagna life science industry. Research Policy, v. 39, n. 6, p. 710–721, 2010.
CHATTERJI, A. K.; FABRIZIO, K. R. Using users: When does external knowledge enhance corporate product innovation? Strategic Management Journal, v. 35, n. 10, p. 1427–1445, 2014.
CHENG, C. C. J.; HUIZINGH, E. K. R. E. When Is Open Innovation Beneficial? The Role of Strategic Orientation. Journal of Product Innovation Management, v. 31, n. 6, p. 1235–1253, nov. 2014.
CHESBROUGH, H. H. W. Open innovation: The new imperative for creating and profiting from technology. Harvard Business Press, 2003.
CHOUNG, J. Y.; HWANG, H. R.; SONG, W. Transitions of Innovation Activities in Latecomer Countries: An Exploratory Case Study of South Korea. World Development, v. 54, p. 156–167, 2014.
COHEN, W. M.; LEVINTHAL, D. Absorptive Capacity: A New Perspective on Learning and Innovation.
Administrative Science Quarterly, v. 35, n. 1, p. 128–152, 1990.
CUNHA, A. M.; LELIS, M. T. C.; FLIGENSPAN, F. B. Desindustrialização e comércio exterior: evidências recentes para o Brasil. Revista de Economia Política, v. 33, n. 3, p. 463-485, 2013.
DU, J.; LETEN, B.; VANHAVERBEKE, W. Managing open innovation projects with science-based and market-based partners. Research Policy, v. 43, n. 5, p. 828–840, 2014.
DURAND, R.; BRUYAKA, O.; MANGEMATIN, V. Do science and money go together? The case of the French biotech industry. Strategic Management Journal, v. 29, n. 12, p. 1281–1299, 2008.
DUTTA, S.; LAVINN, B.; WUNSCH-VINCENT, S. The global innovation index 2016: Winning with global innovation., Johnson Cornell University 2016.
DUYSTERS, G.; LOKSHIN, B. Determinants of Alliance Portfolio Complexity and Its Effect on Innovative Performance of Companies. Journal of Product Innovation Management, v. 28, n. 4, p. 570–585, 2011. FAEMS, D; DE VISSER, M.; ANDRIES, P.; VAN LOOY, B. Technology Alliance Portfolios and Financial
Performance: Value-Enhancing and Cost-Increasing Effects of Open Innovation. Journal of Product Innovation Management, v. 27, n. 6, p. 785–796, 2010.
BBR
15,6
549
FIGUEIREDO, P. N. Evolution of the short-fiber technological trajectory in Brazil’s pulp and paper industry: The role of firm-level innovative capability-building and indigenous institutions. Forest Policy and Economics, v. 64, p. 1–14, 2016.
FRENZ, M.; IETTO-GILLIES, G. The impact on innovation performance of different sources of knowledge: Evidence from the UK Community Innovation Survey. Research Policy, v. 38, n. 7, p. 1125–1135, 2009. GELMAN, A. Two simple examples for understanding posterior p-values whose distributions are far from
uniform. Electronic Journal of Statistics, v. 7, p. 2595-2602, 2013.
___; CARLIN, J. B.; STERN, H. S.; RUBIN, D. B. Bayesian data analysis. Vol. 2. Boca Raton, FL, USA:
Chapman & Hall/CRC, 2014.
HAGEDOORN, J.; WANG, N. Is there complementarity or substitutability between internal and external R&D strategies? Research Policy, v. 41, n. 6, p. 1072–1083, 2012.
Hair, J., Black, W., Babin, B., Anderson, R., and Tatham, R.: 2006. Multivariate data analysis. Pearson Prentice Hall.
HALL, L. A.; BAGCHI-SEN, S. An analysis of firm-level innovation strategies in the US biotechnology industry. Technovation, v. 27, n. 1–2, p. 4–14, 2007.
HALLEN, B. L.; KATILA, R.; ROSENBERGER, J. D. How do social defenses work? A resource-dependence lens on technology ventures, venture capital investors, and corporate relationships Academy of Management Journal, v. 57, n. 4, p. 1078–1101, 2014.
HILL; ROTHAERMEL F. T. The performance of incumbent firms in the face of radical technological innovation. Academy of Management Review, v. 28, n. 2, p. 257–274, 2003.
INSTITUTO BRASILEIRO DE GEOGRAFIA E ESTATÍSTICA (IBGE). PINTEC – Pesquisa de Inovação, 2016a Disponível em: <http://www.pintec.ibge.gov.br/> Acessado em: 20 janeiro 2016.
___. Pesquisa Industrial - Empresa 2014, 2016b Disponível em: <http://www.ibge.gov.br/home/estatistica/ economia/industria/pia/empresas/2014/defaultempresa.shtm> Acessado em: 20 janeiro 2016.
___. CONCLA – Comissão Nacional de Classificação, 2017 Disponível em: <http://www.cnae.ibge.gov.br > Acessado em: 28 março 2017.
INFOMONEY. O que o Brasil pode aprender com o que foi feito na economia peruana. 2016. Available in: <http://www.infomoney.com.br/mercados/noticia/3930585/que-brasil-pode-aprender-com-que-foi-feito-economia-peruana>. Acessado em: 10 agosto 2016.
KIM, L. Imitation to innovation: The dynamics of Korea’s technological learning. Harvard Business Press, 1997.
KRUSCHKE, J. K.; AGUINIS, H.; JOO, H. The time has come: Bayesian methods for data analysis in the organizational sciences. Organizational Research Methods, v. 15, n. 4, p. 722-752, 2012.
LIN, C.; WU, Y.J.; CHANG, C.; WANG, W.; LEE, C.Y. The alliance innovation performance of R&D alliances-the absorptive capacity perspective. Technovation, v. 32, n. 5, p. 282–292, 2012.
LITTLE, T. D.; BOVAIRD, J. A.; WIDAMAN, K. F. On the merits of orthogonalizing powered and product terms: Implications for modeling interactions among latent variables. Structural Equation Modeling, v. 13, n. 4, p. 497-519, 2006.
MALHOTRA, N. K.; DASH, S. Marketing Research: An Applied Approach. London: Pearson Publishing, 2011.
MOWERY, D. C.; OXLEY, J. E.; SILVERMAN, B. S. Strategic alliance and interfirm knowledge transfer.
Strategic Management Journal, v. 17, S2, p. 77–91, 1996.
NELSON, R. (1993). National innovation systems: a comparative analysis. Oxford University Press. OERLEMANS, L. A. G.; KNOBEN, J.; PRETORIUS, M. W. Alliance portfolio diversity, radical and
incremental innovation: The moderating role of technology management. Technovation, v. 33, n. 6–7, p.
234–246, 2013.
ORGANIZATION FOR ECONOMIC CO-OPERATION AND DEVELOPMENT (OECD). Oslo Manual-Guidelines for Collecting and Interpreting Innovation Data. OECD Publishing: Paris, 2005.
___. Open innovation in global networks. OECD Publishing: Paris, 2008.
PÉREZ-LUÑO, A.; MEDINA, C. C.; LAVADO, A. C.; RODRÍGUEZ, G. C. How social capital and knowledge affect innovation. Journal of Business Research, v. 64, n. 12, p. 1369–1376, 2011.
BBR
15,6
550
STAM, E.; WENNBERG, K. The roles of R&D in new firm growth. Small Business Economics, v. 33, n. 1,
p. 77–89, 2009.
TEECE, D. J. Explicating dynamic capabilities: the nature and microfoundations of (sustainable) enterprise performance. Strategic Management Journal, v. 28, n. 13, p.1319-1350, 2007.
TOMLINSON, P. R. Co-operative ties and innovation: Some new evidence for UK manufacturing. Research Policy, v. 39, n. 6, p. 762–775, 2010.
TSAI, K.H. Collaborative networks and product innovation performance: Toward a contingency perspective.
Research Policy, v. 38, n. 5, p. 765–778, 2009.
TSAI, W. Knowledge transfer in intraorganizational networks: Effects of network position and absorptive capacity on business unit innovation and performance. Academy of Management Journal, v. 44, n. 5, p. 996-1004, 2001.
UN, C. A.; CUERVO-CAZURRA, A.; ASAKAWA, K. R&D Collaborations and Product Innovation. Journal of Product Innovation Management, v. 27, n. 5, p. 673–689, 2010.
VON HIPPEL, E. The sources of innovation. In. Das Summa Summarum des Management. Gabler, 2007. p. 111-120.