doi: 10.1590/0101-7438.2018.038.02.0215
SCALAR AND VECTOR GAMES IN THE EVALUATION OF SOCIAL AND ENVIRONMENTAL DISCLOSURE AND THEIR
RELATIONSHIP WITH MARKET VALUE
Adriana Kroenke
1*, Victoriana Rubiales Caballero
2,
Bianca Cecon
3and Nelson Hein
1Received November 7, 2017 / Accepted March 17, 2018
ABSTRACT.This study evaluated the association of social, environmental and socio-environmental dis-closure with the market value of Brazilian companies with high environmental impact based on the Game Theory. To perform the analysis, rankings were developed by using scalar and vector gaming techniques. After the construction of the rankings, the association between them was verified through Kendall’s correla-tion analysis. The findings indicate a positive associacorrela-tion of social, environmental and socio-environmental disclosure with the market value of Brazilian companies with high environmental impact. In addition, there was an increase in the degree of association during the investigated periods. This result suggests that the market is increasingly demanding regarding the disclosure of this information, which indicates that the disclosure of these information can bring competitive advantages in relation to the market value.
Keywords: socio-environmental disclosure, market value, game theory.
1 INTRODUCTION
Interest in socio-environmental issues has been growing significantly in recent years (Cintra, 2011). Sousa, Silva, Ribeiro & Weffort (2014) emphasize that social and environmental disclo-sures have gained prominence due to the initiatives of national and international organizations concerned with social responsibility and due to the broad recognition of debates regarding sus-tainability. However, according to Bauer & Naime (2012), the studies regarding this topic still remain scarce in the Brazilian scenario, which encourages the conduction of new researches to better understand the field and to fill this research gap.
*Corresponding author.
1Universidade Regional de Blumenau, Rua Antˆonio da Veiga, 140 – Itoupava Seca, 89030-903 Blumenau, SC, Brasil. Tel.: (47) 3321-0565 – E-mails: [email protected]; [email protected]
2Universidad de Sevilla, Departamento de Economia Aplicada III, C/S. Fernando, 4, C.P. 41004 – Sevilla, Espa˜na. E-mail: [email protected]
In light of voluntary disclosure by organizations, Dye (2001) states that there is a Theory of Voluntary Disclosure. For the author, this theory has as its central premise that organizations will only disclose information that is favorable to them and will not disclose information that is unfa-vorable. Therefore, if companies do not disclose some information, the market will consequently interpret it as negative, because if it were positive, there would be no reason why companies would hide such information (Dye, 1985; Salotti & Yamamot, 2005). Verrecchia (1983) also points out that users may even think that the information not shown is positive, but they will think at the same time that, because they have not been shown, they are not positive enough to compensate costs.
According to Santos, Ara´ujo & Leite Filho (2016) there have been advances, in developed cap-ital markets, in the investigations of topics related to the research of voluntary disclosure which involve the relationship between voluntary disclosure and the market value of companies. How-ever, Uyar & Kilic¸ (2012) mention that this is not the reality which is evidenced in researches with companies of emerging capital markets, since such relationship is still an unexplored topic. In this sense, there is scope in this research gap regarding the association between voluntary disclosure and market value in emerging market companies. In addition, the relevance of inves-tigating such association in the Brazilian context to the construction of scientific knowledge is emphasized, since Brazil is one of the emerging countries of the world (Murcia, 2009).
Thus, considering the current scenario in which external users of the organization are increasingly demanding transparency from companies in relation to the socio-environmental issues they face (Sobhani, Amran & Zainuddin, 2009), the non-disclosure of this information may prejudice the image of the company. This occurs because if the organization omits certain information, the market can assume that the value of the same company is being overestimated, which can lead investors to sell their shares, and this consequently entails a lower market value for this company compared to its competitors who disclose information (Dye, 1985).
In this context, considering that voluntary disclosure tends to be associated with the companies’ market value, according to the conclusion of Dye (1985) in relation to Voluntary Disclosure Theory, this research seeks to evaluate the association between the disclosure of social, envi-ronmental and socio-envienvi-ronmental information, which are voluntary in the national context, with the market value of the same companies, in order to verify empirical evidences related to such association.
The measurement of the social, environmental, and socio-environmental disclosures and market value make up the originality of the research and, similarly, its scientific contribution indeed. Non-triviality is achieved by the composition of the variables, sample and methods, as well as the volume and extent of the analysis. In short, these elements of the scientific tripod account for the impact and contribution to the area of operational research.
The uniqueness sought by this research arises from two contributions. The first one related to the measurement of the market value of the organizations, using as metric the stock price. This metric was verified only in international studies that analyzed the association between the socio-environmental disclosure and the market value of companies. There are no records of national studies of this kind. The second one comes from the technique used in the process of company ranking according to the level of social, environmental and socio-environmental disclosure that, for the lack of a better view, was not found in previous surveys. The results of the ranking of the companies according to social, environmental and socio-environmental disclosure were obtained using tools related to Game Theory. Specifically, scalar games (unicriteria) in the formation of rankings of social and environmental disclosure and vector games (multicriteria) in the formation of rankings of socio-environmental disclosure.
The study is justified by the debate regarding the association of voluntary disclosure and the mar-ket value of companies. Currently there are two aspects, one argues that disclosure of voluntary information adds value to the company, since it increases the competitive advantage of the orga-nization, taking the company to a higher market value than its competitors that do not disclose information. The other part argues that voluntary disclosure represents only an increase in costs to the organization and consequently results in a lower market value for the company, according to Olayinka & Oluwamayowa (2014).
2 INFORMATION DISCLOSURE
The information disclosure can be interpreted as being the channel of information transmission of the company to the market (Murcia, 2009). According to Healy & Palepu (2001) and Fran-cis, Nanda & Olsson (2008), the information disclosure is demanded by the market as a con-sequence of the informational asymmetry that occurs between internal users and external users of the company, since internal users usually have more information about the organization than external users.
According to Malacrida & Yamamoto (2006), the highest level of voluntary disclosure by com-panies occurs due to the expectation of a positive repercussion of this information in the market, thus improving the financial situation of the company. Sousa, Silva, Ribeiro & Weffort (2014) point out that, at present, the voluntary disclosure occurs due to the organizations’ need to dif-ferentiate themselves from the others which are in the market, in such a way that the disclosure can provide decisions of the agents that maximize the value of the organization.
In the international context, the field of research that involves issues related to the disclosure of voluntary information of companies is relatively advanced (Healy & Palepu, 2001). It is possible to verify several studies on this subject in countries such as: Balgadesh, France, Hong Kong, Japan, Malaysia, Mexico, the Czech Republic, Sweden and Switzerland (Murcia, 2009). The frequency of studies is incipient in capital markets in underdeveloped and emerging countries, as is the case in Brazil. Lanzana (2004) confirms that in the national context, this field of research still remains scarce.
Regarding the disclosure made voluntarily by organizations, the highlight in the national context is the disclosure of socio-environmental information. In Brazilian organizations, the disclosure of social and environmental information is considered voluntary, since there are no rules regu-lating the disclosure of such issues. However, it is worth highlighting the strong recommenda-tions of the Brazilian Electricity Regulatory Agency –Agˆencia Nacional de Energia El´etricain Portuguese (ANEEL) – for companies that operate in the electricity sector to disclose certain socio-environmental information (Rover, 2013).
For Santos, Ara´ujo & Leite Filho (2016), the main justification for conducting research involving such an association is due to the issue of being directly related to the fact that the manager discloses information to stakeholders. According to Rover & Santos (2014), investigating this issue contributes with the companies, as these can improve their issues regarding the disclosure of the findings of such association. In addition, if a higher market value were evidenced due to the disclosure of socio-environmental information, this fact could encourage companies to disclose such information (Souza, 2013), which would contribute to reducing the problem of informational asymmetry in companies. Therefore, it is important to investigate the relationship between socioenvironmental disclosure and its relevance to the capital market is important both for the academic scope and for the users of the information (Rover, 2013).
3 METHOD AND RESEARCH PROCEDURES
This section presents the method and procedures used in the study when achieving the proposed objectives and is divided into four subdivisions. Initially, there is a discussion about the design of the research in relation to the objective, procedure and approach of the problem. Next, the population and the delimitation of the sample are highlighted. In the third section we present the research construct and the form of data collection. Finally, in the fourth section the procedures used during data analysis are exposed.
3.1 Research Design
In relation to the research objective, the study is classified as descriptive once it evaluates the association of social disclosure with the market value of companies, of the environmental dis-closure with the market value of companies and socio-environmental disdis-closure with the market value of Brazilian companies with high environmental impact. Regarding the procedures, the study is characterized as documentary, since the data related to the socio-environmental disclo-sure were collected from the following reports: sustainability report, annual report, standardized financial statements, explanatory notes, independent auditor’s reports, fiscal council opinion, audit committee report and reference form, as well as data related to the market value of the companies collected through the Econom´aticadatabase. Finally, in relation to the approach of the problem, the study is classified as predominantly quantitative, since it uses the techniques of descriptive statistics, scalar games, vector games and the ordinal correlation coefficient (Kendall) to reach the proposed goal.
3.2 Population and Sample
The study population corresponds to the 48 companies in the areas of extraction and treatment of minerals, to the metallurgical industry, to the paper and pulp industry, to the leather and furs industry, to the chemical industry and to transport, terminals, warehouses and commerce com-panies of the S˜ao Paulo Stock Exchange (BM&FBovespa), which are defined as having a high environmental impact, according to Law No. 10.165, dated December 27, 2000. Four of these were excluded because they were controlled by other companies in the sample, 5 were eliminated because they were in judicial recovery during the analyzed period and 15 were excluded because they did not present all the necessary information for the calculation of the socio-environmental disclosure index and market value. Thus, the sample consisted of 24 companies.
3.3 Research and Data Collection Construct
3.3.1 Level of Social and Environmental Disclosure
The Rover metric (2013) was used in order to measure the level of social, environmental and socio-environmental disclosure of the organizations of the sample. This metric was chosen be-cause its author is one of the main researchers on the topic of “socio-environmental disclosure” in Brazil and she constructed the metric based on 20 relevant national and international studies in the literature on the topic.
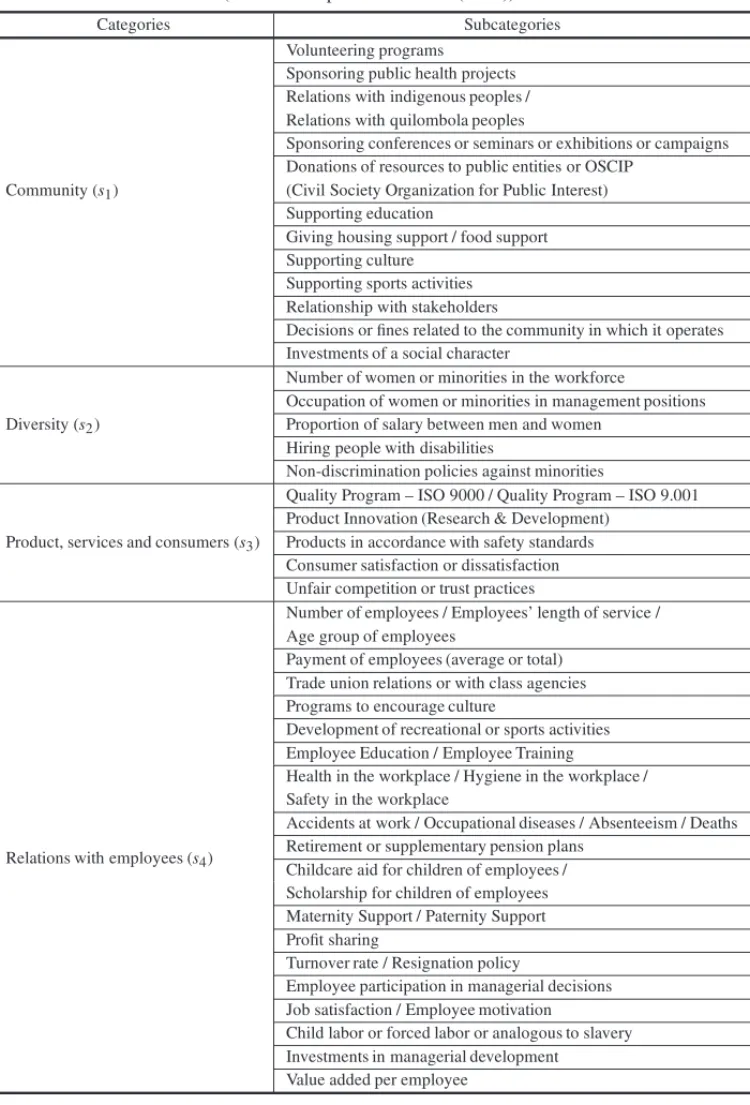
Table 1 shows the four social categories of the Rover metric (2013), with their respective social subcategories adapted to the data collection of the present research regarding the level of social disclosure.
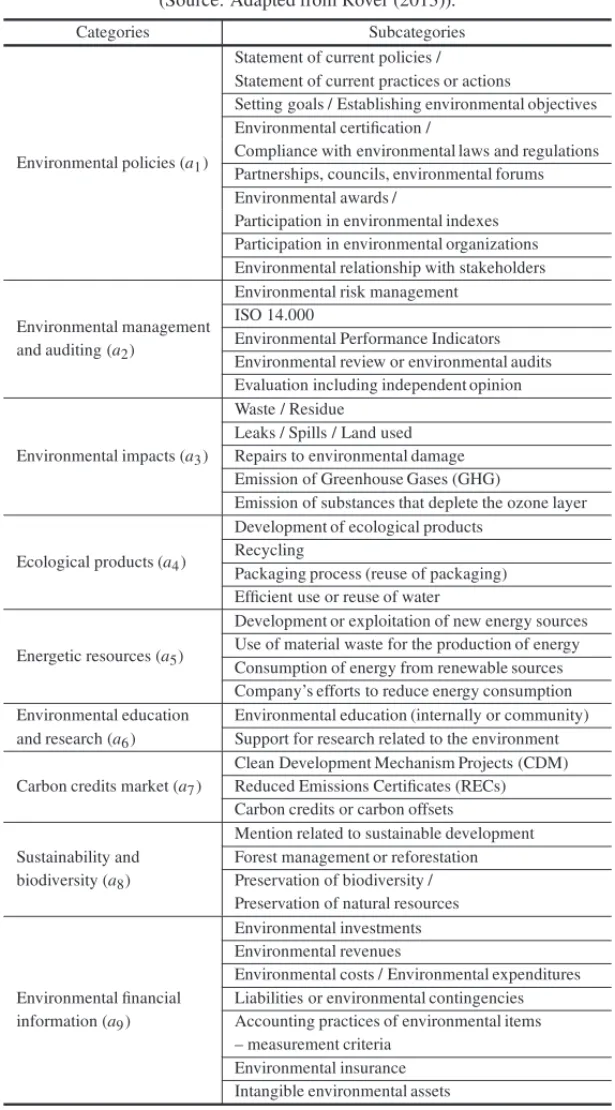
Table 2 presents the Rover metric (2013) in relation to the environmental categories and their subcategories adapted to this research.
It should be noted that the Rover metric is composed of 40 environmental subcategories and 40 social subcategories. Thus, there was a need for adaptations, since, unlike Rover’s (2013) research, this study was not concerned with the number of times the information was disclosed, but whether the information was evidenced by the company or not.
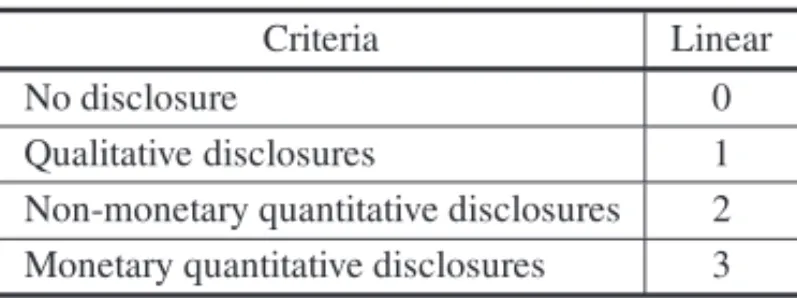
To measure each of the adapted subcategories and presented in Tables 1 and 2, we chose to use linear weighting, since for this weighting format, the higher the quality of information, the greater the weight assigned to it. Table 3 summarizes the values applied to each type of information. The criteria presented in Table 3 sought to quantify the social and environmental subcategories in the following documents: Standardized Financial Statements (Balance Sheet, Statement of Changes in Shareholders’ Equity, Statement of Cash Flows, Statement of Income for the Year and Statement of Value Added) Notes to the Financial Statements, Independent Auditor’s Report, Fiscal Council’s Report, Audit Committee’s Report, Sustainability Report, Annual Report and Reference Form (item 7.8). It is worth noting that, in order to search for such information in the cited documents, we used NVivo software, which searches through semantic words. After the sections containing the semantic words were located, the analysis was performed through the NVivo software regarding the type of information. If the information was of a qualitative nature, the linear weighting assigned was ’1’, if non-monetary quantitative ’2’ and in case of monetary quantitative ’3’, according to Table 3.
Finally, to quantify the social categories (s1,s2,s3 and s4) and environmental categories (a1,a2,a3,a4,a5,a6,a7,a8 anda9)presented in Tables 1 and 2, the division of the amount
of information associated with each category was conducted for the maximum amount that it could achieve, as it was conducted by Rover (2013). It is important to emphasize that before calculating the rankings of the companies, according to the level of social, environmental and socio-environmental disclosure, the data were normalized for the formation of payment matrices. The normalization was done by dividing each value obtained by the companies by the maximum of the group in each criterion, i.e.,xi,j =maxxi,j
Table 1–Metrics for the analysis of social disclosure. (Source: Adapted from Rover (2013)).
Categories Subcategories
Community(s1)
Volunteering programs
Sponsoring public health projects Relations with indigenous peoples / Relations with quilombola peoples
Sponsoring conferences or seminars or exhibitions or campaigns Donations of resources to public entities or OSCIP
(Civil Society Organization for Public Interest) Supporting education
Giving housing support / food support Supporting culture
Supporting sports activities Relationship with stakeholders
Decisions or fines related to the community in which it operates Investments of a social character
Diversity(s2)
Number of women or minorities in the workforce
Occupation of women or minorities in management positions Proportion of salary between men and women
Hiring people with disabilities
Non-discrimination policies against minorities
Product, services and consumers(s3)
Quality Program – ISO 9000 / Quality Program – ISO 9.001 Product Innovation (Research & Development)
Products in accordance with safety standards Consumer satisfaction or dissatisfaction Unfair competition or trust practices
Relations with employees(s4)
Number of employees / Employees’ length of service / Age group of employees
Payment of employees (average or total) Trade union relations or with class agencies Programs to encourage culture
Development of recreational or sports activities Employee Education / Employee Training
Health in the workplace / Hygiene in the workplace / Safety in the workplace
Accidents at work / Occupational diseases / Absenteeism / Deaths Retirement or supplementary pension plans
Childcare aid for children of employees / Scholarship for children of employees Maternity Support / Paternity Support Profit sharing
Turnover rate / Resignation policy
Employee participation in managerial decisions Job satisfaction / Employee motivation
Child labor or forced labor or analogous to slavery Investments in managerial development
Table 2–Metrics for the analysis of environmental disclosure. (Source: Adapted from Rover (2013)).
Categories Subcategories
Environmental policies(a1)
Statement of current policies / Statement of current practices or actions
Setting goals / Establishing environmental objectives Environmental certification /
Compliance with environmental laws and regulations Partnerships, councils, environmental forums Environmental awards /
Participation in environmental indexes Participation in environmental organizations Environmental relationship with stakeholders
Environmental management
Environmental risk management
and auditing(a2)
ISO 14.000
Environmental Performance Indicators Environmental review or environmental audits Evaluation including independent opinion
Environmental impacts(a3)
Waste / Residue Leaks / Spills / Land used Repairs to environmental damage Emission of Greenhouse Gases (GHG)
Emission of substances that deplete the ozone layer
Ecological products(a4)
Development of ecological products Recycling
Packaging process (reuse of packaging) Efficient use or reuse of water
Energetic resources(a5)
Development or exploitation of new energy sources Use of material waste for the production of energy Consumption of energy from renewable sources Company’s efforts to reduce energy consumption Environmental education Environmental education (internally or community) and research(a6) Support for research related to the environment
Carbon credits market(a7)
Clean Development Mechanism Projects (CDM) Reduced Emissions Certificates (RECs) Carbon credits or carbon offsets
Sustainability and
Mention related to sustainable development
biodiversity(a8)
Forest management or reforestation Preservation of biodiversity / Preservation of natural resources
Environmental financial
Environmental investments
information(a9)
Environmental revenues
Environmental costs / Environmental expenditures Liabilities or environmental contingencies Accounting practices of environmental items – measurement criteria
Table 3–Criteria for linear weighting. (Source: Adapted from Rover (2013)).
Criteria Linear
No disclosure 0
Qualitative disclosures 1 Non-monetary quantitative disclosures 2 Monetary quantitative disclosures 3
3.3.2 Market Value of Companies
The word value, in the accounting, economic and legal context is very broad, which leads to it having different meanings (Neiva, 1999). According to Neiva (1999) it is necessary to use some terms to better explain the meaning of value, such as: real value, current value, intrinsic value, book value, settlement value, market value, among others.
The market value of an organization in the capital market refers to the value that the investor is willing to pay for the company (Chaves & Pimenta Junior, 2013). Regarding this, Santos, Ara´ujo & Leite Filho (2016) mention that investors generally pay for the organization according to the expectations generated by them through the information available in the market.
The variable used in this research to measure the companies’ market value was the share price multiplied by the number of shares on December 31. The date of December 31 was chosen, since there is a need to use a moment in which all the information evidenced has already been absorbed by the market. Therefore, due to the use of reports that are not mandatory by law, which do not have a specific period for disclosure, it was decided to carry out the market value analysis on December 31 and December of the year following the report.
In order to analyze the association between the level of social, environmental and socio-environ-mental disclosure with market value, the market value of 2014 was used in relation to the disclo-sure of 2013 and the market value of 2015 in relation to the disclodisclo-sure of 2014. This is justified since the report is released during the following year. The information regarding the market value was collected in the Econom´aticadatabase.
3.4 Data Analysis Procedures
In this section we present the techniques used in the research to achieve the proposed objective. In the first moment, the ranking conducted by means of scalar and vector games is highlighted. Afterwards, we present Kendall’s correlation, which was used to verify the association between the study variables.
to Zeleny (1982), games in which the payments received by players are represented by vectors and not by scalars are called vector games, multicriteria games or games with multiple payments. Vector games differ from scalar games because of the payment structure, which is enough so that many of the results of scalar games can not be extended directly to vector games because there is no order among vector payments, resulting in new concepts and solution procedures (Monroy & M´armol, 1999; Puerto, Hinojosa, M´armol, Monroy & Fern´andez, 1999; Monroy, M´armol & Rubiales, 2008).
3.4.1 Preliminaries of Game Theory Scalar games
Let P =(ai j);i =1, . . . ,n,j =1, . . . ,mbe the payment matrix of a zero-sum two-personal game and the mixed strategy sets for both player I and player II are respectively:
X =
x ∈Rn
n
i=1
xi =1,xi ≥0,i=1, . . . ,n
(1)
Y =
y∈ Rm
m
j=1
yj =1,yj ≥0,j =1, . . . ,m
(2)
The expected payment of the game when player I uses his mixed strategyx =(x1, . . . ,xn)and player II uses his mixed strategyy=(y1, . . . ,yn), is given by:
v(x,y)=xtPy= n i=1
m
j=1
xiai jyj∀x∈ X, ∀y∈Y (3)
For each mixed strategy, x ∈ X, the level of security for player I is v(x) = miny∈YxtPy. This player looks for strategies that provide him/her with the best level of security, i.e. strate-gies x ∈ X that maximizev(x). To him/her this must solve the problem maxx∈X v(x)s.t. v(x)=min1≤j≤mni=1xiai j. By making the change and variablev =min1≤j≤mni=1xiai j, the solution of the following equivalent linear problem provides the optimal security strategies:
max v
s.t. n i=1
xiai j ≥v, j =1, . . . ,m
n i=1
xi =1, xi ≥0, i =1, . . . ,n
Vector Games
Let a two-personal game of zero sum be in normal form and letP =(ai j); 1≤i≤n, 1≤ j ≤m be the matrix of payments of the game. Each elementai jof the matrix is a vector ofkdimension (Fern´andez & Puerto, 1996):
ai j =(ai j(1),ai j(2), . . . ,ai j(k))∈Rk (5)
which determineskmatrices ofn×morder in the form:
P(p)=(ai j(p))1≤ p≤k;1≤i ≤n;1≤ j ≤m (6)
The expected payment of the game when players choose their mixed strategiesx∈ Xandy∈Y, respectively, is given by:
v(x,y)=xtP y=(v1(x,y), . . . , vk(x,y)) (7)
where:
vp(x,y)=xtP(p)y;p =1, . . . ,k (8)
For eachx ∈ X strategy of player I the security level vector for that player is the payment that can guarantee in each scalar game induced by the vector gamev(x)=(v1(x), . . . , vk(x))where vp(x)=miny∈Yvp(x,y)=miny∈YxtP(p)y.
The optimal strategies and their associated security level vector are obtained from the following linear multi-objective problem
max v1, . . . , vk
s.t. xtP(p)≥(vp, . . . , vp);p=1, . . . ,k n
i=1
xi =1;xi ≥0
(9)
A classic procedure for obtaining solutions to multiobjective problems is the programming by compromise (Zeleny, 1976). It is based on considering the points closest to an ideal point of reference. In this case we consider the scalar problem that minimizes the distance, considering theL1metric, between the security level vectorv(x)=(v1(x), . . . , vk(x))and an ideal payment vectorv∗(x)=(v1∗, . . . , vk∗), wherev∗p=maxx∈Xvp(x), p=1, . . . ,k,
min v
∗ 1−v1(x)
v1∗
+v
∗ 2−v2(x)
v∗2
+ · · · +v
∗
k−vk(x)
v∗k
s.t. xtP(p)≥(vp, . . . , vp);p=1, . . . ,k n
i=1
xi =1;xi ≥0
3.4.2 Construction of the Model
In the current context, Game Theory has been applied in several areas of knowledge, such as administration, biology, political sciences, law and economics (Fiani, 2004), it has also has been developed within the area of Operational Research (Dimand & Dimand, 1996). According to Brandt, Fischer, Harrenstein & Shoham (2009), Kreuzberg (2013), Kroenke (2014) and Rubiales, Monroy & M´armol (2017) it can be used today as a ranking technique.
In this research, the scalar games technique was used for the development of rankings referring to social disclosure and rankings related to environmental disclosure. In addition, in order to rank companies according to the level of socio-environmental disclosure, the technique of vec-tor games was used. For Leoneti (2016), to choose multicriteria decision methods involves the observation of key factors, given the variability of methods, such as ability with method, need for conflict minimization and need for transparency. The methods may be sensitive when small variations occur in the input and alert data that different classifications can be obtained when different multicriteria decision methods are applied to obtain rankings.
According to Kroenke (2014), the scoring technique through scalar games is used when there is only one payment per indicator, or allotments of indicators. In this study, they are represented by means of allotments of levels of social and environmental disclosure when analyzed separately. In the scalar game related to social disclosure, four (4) strategies were assumed, each being a social indicator: community(s1), diversity(s2), “product, services and consumers”(s3)and re-lationships with employees (s4). Nine (9) strategies were attributed to the scalar game related
to the environmental disclosure given by the indicators: environmental policies (a1), environ-mental management and auditing(a2), environmental impacts (a3), ecological products (a4),
energetic resources(a5), environmental education and research(a6), carbon credits market(a7),
sustainability and biodiversity(a8)and environmental financial information(a9).
According to Kreuzberg (2013), in order to find the solution to scalar games and thus elaborate the rankings by means of such technique, it is necessary to construct the matrix of payments, in which the strategies of the Player I will be distributed in the lines and the Strategies of the Player II, in the columns. The following are two payment matrices (PS: social; PA: environmental), each with a single payment per line and column.
PS = ⎛ ⎜ ⎜ ⎜ ⎜ ⎝
s1,1 s1,2 · · · s1,4
s2,1 s2,2 · · · s2,4 ..
. ... . .. ...
s24,1 s24,2 · · · s24,4
⎞ ⎟ ⎟ ⎟ ⎟ ⎠
; PA=
⎛ ⎜ ⎜ ⎜ ⎜ ⎜ ⎝
a1,1 a1,2 · · · a1,9
a2,1 a2,2 ... ...
· · · a2,9 . .. ...
a24,1 a24,2 · · · a24,9
⎞ ⎟ ⎟ ⎟ ⎟ ⎟ ⎠ (11)
Games against nature are locked against some entity that is not specifically a rational human player, but rather a game from a “point of view in which the decision maker plays against the diabolic nature” (Luce & Raiffa, 1957, p. 279). Ostolaza (1969, p. 10) states that “Nature is passive, in the sense that it does not affect neither gains nor losses of the game”.
The verification of the optimal strategies in the scalar game for Player I is obtained by solving the Linear Programming Problem (LPP) (Magro, Gorla, Kroenke & Hein, 2015). The following LPP brings the primal model of the game that the 24 companies play with the four social indicators:
max vS s.t.
s1,1x1+s2,1x2+ · · · +s24,1x24≥vs s1,2x1+s2,2x2+ · · · +s24,2x24≥vs
..
. ... + · · · + ... ≥ ...
s1,4x1+s2,4x2+ · · · +s24,4x24≥vs x1+x2+ · · · +x24=1
x1,x2, . . . ,x24≥0
(12)
In a similar way, the PPL was constructed, and it models the primal game established between the 24 companies of the sample, against the nine (9) environmental indicators:
max vA s.t.
a1,1x1+a2,1x2+ · · · +a24,1x24≥va a1,2x1+a2,2x2+ · · · +a24,2x24≥va
..
. ... + · · · + ... ≥ ...
a1,9x1+a2,9x2+ · · · +a24,9x24≥va x1+x2+ · · · +x24=1
x1,x2, . . . ,x24≥0
(13)
In this research the LPPs were solved through PLM 3.0 software (Programac¸˜ao Linear Mista v.3.0). After checking the optimal strategy suggested: pure or mixed for Player I in the first round, the company (pure strategy) or companies (mixed strategy) that are presented as op-timal strategies were removed from the problem. In a recurrent way, the LPP was successively executed until the complete formation of the ranking.
For the construction of the rankings of companies, according to the levels of social and environ-mental disclosure, the vector games were used, taking two allotments of indicators: social and environmental. Vector games are used when the payment is not unique, that is, there are two or more payments. In the research, the allotments of social and environmental indicators were assumed as possible strategies and payments as their indicators, i.e., four (4) payments for the social strategy and nine (9) payments in the environmental strategy.
by indicators: community(s1), diversity(s2), “product, services and consumers”(s3)and
rela-tions with employees(s4). The environmental strategy has 9 payments, given by indicators:
en-vironmental policies(a1), environmental management and auditing(a2), environmental impacts (a3), ecological products(a4), energetic resources(a5), environmental education and research (a6), carbon credits market(a7), sustainability and biodiversity(a8)and environmental financial information(a9). The multiple payment matrix scheme is shown below:
P= ⎛ ⎜ ⎜ ⎜ ⎜ ⎝
(s1,1,s1,2, . . . ,s1,4) (a1,1,a1,2, . . . ,a1,9) (s2,1,s2,2, . . . ,s2,4) (a2,1,a2,2, . . . ,a2,9)
..
. ...
(s24,1,s24,2, . . . ,s24,4) (a24,1,a24,2, . . . ,a24,9)
⎞ ⎟ ⎟ ⎟ ⎟ ⎠
(14)
In a similar way to the scalar game, in the matrix presented in relation to the vector game Player I (companies of the sector) makes its choices in light of the strategies presented in the lines, while Player II (allotments of indicators) makes its choices in light of the strategies distributed in the columns. However, by presenting more than one allotment of indicators, the Linear Programming Problem used to verify the optimal strategies is adjusted according to what was modeled by Kroenke, Hein & Wilhelm (2015).
max v1, . . . , vk s.t.
xt P(p)≥(v1, . . . , vk); p=1, . . . ,k; k=1, . . . ,n(allotments of indicators)
n i=1
xi =1;xi ≥0
(15)
Specifically for this game we consider thatk =2, where the first allotment of indicators has 4 elements, which are taken as payments and the second one 9 indicators, that is, considered in the research as payments. The model used is described below:
max vS, vA s.t.
s1,1x1+s2,1x2+ · · · +s24,1x24≥vS s1,2x1+s2,2x2+ · · · +s24,2x24≥vS
..
. ... + · · · + ... ≥ ...
s1,4x1+s2,4x2+ · · · +s24,4x24≥vS a1,1x1+a2,1x2+ · · · +a24,1x24≥vA a1,2x1+a2,2x2+ · · · +a24,2x24≥vA
..
. ... + · · · + ... ≥ ...
a1,9x1+a2,9x2+ · · · +a24,9x24≥vA x1+x2+ · · · +x24=1
x1,x2, . . . ,x24≥0
Unlike Kroenke, Hein & Wilhelm (2015), who adapted this LPP to make use of the value of the information found by means of the variance of the normalized data of each allotment of indicators for the construction of the objective function, in this research the multi-objective optimization was used by means of global criterion with the normalized data. Multi-objective optimization refers to a problem in which there are two or more objectives to be optimized (maximized or minimized) simultaneously (Azuma, 2011). According to Antunes & Alves (2012), this opti-mization problem is generally used since in real problems there are usually multiple optics to evaluate the merits of the permissible solutions.
It should be mentioned that the objectives to be optimized in multi-objective optimization prob-lems are usually conflicting, since there is usually not a single optimal solution that simultane-ously meets all the objectives (Amorim, Romero & Mantovani, 2009). In light of this type of problem Rao (1996) described the Global Criteria Method, in which the optimal solution is evi-denced by minimizing a pre-established criterion. According to Carmelossi (2014) by means of such a method it is possible to obtain the closest solution possible to the ideal solution.
For the linear problem of the previous bi-criteria game, the problem that gives the compromise solution is:
min v
∗
S−vS(x)
v∗
S
+v
∗
A−vA(x)
v∗
A
s.t.
s1,1x1+s2,1x2+ · · · +s24,1x24≥vS s1,2x1+s2,2x2+ · · · +s24,2x24≥vS
..
. ... + · · · + ... ≥ ...
s1,4x1+s2,4x2+ · · · +s24,4x24≥vS a1,1x1+a2,1x2+ · · · +a24,1x24≥vA a1,2x1+a2,2x2+ · · · +a24,2x24≥vA
..
. ... + · · · + ... ≥ ...
a1,9x1+a2,9x2+ · · · +a24,9x24≥vA x1+x2+ · · · +x24=1
x1,x2, . . . ,x24 ≥0
(17)
As in scalar games, the multi-objective LPP was solved through PLM v.3.0. In addition, the form of ranking was the same one adopted for the scalar games, since the company or the companies that presented themselves as optimal strategies were removed from the problem, conducting it again until the complete formation of the rankings.
3.4.3 Kendall Correlation
According to Kaveski (2013) Kendall’s correlation coefficient is defined by three steps, the first being the statistical test S, which measures the monotonic dependence between the variable Y in relation to the variable X. In order to verify such dependency, the difference between the number of discordant pairs by the number of matching pairs is calculated.
The second step refers to the calculation that determines the Kendall correlation coefficient, given by:
τ = S
n(n−1)
2
(18)
where:
τ the Kendall correlation coefficient;
S relation of the orders found (monotonous dependence); and n sample size.
Finally, the last step regarding this technique concerns the measurement of the significance of the Kendall correlation coefficient, which is evaluated by means of a two-tailed hypothesis test that checks if S is statistically different from zero (Kaveski, 2013). As mentioned by Martins & The´ophilo (2007), Kendall’s correlation coefficient can vary from−1 to 1, in which values close to 1 indicate concordance between variables, while values close to−1 indicate aversion of their values. It should be noted that the Statistical Package for the Social Sciences (SPSS) was used to perform the Kendall correlation method.
4 PRESENTATION AND ANALYSIS OF RESULTS
This chapter presents the results obtained in the study, whose purpose was to establish the as-sociation of social, environmental and socio-environmental disclosure with the market value of Brazilian companies with high environmental impact. To do so, it was necessary to divide this chapter into two sections, the first section presenting the social, environmental, socio-environ-mental and market value rankings, and in the second section the results obtained through Kendall’s correlation.
4.1 Rankings
The data that formed the payment matrices for social, environmental and socio-environmental disclosure levels for 2013 are shown in Table 4.
Table 4–Data of payment matrices of social, environmental and socio-environmental disclo-sure level of 2013. (Source: Research data).
Companies Social Restrictions Environmental Restrictions
s1 s2 s3 s4 a1 a2 a3 a4 a5 a6 a7 a8 a9
PARANAPANEMA(x1) 0.15 0.55 0.20 0.48 0.42 0.50 0.13 0.80 0.22 0.00 0.00 0.29 0.30
PANATLANTICA(x2) 0.00 0.00 0.00 0.02 0.00 0.00 0.00 0.00 0.00 0.00 0.00 0.00 0.00
COSAN(x3) 0.56 1.00 1.00 0.86 0.84 0.63 0.53 1.00 0.78 0.50 0.00 0.57 0.90
PETRORIO(x4) 0.00 0.00 0.00 0.05 0.11 0.13 0.00 0.00 0.00 0.17 0.00 0.14 0.00
PETROBRAS(x5) 0.74 0.73 0.30 0.98 0.89 0.75 1.00 0.80 0.44 0.50 0.00 0.29 0.60
QGEP PART(x6) 0.78 0.91 0.80 0.98 0.84 0.50 0.67 0.40 0.00 1.00 0,00 0.57 0.70
ULTRAPAR(x7) 0.33 0.00 0.40 0.31 0.42 0.50 0.33 0.40 0.11 00.0 0.33 0.00 0.70
FER HERINGER(x8) 0.33 0.73 0.40 0.67 0.42 0.13 0.53 0.80 0.67 0.17 0.00 0.86 0.30
BR PHARMA(x9) 0.11 0.00 0.00 0.12 0.00 0.00 0.00 0.00 0.00 0.00 0.00 0.00 0.00
CREMER(x10) 0.00 0.00 0.00 0.21 0.00 0.00 0.00 0.00 0.00 0.00 0.00 0.00 0.00
DIMED(x11) 0.04 0.00 0.00 0.07 0.11 0.00 0.00 0.00 0.00 0.00 0.00 0.00 0.00
PROFARMA(x12) 0.41 0.00 0.10 0.17 0.00 0.00 0.00 0.00 0.00 0.00 0.00 0.00 0.00
RAIADROGASIL(x13) 0.22 0.18 0.00 0.12 0.00 0.00 0.13 0.00 0.00 0.00 0.00 0.00 0.00
BRADESPAR(x14) 0.04 0.00 0.00 0.00 0.11 0.00 0.00 0.00 0.11 0.00 0.00 0.14 0.00
VALE(x15) 1.00 0.73 0.50 0.88 1.00 0.88 1.00 0.40 1.00 0.67 0.33 0.86 0.40
CELUL IRANI(x16) 0.56 0.82 0.90 0.81 0.58 1.00 0.87 0.60 0.67 1.00 1.00 0.86 0.90
FIBRIA(x17) 0.63 0.36 0.50 0.67 1.00 0.63 0.47 0.20 0.22 0.83 0.00 1.00 0.10
KLABIN(x18) 0.41 0.45 0.30 0.31 0.89 0.63 0.33 0.20 0.33 0.33 0.00 0.71 0.40
BRASKEM(x19) 0.67 0.55 0.60 0.67 0.79 0.75 0.93 0.80 0.56 0.67 0.00 0.57 1.00
ELEKEIROZ(x20) 0.48 0.45 0.30 0.86 0.32 0.63 0.53 0.00 0.11 0.67 0.00 0.29 0.60
NATURA(x21) 0.78 0.82 1.00 1.00 0.89 0.38 0.53 0.60 0.44 0.33 1.00 0.43 0.40
VITALYZE.ME(x22) 0.11 0.00 0.00 0.00 0.00 0.00 0.13 0.00 0.00 0.00 0.00 0.00 0.00
UNIPAR(x23) 0.00 0.00 0.30 0.19 0.00 0.13 0.00 0.00 0.00 0.00 0.00 0.00 0.30
GERDAU(x24) 0.44 0.00 0.40 0.55 0.53 0.13 0.07 0.40 0.33 0.50 0.00 0.57 1.00
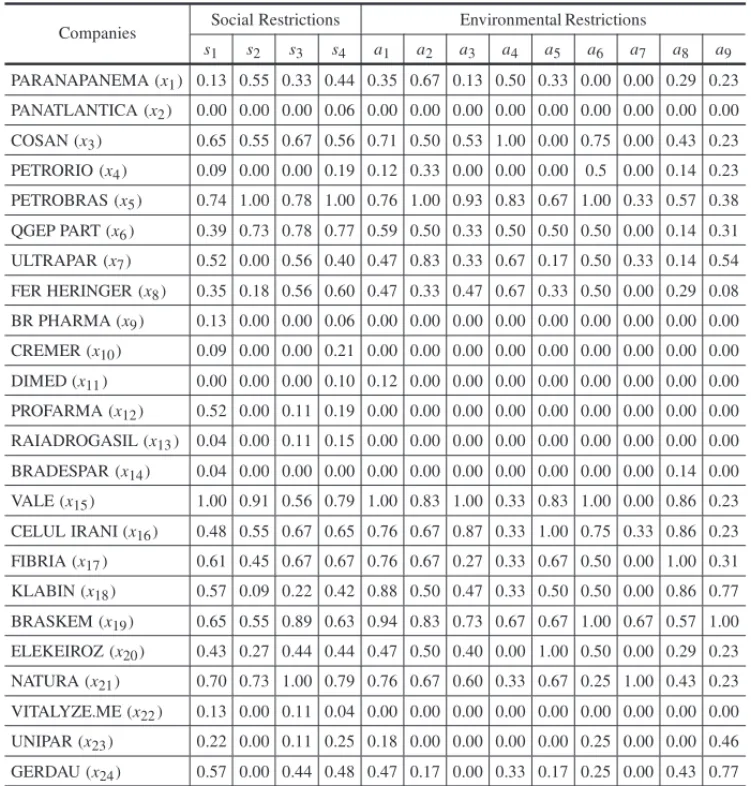
In a similar way to the data presented in Table 5, the payment matrices and respective rankings of social, environmental and socio-environmental disclosure levels for 2014 were formed. With the information previously mentioned, the resolution of the models to obtain the social, environmental and social-environmental rankings of the companies that will be presented in the next sections began.
Table 5–Data of payment matrices of the level of social, environmental and socio-environ-mental disclosure of 2014. (Source: Research data).
Companies Social Restrictions Environmental Restrictions
s1 s2 s3 s4 a1 a2 a3 a4 a5 a6 a7 a8 a9
PARANAPANEMA(x1) 0.13 0.55 0.33 0.44 0.35 0.67 0.13 0.50 0.33 0.00 0.00 0.29 0.23
PANATLANTICA(x2) 0.00 0.00 0.00 0.06 0.00 0.00 0.00 0.00 0.00 0.00 0.00 0.00 0.00
COSAN(x3) 0.65 0.55 0.67 0.56 0.71 0.50 0.53 1.00 0.00 0.75 0.00 0.43 0.23
PETRORIO(x4) 0.09 0.00 0.00 0.19 0.12 0.33 0.00 0.00 0.00 0.5 0.00 0.14 0.23
PETROBRAS(x5) 0.74 1.00 0.78 1.00 0.76 1.00 0.93 0.83 0.67 1.00 0.33 0.57 0.38
QGEP PART(x6) 0.39 0.73 0.78 0.77 0.59 0.50 0.33 0.50 0.50 0.50 0.00 0.14 0.31
ULTRAPAR(x7) 0.52 0.00 0.56 0.40 0.47 0.83 0.33 0.67 0.17 0.50 0.33 0.14 0.54
FER HERINGER(x8) 0.35 0.18 0.56 0.60 0.47 0.33 0.47 0.67 0.33 0.50 0.00 0.29 0.08
BR PHARMA(x9) 0.13 0.00 0.00 0.06 0.00 0.00 0.00 0.00 0.00 0.00 0.00 0.00 0.00
CREMER(x10) 0.09 0.00 0.00 0.21 0.00 0.00 0.00 0.00 0.00 0.00 0.00 0.00 0.00
DIMED(x11) 0.00 0.00 0.00 0.10 0.12 0.00 0.00 0.00 0.00 0.00 0.00 0.00 0.00
PROFARMA(x12) 0.52 0.00 0.11 0.19 0.00 0.00 0.00 0.00 0.00 0.00 0.00 0.00 0.00
RAIADROGASIL(x13) 0.04 0.00 0.11 0.15 0.00 0.00 0.00 0.00 0.00 0.00 0.00 0.00 0.00
BRADESPAR(x14) 0.04 0.00 0.00 0.00 0.00 0.00 0.00 0.00 0.00 0.00 0.00 0.14 0.00
VALE(x15) 1.00 0.91 0.56 0.79 1.00 0.83 1.00 0.33 0.83 1.00 0.00 0.86 0.23
CELUL IRANI(x16) 0.48 0.55 0.67 0.65 0.76 0.67 0.87 0.33 1.00 0.75 0.33 0.86 0.23
FIBRIA(x17) 0.61 0.45 0.67 0.67 0.76 0.67 0.27 0.33 0.67 0.50 0.00 1.00 0.31
KLABIN(x18) 0.57 0.09 0.22 0.42 0.88 0.50 0.47 0.33 0.50 0.50 0.00 0.86 0.77
BRASKEM(x19) 0.65 0.55 0.89 0.63 0.94 0.83 0.73 0.67 0.67 1.00 0.67 0.57 1.00
ELEKEIROZ(x20) 0.43 0.27 0.44 0.44 0.47 0.50 0.40 0.00 1.00 0.50 0.00 0.29 0.23
NATURA(x21) 0.70 0.73 1.00 0.79 0.76 0.67 0.60 0.33 0.67 0.25 1.00 0.43 0.23
VITALYZE.ME(x22) 0.13 0.00 0.11 0.04 0.00 0.00 0.00 0.00 0.00 0.00 0.00 0.00 0.00
UNIPAR(x23) 0.22 0.00 0.11 0.25 0.18 0.00 0.00 0.00 0.00 0.25 0.00 0.00 0.46
GERDAU(x24) 0.57 0.00 0.44 0.48 0.47 0.17 0.00 0.33 0.17 0.25 0.00 0.43 0.77
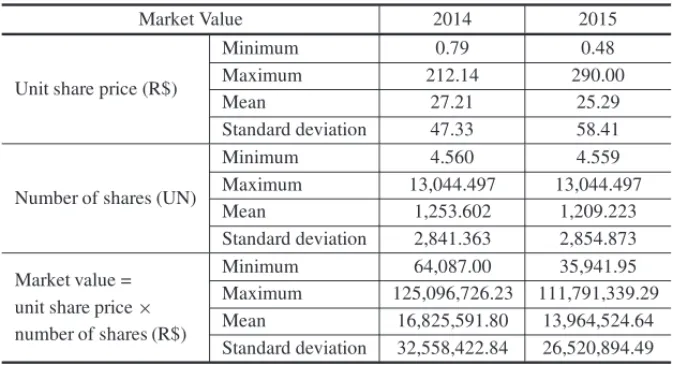
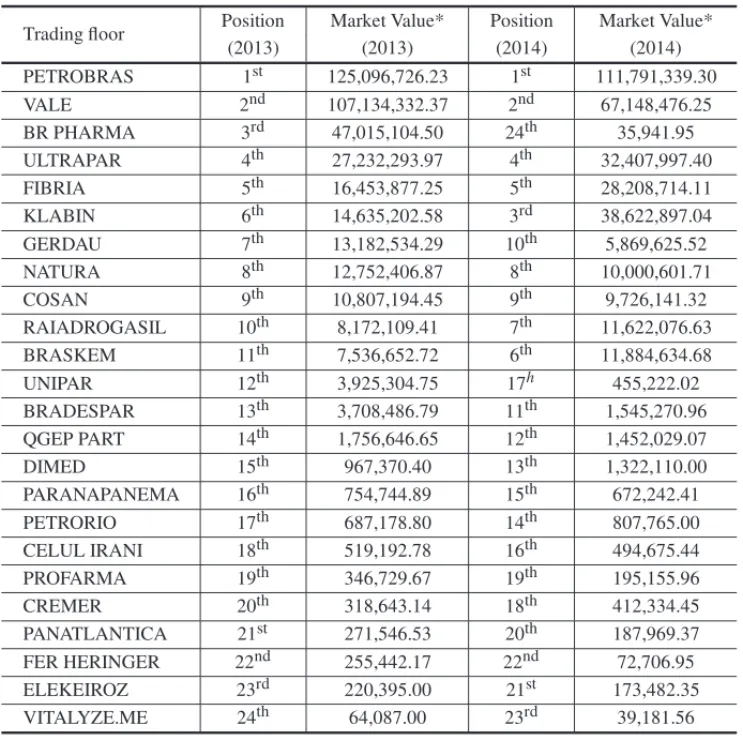
It should be noted that the market value was obtained by the product between the ’unit price of the stock’ and the ’quantity of shares’ of the organization dated December 31 of each year, which were collected through the Econom´aticadatabase. Unlike the rankings cited above, because it did not present several groups of information, the construction of the rankings of the companies regarding the variable market value was organized by distributing the companies in a decreasing way in relation to this variable.
4.1.1 Companies by Level of Social Disclosure
Table 6–Information regarding the stocks of the companies that composed the sample. (Source: Research data).
Market Value 2014 2015
Unit share price (R$)
Minimum 0.79 0.48
Maximum 212.14 290.00
Mean 27.21 25.29
Standard deviation 47.33 58.41
Number of shares (UN)
Minimum 4.560 4.559
Maximum 13,044.497 13,044.497
Mean 1,253.602 1,209.223
Standard deviation 2,841.363 2,854.873
Market value = Minimum 64,087.00 35,941.95 unit share price× Maximum 125,096,726.23 111,791,339.29 number of shares (R$) Mean 16,825,591.80 13,964,524.64
Standard deviation 32,558,422.84 26,520,894.49
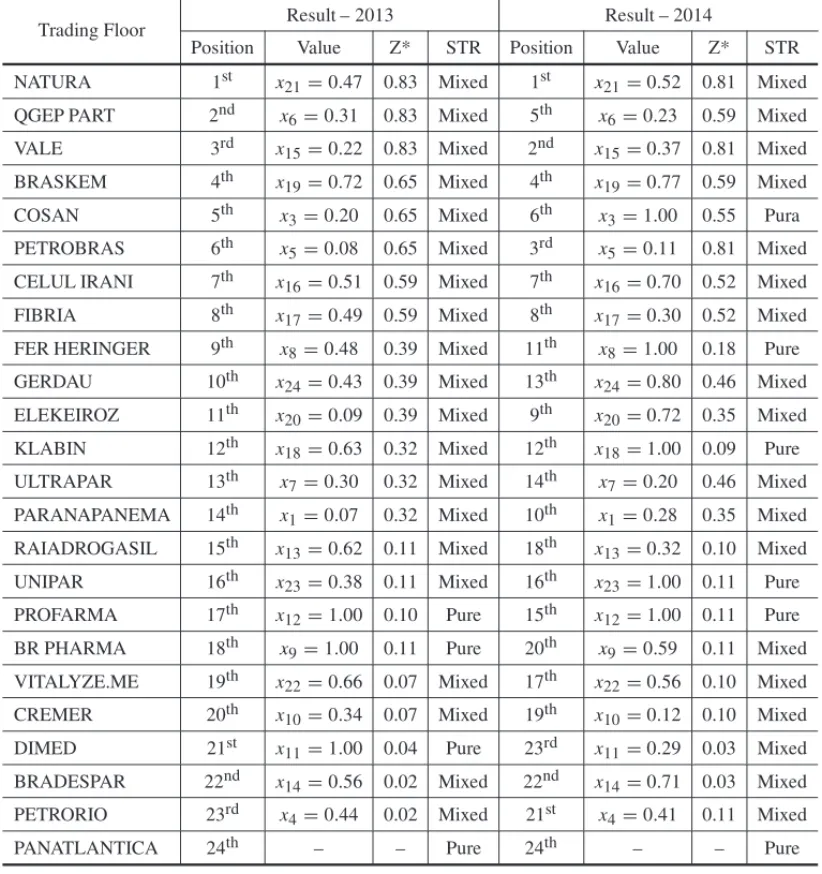
Table 7 shows the rankings formed according to the level of social disclosure of the companies that composed the sample in the years of 2013 and 2014.
It can be seen from Table 7 that the company that presented in both years the highest social disclosure indexes, according to the Rover metric (2013) and the scalar games technique, was Natura. Besides Natura, Braskem (4th), Celul Irani (7th), Fibria (8th), Klabin (12th), Unipar (16th), Bradespar (22nd) and Panatlantica (24th) also did not change their ranking positions from the year 2013 to the ranking of the year 2014.
The other companies investigated varied their positions from 2013 to 2014, as is the case of the Qgep Part that changed its position as the 2ndcompany with the highest social disclosure index in 2013 to the company with the 5thhighest social disclosure index in 2014. However, it should be noted that among the five companies that occupied the top positions in the 2013 ranking, four remained among the five best positions of the following year and among the five companies with the worst positions in the 2013 ranking, four remained in positions in the year 2014.
In light of the findings in Table 7, it should be noted that the organizations that generally ranked highest in the rankings were companies that showed an Annual Report or Sustainability Report. On the other hand, the organizations with the inferior positions of the rankings of 2013 and 2014 were those that did not disclose such reports during the investigated years.
4.1.2 Companies by Level of Environmental Disclosure
Table 7–Rankings of companies in relation to the level of social disclosure. STR = Strategy. (Source: Research data).
Trading Floor Result – 2013 Result – 2014
Position Value Z* STR Position Value Z* STR
NATURA 1st x21 =0.47 0.83 Mixed 1st x21=0.52 0.81 Mixed
QGEP PART 2nd x6=0.31 0.83 Mixed 5th x6=0.23 0.59 Mixed
VALE 3rd x15 =0.22 0.83 Mixed 2nd x15=0.37 0.81 Mixed
BRASKEM 4th x19 =0.72 0.65 Mixed 4th x19=0.77 0.59 Mixed
COSAN 5th x3=0.20 0.65 Mixed 6th x3=1.00 0.55 Pura
PETROBRAS 6th x5=0.08 0.65 Mixed 3rd x5=0.11 0.81 Mixed
CELUL IRANI 7th x16 =0.51 0.59 Mixed 7th x16=0.70 0.52 Mixed
FIBRIA 8th x17 =0.49 0.59 Mixed 8th x17=0.30 0.52 Mixed
FER HERINGER 9th x8=0.48 0.39 Mixed 11th x8=1.00 0.18 Pure
GERDAU 10th x24 =0.43 0.39 Mixed 13th x24=0.80 0.46 Mixed
ELEKEIROZ 11th x20 =0.09 0.39 Mixed 9th x20=0.72 0.35 Mixed
KLABIN 12th x18 =0.63 0.32 Mixed 12th x18=1.00 0.09 Pure
ULTRAPAR 13th x7=0.30 0.32 Mixed 14th x7=0.20 0.46 Mixed
PARANAPANEMA 14th x1=0.07 0.32 Mixed 10th x1=0.28 0.35 Mixed
RAIADROGASIL 15th x13 =0.62 0.11 Mixed 18th x13=0.32 0.10 Mixed
UNIPAR 16th x23 =0.38 0.11 Mixed 16th x23=1.00 0.11 Pure
PROFARMA 17th x12 =1.00 0.10 Pure 15th x12=1.00 0.11 Pure
BR PHARMA 18th x9=1.00 0.11 Pure 20th x9=0.59 0.11 Mixed
VITALYZE.ME 19th x22 =0.66 0.07 Mixed 17th x22=0.56 0.10 Mixed
CREMER 20th x10 =0.34 0.07 Mixed 19th x10=0.12 0.10 Mixed
DIMED 21st x11 =1.00 0.04 Pure 23rd x11=0.29 0.03 Mixed
BRADESPAR 22nd x14 =0.56 0.02 Mixed 22nd x14=0.71 0.03 Mixed
PETRORIO 23rd x4=0.44 0.02 Mixed 21st x4=0.41 0.11 Mixed
PANATLANTICA 24th – – Pure 24th – – Pure
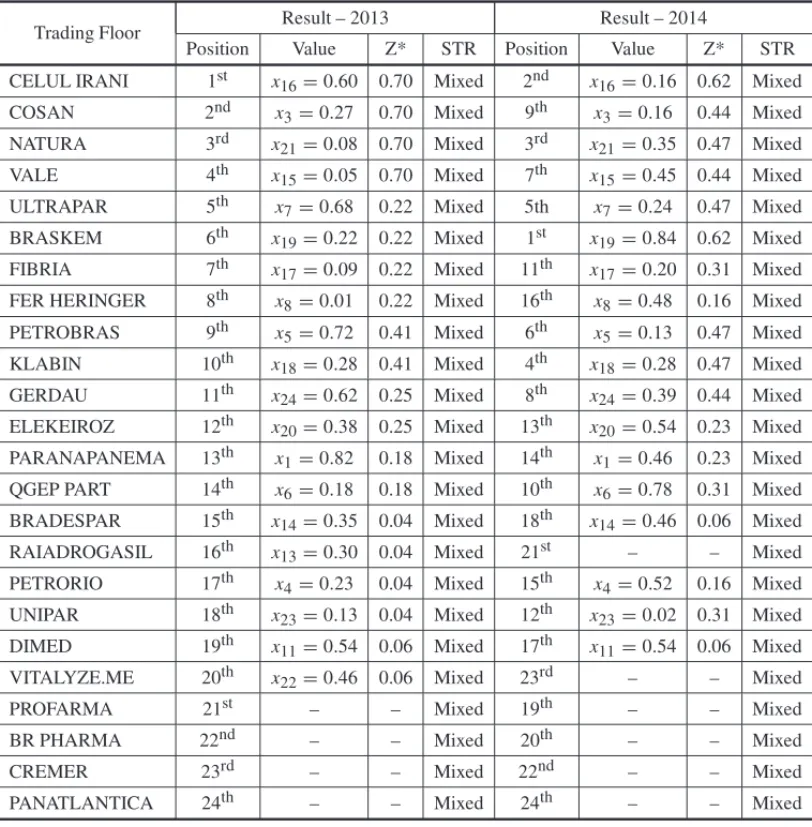
Table 8–Rankings of companies in relation to the level of environmental disclosure. STR = Strategy. (Source: Research data).
Trading Floor Result – 2013 Result – 2014
Position Value Z* STR Position Value Z* STR
CELUL IRANI 1st x16=0.60 0.70 Mixed 2nd x16=0.16 0.62 Mixed
COSAN 2nd x3=0.27 0.70 Mixed 9th x3=0.16 0.44 Mixed
NATURA 3rd x21=0.08 0.70 Mixed 3rd x21=0.35 0.47 Mixed
VALE 4th x15=0.05 0.70 Mixed 7th x15=0.45 0.44 Mixed
ULTRAPAR 5th x7=0.68 0.22 Mixed 5th x7=0.24 0.47 Mixed
BRASKEM 6th x19=0.22 0.22 Mixed 1st x19=0.84 0.62 Mixed
FIBRIA 7th x17=0.09 0.22 Mixed 11th x17=0.20 0.31 Mixed
FER HERINGER 8th x8=0.01 0.22 Mixed 16th x8=0.48 0.16 Mixed
PETROBRAS 9th x5=0.72 0.41 Mixed 6th x5=0.13 0.47 Mixed
KLABIN 10th x18=0.28 0.41 Mixed 4th x18=0.28 0.47 Mixed
GERDAU 11th x24=0.62 0.25 Mixed 8th x24=0.39 0.44 Mixed
ELEKEIROZ 12th x20=0.38 0.25 Mixed 13th x20=0.54 0.23 Mixed
PARANAPANEMA 13th x1=0.82 0.18 Mixed 14th x1=0.46 0.23 Mixed
QGEP PART 14th x6=0.18 0.18 Mixed 10th x6=0.78 0.31 Mixed
BRADESPAR 15th x14=0.35 0.04 Mixed 18th x14=0.46 0.06 Mixed
RAIADROGASIL 16th x13=0.30 0.04 Mixed 21st – – Mixed
PETRORIO 17th x4=0.23 0.04 Mixed 15th x4=0.52 0.16 Mixed
UNIPAR 18th x23=0.13 0.04 Mixed 12th x23=0.02 0.31 Mixed
DIMED 19th x11=0.54 0.06 Mixed 17th x11=0.54 0.06 Mixed
VITALYZE.ME 20th x22=0.46 0.06 Mixed 23rd – – Mixed
PROFARMA 21st – – Mixed 19th – – Mixed
BR PHARMA 22nd – – Mixed 20th – – Mixed
CREMER 23rd – – Mixed 22nd – – Mixed
PANATLANTICA 24th – – Mixed 24th – – Mixed
It should also be noted that, similarly to social disclosure rankings, in the rankings of environ-mental disclosure levels, there were companies that remained in the same position in both of the analyzed periods. Among these companies was Natura that remained in both years in 3rdplace, as well as Ultrapar, which occupied the 8th position and Panatlantica which occupied the 24th
It should again be noted that the companies that were in the top positions of the rankings are organizations that released Annual or Sustainability Reports of the analyzed years. And, unlike these companies, the organizations found in the lower ranks of the environmental rankings are those who did not disclose such reports.
4.1.3 Companies by Level of Socio-environmental Disclosure
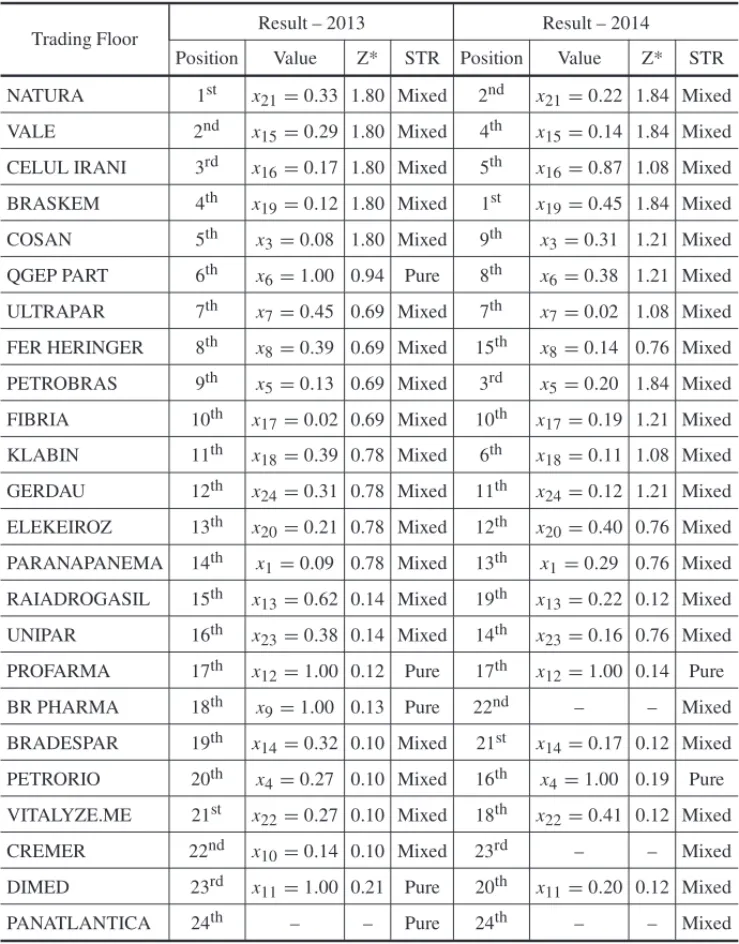
For the construction of social and environmental rankings of 2013 and 2014 of the companies that composed the research sample, the Linear Programming Problems elaborated refer to vector games, that is, the model deals with social and environmental variables in the same LPP. The socio-environmental rankings of 2013 and 2014 are evidenced by means of Table 9.
Regarding the results presented in Table 9, it should be pointed out that Natura, which ranked 1st in the ranking in 2013, fell, in the second year, to the 2nd position. On the other hand, the
company Braskem, which occupied the 4thposition in the year 2013, started to lead the ranking in the following year, being considered in 2014 the company with high environmental impact among those analyzed, with a higher level of socio-environmental disclosure.
It must also be emphasized that again there were companies that maintained their positions during the analyzed years. Among these are Ultrapar, occupying the 7thposition, Fibria, which occu-pied the 10thposition, Profarma, which occupied the 17th position in the ranking and Panatlantica again, as has already been evidenced in the rankings of the level of social and environmental dis-closure, was in the 24thposition. It can also be verified that, generally, the companies positioned in the first and last positions of the ranking of 2013, tended to remain in such positions in the following year.
As previously evidenced in the rankings regarding social disclosure and environmental disclo-sure, the companies belonging to the former are organizations that are concerned with dissemi-nating Annual or Sustainability Reports. On the other hand, the companies with the worst ranking positions were those that did not show Annual or Sustainability Reports.
4.1.4 Companies by Market Value
Table 9–Rankings of companies in relation to the socio-environmental disclosure level. STR = Strategy. (Source: Research data).
Trading Floor Result – 2013 Result – 2014
Position Value Z* STR Position Value Z* STR
NATURA 1st x21=0.33 1.80 Mixed 2nd x21=0.22 1.84 Mixed
VALE 2nd x15=0.29 1.80 Mixed 4th x15=0.14 1.84 Mixed
CELUL IRANI 3rd x16=0.17 1.80 Mixed 5th x16=0.87 1.08 Mixed
BRASKEM 4th x19=0.12 1.80 Mixed 1st x19=0.45 1.84 Mixed
COSAN 5th x3=0.08 1.80 Mixed 9th x3=0.31 1.21 Mixed
QGEP PART 6th x6=1.00 0.94 Pure 8th x6=0.38 1.21 Mixed
ULTRAPAR 7th x7=0.45 0.69 Mixed 7th x7=0.02 1.08 Mixed
FER HERINGER 8th x8=0.39 0.69 Mixed 15th x8=0.14 0.76 Mixed
PETROBRAS 9th x5=0.13 0.69 Mixed 3rd x5=0.20 1.84 Mixed
FIBRIA 10th x17=0.02 0.69 Mixed 10th x17=0.19 1.21 Mixed
KLABIN 11th x18=0.39 0.78 Mixed 6th x18=0.11 1.08 Mixed
GERDAU 12th x24=0.31 0.78 Mixed 11th x24=0.12 1.21 Mixed
ELEKEIROZ 13th x20=0.21 0.78 Mixed 12th x20=0.40 0.76 Mixed
PARANAPANEMA 14th x1=0.09 0.78 Mixed 13th x1=0.29 0.76 Mixed
RAIADROGASIL 15th x13=0.62 0.14 Mixed 19th x13=0.22 0.12 Mixed
UNIPAR 16th x23=0.38 0.14 Mixed 14th x23=0.16 0.76 Mixed
PROFARMA 17th x12=1.00 0.12 Pure 17th x12=1.00 0.14 Pure
BR PHARMA 18th x9=1.00 0.13 Pure 22nd – – Mixed
BRADESPAR 19th x14=0.32 0.10 Mixed 21st x14=0.17 0.12 Mixed
PETRORIO 20th x4=0.27 0.10 Mixed 16th x4=1.00 0.19 Pure
VITALYZE.ME 21st x22=0.27 0.10 Mixed 18th x22=0.41 0.12 Mixed
CREMER 22nd x10=0.14 0.10 Mixed 23rd – – Mixed
DIMED 23rd x11=1.00 0.21 Pure 20th x11=0.20 0.12 Mixed
PANATLANTICA 24th – – Pure 24th – – Mixed
Table 10–Rankings of companies in relation to market value. (*) In Brazilian Real Rates (R$). (Source: Research data).
Trading floor Position Market Value* Position Market Value*
(2013) (2013) (2014) (2014)
PETROBRAS 1st 125,096,726.23 1st 111,791,339.30
VALE 2nd 107,134,332.37 2nd 67,148,476.25
BR PHARMA 3rd 47,015,104.50 24th 35,941.95 ULTRAPAR 4th 27,232,293.97 4th 32,407,997.40 FIBRIA 5th 16,453,877.25 5th 28,208,714.11 KLABIN 6th 14,635,202.58 3rd 38,622,897.04 GERDAU 7th 13,182,534.29 10th 5,869,625.52 NATURA 8th 12,752,406.87 8th 10,000,601.71
COSAN 9th 10,807,194.45 9th 9,726,141.32
RAIADROGASIL 10th 8,172,109.41 7th 11,622,076.63 BRASKEM 11th 7,536,652.72 6th 11,884,634.68
UNIPAR 12th 3,925,304.75 17h 455,222.02
BRADESPAR 13th 3,708,486.79 11th 1,545,270.96 QGEP PART 14th 1,756,646.65 12th 1,452,029.07
DIMED 15th 967,370.40 13th 1,322,110.00
PARANAPANEMA 16th 754,744.89 15th 672,242.41
PETRORIO 17th 687,178.80 14th 807,765.00
CELUL IRANI 18th 519,192.78 16th 494,675.44
PROFARMA 19th 346,729.67 19th 195,155.96
CREMER 20th 318,643.14 18th 412,334.45
PANATLANTICA 21st 271,546.53 20th 187,969.37 FER HERINGER 22nd 255,442.17 22nd 72,706.95 ELEKEIROZ 23rd 220,395.00 21st 173,482.35 VITALYZE.ME 24th 64,087.00 23rd 39,181.56
4.2 Degree of Correlation Between Rankings
Table 11 shows the findings related to the degrees of association found through Kendall’s cor-relation between the rankings of social disclosure levels and the market value rankings of the sample companies.
Table 11–Correlation between rankings of social disclosures and those of market value. (Source: Research data).
Period Kendall Correlation Values 2013 Social Disclosure – Correlation coefficient 0.290
2014 Market Value Sig. 0.047 2014 Social Disclosure – Correlation coefficient 0.348 2015 Market Value Sig. 0.017
These results converge with the findings of Qiu, Shaukat & Tharyan (2014) in organizations be-longing to the FTSE 350 index using regression and correlation and the findings of Verbeeten, Gamerschlag & Moller (2016) which applied Pearson’s correlation and panel data analysis by analyzing German companies. However, the findings of this research diverge from the results obtained by Santos, Ara´ujo & Leite Filho (2016), since these authors evidenced an inverse asso-ciation between such variables in Brazilian civil construction companies by means of panel data. Moreover, these results also differ from the findings of Sousa, Silva, Ribeiro & Weffort (2014), since when investigating Brazilian companies, by using Spearman correlation and panel data, the authors did not verify the association between such variables. Therefore, it is emphasized that such results may be specific of companies belonging to sectors with high environmental impact, and for this reason they need to pay special attention to the dissemination of social information. In addition to such evidence, the difference observed in the strength of the degree of association between the rankings of the first and the second period should be noted. This finding leads to the assumption that there has been an increase in the importance attributed to the disclosure of social information by the market at the present time. Still, it is suggested through such findings that the qualification of voluntary disclosure by companies can positively reflect their market value, which stimulates the improvement of social disclosure in later periods.
In relation to the results found through the association between the environmental rankings and the market value rankings, verified through the Kendall correlation, they are exposed in Table 12.
Table 12–Correlation between rankings of environmental disclosures and those of market value. (Source: Research data).
Period Kendall Correlation Values 2013 Environmental Disclosure – Correlation coefficient 0.319
2014 Market Value Sig. 0.029
2014 Environmental Disclosure – Correlation coefficient 0.471
2015 Market Value Sig. 0.001
These results corroborate with the findings of Iatridis (2013) in companies from Malaysia, Olayinka & Oluwamayowa (2014), in companies listed in Nigeria, Fazzini & Dal Maso (2016), in Italian organizations and with the findings of Santos, Ara´ujo & Leite (2016), in 18 Brazil-ian construction companies which applied panel data analysis. In contrast, the results found do not corroborate with Sousa, Silva, Ribeiro & Weffort’s (2014) evidence in the Brazilian scenario, since the authors found an inverse association between such variables using Spearman correlation and panel data and it also diverges from the findings of Verbeeten, Gamerschlag & Moller (2016) in 130 German companies which applied Pearson correlation and panel data.
However, it is emphasized that, as evidenced by the association between social disclosure and market value, Table 12 shows an increase in the degree of association of environmental disclo-sure with the market value of the first to the second period analyzed. Such evidence suggests that there was also an increase in the importance attributed by the market in the disclosure of environ-mental issues by companies with high environenviron-mental impact. Therefore, the qualification of the disclosure of this type of information can positively reflect the market value of the companies, which stimulates an improvement in relation to such disclosure in later periods by companies with high environmental impact.
Table 13 shows the results obtained through Kendall’s correlation, in relation to the degrees of association between the rankings of social-environmental disclosure levels and the market value rankings of the analyzed organizations.
Table 13–Correlation between rankings of social and environmental disclosures and those of market value. (Source: Research data).
Year Kendall Correlation Values 2013 Socio-environmental – Correlation coefficient 0.341
2014 Market Value Sig. 0.020
2013 Socio-environmental – Correlation coefficient 0.500
2014 Market Value Sig. 0.001
It can be seen from Table 13 that in both analyzed periods there was a positive, moderate and sig-nificant association between the social-environmental disclosure rankings and the market value rankings. This result indicates that companies with higher levels of disclosure on issues related to their employees, society and the environment tend to present market values higher than their competitors who do not disclose such information.
results obtained in this research do not corroborate with the findings of Rover & Murcia (2010) and Murcia & Santos (2012) in the Brazilian context using correlation and with the results of Morais (2014) in companies in Portugal, Spain and Italy.
Reinforcing the results related to the association of social disclosure and environmental disclo-sure with the market value of the companies, Table 13 shows an increase in the strength of the association from the first to the second period evaluated. This finding supports the idea that the market is becoming more interested and valuing organizations with high environmental impact that disclose information about their employees, society and the environment. Such finding en-courages these organizations to highlight such issues in order to improve their perception in relation to thee investors, resulting in a market value superior to their competitors who do not worry about such disclosure.
In addition, such evidence encourages further research to evaluate the consistency of such re-lationships in later periods, since such studies would contribute to the analyzed organizations, assisting them in their dissemination practices on social and environmental issues.
5 CONCLUSIONS
After the use of the mathematical models, based on scalar and vector games, it can be concluded, in relation to the positioning of the companies of the sample according to the level of social disclosure, that the companies that were in the best positions were Natura, Qgep Part, Vale, and Braskem, and in the last positions were Panatlantica, Petrorio, Dimed and Bradespar. Regarding the accounting positioning of the sample companies, according to the level of environmental disclosure, Celul Irani, Vale and Ultrapar have the best positions. In contrast, the organizations with the lowest levels of environmental disclosure were Panatlantica, Cremer, Dimed, Br Pharma and Vitalyze.me.
Evaluating jointly the level of social and environmental disclosure of the organizations of high environmental impact belonging to the sample, it can be verified that among the companies with the best levels of social and environmental disclosure are Natura, Vale, Celul Irani and Fibria. In the lowest positions are Panatlantica, Dimed and Cremer. Regarding the rankings of the organizations according to the market value, Petrobras, Vale, Ultrapar and Fibria oc-cupy the best positions, while Vitalyze.me, Elekeiroz, Fer Heringer and Panatlantica are in the lowest rankings.
Regarding the association of social, environmental and socio-environmental disclosure with the market value of Brazilian companies with high environmental impact, the results of this research converge with the conclusion of Dye (1985) regarding Voluntary Disclosure Theory. This fact results from the empirical evidence that companies with higher levels of social, environmental and socio-environmental voluntary disclosures tend to present market values superior to their competitors that disclose less information of these genres.
transparency in relation to social and environmental issues presented better market values. Thus, a perception by Eccles, Herz, Keegan & Phillips (2001), Konar & Cohen (2001), Kothari, Li & Short (2009), Moreira, Gomes, Dias Filho & Conceic¸˜ao (2014) and Nekhili, Hussainey, Cheffi & Tchakoute-Tchuigoua (2016) that the disclosure of voluntary information tends to bring benefits to the organizations is confirmed in this study.
Therefore, through this research, the relevance of companies belonging to the sectors of high environmental impact is disclosed, which will involve information about their employees, the community in general, the environment in which they are inserted, the use of natural resources and the way through which they protect the environment. Therefore, it is recommended for orga-nizations with high environmental impact that they seek to improve their market values; that they disclose Rover’s (2013) subcategories, since the greater disclosure of these is associated with a higher market value of such companies.
REFERENCES
[1] AMORIMEDEA, ROMEROR & MANTOVANIJRS. 2009. Fluxo de potˆencia ´otimo descentralizado utilizando algoritmos evolutivos multiobjetivo.Sba: Controle & Automac¸ ˜ao Sociedade Brasileira de
Automatica,20(2): 217–232.
[2] ANTUNES CH & ALVESMJ. 2012. Programac¸˜ao linear multiobjetivo-m´etodos interativos e soft-ware. In: Congreso Latino-Iberoamericano de Investigaci´on Operativa, 16, 2012, Rio de Janeiro.
Anais... Congreso Latino-Iberoamericano de Investigaci´on Operativa.
[3] AZUMARM. 2011.Otimizac¸ ˜ao multiobjetivo em problema de estoque e roteamento gerenciados pelo
fornecedor. 99 f. 2011. Dissertac¸˜ao (Mestrado em Engenharia El´etrica) – Faculdade de Engenharia
El´etrica e de Computac¸˜ao, Universidade Estadual de Campinas, Campinas.
[4] BAUERM & NAIMER. 2012. Estado da arte da evidenciac¸˜ao social e ambiental volunt´aria.REUNIR:
Revista de Administrac¸˜ao, Contabilidade e Sustentabilidade,2(2): 39–60.
[5] BOWERMANS & SHARMAUP. 2016. The effect of corporate social responsibility disclosures on share prices in Japan and the UK.Corporate Ownership and Control,13(2): 202–216.
[6] BRANDTF, FISCHERF, HARRENSTEINP & SHOHAMY. 2009. Ranking games.Artificial
Intellin-gence,173: 221–239.
[7] BUSHMANRM & SMITHAJ. 2001. Financial accounting information and corporate governance.
Journal of accounting and Economics,32(1): 237–333.
[8] CARMELOSSIM DE S. 2014. Func¸˜oes de aglutinac¸˜ao baseadas em eficiˆencia: uma abordagem DEA para problemas de otimizac¸˜ao multiobjetivo. Programa de P´os-Graduac¸˜ao em Engenharia de Produc¸˜ao, Universidade Federal de Itajub´a, Itajub´a, MG, Brasil.
[9] CHAVESEPS & PIMENTAJ ´UNIORT. 2013. Relac¸˜ao entre valor de mercado e ativo intang´ıvel na bovespa.Revista de Administrac¸˜ao IMED,3(3): 239–251.