Susana dos Reis Gregório
Licenciatura em Bioquímica
Improvement of viral fusion inhibitor enfuvirtide
efficacy by conjugation with membrane
anchoring lipids
Dissertação para obtenção do Grau de Mestre em
Bioquímica
Orientador: Prof. Doutor Nuno C. Santos, Professor Associado com
Agregação, IMM, FMUL
Co-orientador: Doutor Axel Hollmann, Investigador Pós-Doc, IMM;
Professor Instrutor, UNQ
Júri: (Font: Arial, 10 pt normal)
Presidente: Prof. Doutor José Ricardo Ramos Franco Tavares Arguente: Prof. Doutor Pedro Miguel Ribeiro Viana Baptista Vogal: Prof. Doutor Nuno Correia Santos
“Copyright”
Improvement of viral fusion inhibitor enfuvirtide
efficacy by conjugation with membrane
anchoring lipids
Susana dos Reis Gregório
Faculdade de Ciências e Tecnologia
Universidade Nova de Lisboa
Acknowledgements
Firstly, I would like to express my gratitude to Prof. Nuno C.Santos, my supervisor, for giving me the opportunity to develop my master thesis in his research group. I am grateful for the encouragement, support and all the scientific help throughout this work. I also would like to thank Dr. Axel Hollmann, my co-supervisor, for his help, support, comprehension and never-ending patient throughout this year. His guidance and motivation were essential for the completion of this thesis.
I would like to thank Dr. Sónia Gonçalves, Marcelo Augusto and Teresa Freitas for all their help in the experimental part.
To everyone from the Biochemistry Institute, especially to my colleagues of the Biomembranes Unit and Physical Biochemistry Unit, I would like to thank for the friendly environment.
I also would like to thank “Juniors” for the friendship, good moments and the so inspiring In&In conversations. Thank you for the great environment and for making it a fun place to work.
To Ana, my thesis partner, I would like to thank your support, fellowship, great conversations and especially your friendship. Without you this would not have been the same.
To all my friends, especially to Inês, Sara e Márcia, thank you for all the support and for being always there for me. I am grateful to be able to call you friends.
Resumo
O vírus da imunodeficiência humana tipo 1 (VIH-1) é um vírus altamente patogénico e evasivo para o qual ainda não foi desenvolvida uma cura. A maioria dos fármacos antirretrovirais desenvolvidos contra esta infeção tem como alvo enzimas chave do seu ciclo replicativo, como a transcriptase reversa, integrase e protease. Um processo crucial na infeção pelo VIH é a fusão das membranas viral e do hospedeiro, pelo que o desenvolvimento de uma nova classe de antirretrovirais, os inibidores de fusão, apresenta uma grande vantagem face aos fármacos comummente usados na terapêutica, uma vez que estes atuam antes da libertação do genoma viral nas células do hospedeiro. Em estudos anteriores foi reportado que a atividade antiviral de péptidos inibidores de VIH-1 é amplificada pela conjugação com colesterol e polietilenoglicol (PEG). Assim, o objetivo deste trabalho é a caracterização da interação de péptidos que derivam do enfuvirtide, pela conjugação com colesterol, ácido palmítico ou α-tocoferol como âncoras lipídicas e PEG como espaçador, com sistemas membranares modelo e células sanguíneas humanas.
Recorrendo a metodologias de espectroscopia de fluorescência, incluindo ensaios de partição e de extinção de fluorescência, demonstrou-se que a conjugação com porções lipídicas potencia a interação dos péptidos com membranas de diferentes composições lipídicas. Foi também averiguada a localização dos péptidos na membrana utilizando sondas lipofílicas, verificando-se que os péptidos conjugados se encontram numa posição mais superficial do que o não conjugado.
A avaliação de alterações do potencial de dipolo da membrana permitiu verificar que os péptidos conjugados apresentam uma maior afinidade para membranas ricas em colesterol, assim como para células sanguíneas, contrariamente ao péptido não conjugado.
De modo geral, os resultados obtidos indicam que um balanço entre a afinidade para a membrana e a exposição dos péptidos é essencial para o aumento da atividade antiviral dos mesmos. Assim, a adição de frações lipídicas a um inibidor de fusão reconhecido poderá ser uma estratégia promissora no combate à infeção por VIH-1.
Abstract
The human immunodeficiency virus type 1 (HIV-1) is a highly pathogenic and evasive virus, for which no cure has yet been achieved. The majority of the antiretroviral drugs developed over the years against this infection target key enzymes in HIV life cycle, such as reverse transcriptase, integrase and protease. Fusion of viral and host cell membranes is a crucial step in virus infectivity; therefore, the development of viral entry inhibitors has great advantages over conventional drugs, since they prevent the release of the viral content into the host cell. Previous studies showed that the antiviral activity of HIV-1 inhibitor peptides is increased by the addition of cholesterol and polyethylene glycol (PEG). The aim of the present work is to characterize the interaction of enfuvirtide derived molecules by conjugation with cholesterol, palmitic acid or α-tocopherol as lipid anchors and PEG as spacer, with biomembrane model systems and human blood cells.
Fluorescence spectroscopy methodologies, including membrane partition and fluorescence quenching assays, demonstrated that conjugation with lipids increases the peptides ability to interact with membranes of different compositions. In addition, the depth of peptide insertion into the membrane was assessed using lipophilic probes, revealing that the conjugated peptides are located in a more shallow position than the unconjugated one. Moreover, dipole potential assays showed that conjugated peptides exhibit a higher affinity towards cholesterol-rich membranes, as well as human blood cells, than the unconjugated peptide.
Altogether, the obtained results indicate that a proper balance between membrane affinity and peptide exposure is required in order to enhance antiviral activity. Therefore, the addition of lipid moieties to an established fusion inhibitor such as enfuvirtide can be a promising strategy against HIV-1.
Contents
Resumo... vii
Abstract ... ix
Figures Index ... xiii
Tables Index ... xv
Abbreviations and symbols ... xvii
1. Introduction ... 1
1.1. HIV: origin and diversity ... 2
1.2. HIV transmission and progression of disease ... 3
1.3. HIV-1 structure and life cycle ... 4
1.3.1. HIV-1 entry and its inhibition ... 8
1.4. Fusion inhibitors ... 9
1.5. C-peptides: new strategies against HIV-1 fusion ... 11
1.6. Objectives in the context of the state-of-art ... 13
2. Materials and methods ... 15
2.1. Materials ... 16
2.2. Methods ... 16
2.2.1. Peptides ... 16
2.2.2. Biomembrane systems preparation ... 17
Liposomes ... 17
Biological samples ... 18
2.2.3. Fluorescence spectroscopy measurements ... 18
Peptide aggregation... 18
Partition coefficient determination ... 18
Membrane dipole potential assessment ... 20
Membrane dipole potential on LUV ... 23
Membrane dipole potential on biological samples ... 23
Fluorescence quenching ... 24
Quenching by acrylamide ... 24
Quenching by 5NS and 16NS ... 25
3. Results and discussion ... 27
3.1. Peptide aggregation ... 29
3.2. Membrane partition ... 30
3.3. Membrane dipole potential ... 33
3.4. Localization in the lipid bilayer ... 38
4. Conclusion ... 43
Figures Index
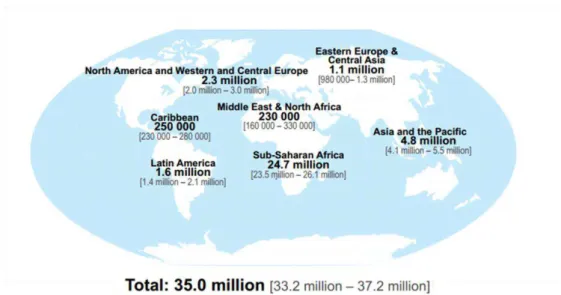
Figure 1.1 - Geographic distribution of adults and children estimated to be living with HIV in 2013. .... 2
Figure 1.2 - The typical profile of untreated infection with HIV. ... 4
Figure 1.3 - Schematic representation of HIV-1 virion. ... 5
Figure 1.4 - Structure of gp160. ... 6
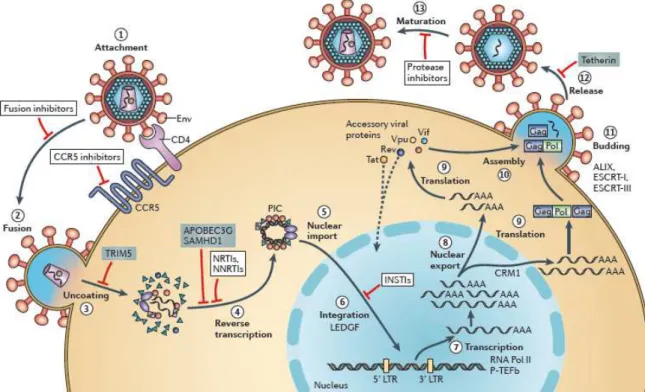
Figure 1.5 - Schematic representation of the HIV-1 cycle. ... 7
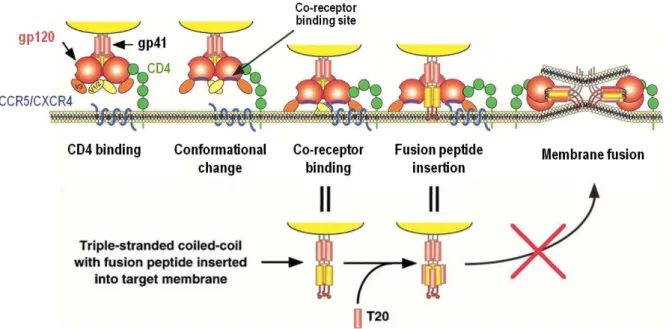
Figure 1.6 - Entry mechanism of HIV-1. ... 8
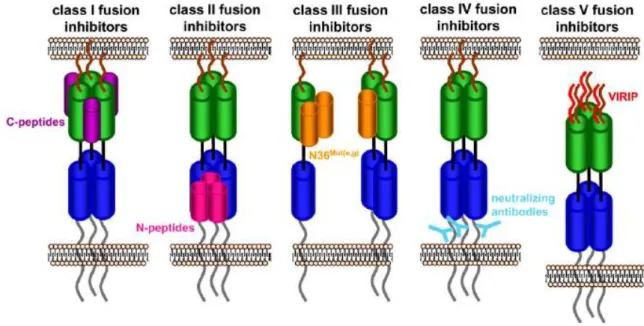
Figure 1.7 - Classes of HIV-1 fusion inhibitors. ... 10
Figure 1.8 - Characteristics of several C-peptides. ... 12
Figure 2.1 - Representation of enfuvirtide, T20* and its lipid derivatives. ... 17
Figure 2.2 - Schematic representation of the three types of membrane potential. ... 21
Figure 2.3 - Structure of di-8-ANEPPS (blue) between phospholipids (black). ... 21
Figure 2.4 - Representation of membrane dipole potential probed by di-8-ANEPPS. ... 22
Figure 2.5 - Representation of a lipid membrane (phospholipids in black) with incorporated 5NS (blue) and 16NS (red). ... 25
Figure 3.1 - Fluorescence spectra of ANS titrated with T20* and its derivatives. ... 29
Figure 3.2 - Dependence of fluorescence intensity with peptide concentration. ... 30
Figure 3.3 - Partition of the peptides to lipid vesicles. ... 31
Figure 3.4 - Fusion inhibitor interactions with di-8-ANEPPS labeled LUV. ... 34
Figure 3.5 - Fusion inhibitor interactions with di-8-ANEPPS labeled cells. ... 36
Figure 3.6 - Accessibility of the peptide to the aqueous environment. ... 38
Figure 3.7 - Fluorescence quenching by lipophilic probes. ... 40
Figure 3.8 - Localization of T20* and its conjugates inside the membrane. ... 41
Tables Index
Table 3.1 - Antiviral activity of different HIV-1 fusion inhibitors (U87 cell line; viral strain SF162). ... 28
Table 3.2 - Slope, intercept and R2 values determined from the linear fit of ANS fluorescence intensity vs. peptide concentration data. ... 30
Table 3.3 - Partition coefficients of different fusion inhibitor peptides. ... 32
Table 3.4 - Quantification of peptide binding to LUV. ... 35
Table 3.5 - Quantification of peptide binding to blood cells. ... 37
Abbreviations and symbols
16NS 16-doxyl-stearic acid
5NS 5-doxyl-stearic acid
6HB Six-helix bundle
AbsF Absorbance of the fluorophore at the initial concentration
AbsT Absorbance of the total solution
AIDS Acquired immunodeficiency syndrome
ANS 8-anilino-1-naphthalenesulfonic acid (ammonium salt)
CCR5 C-C chemokine receptor type 5
CD4 Cluster of differentiation 4
CF Correction factor
Chol Cholesterol
CHR C-terminal heptad repeat
CT Cytoplasmic tail
CXCR4 C-X-C chemokine receptor type 4
di-8-ANEPPS 4-[2-[6-(dioctylamino)-2-naphthalenyl]ethenyl]-1-(3-sulfopropyl)-pyridinium
Env Envelope glycoprotein
ER Endoplasmic reticulum
FP Fusion peptide
gp120 Envelope glycoprotein 120
gp160 Envelope glycoprotein 160
gp41 Envelope glycoprotein 41
HAART Highly active antiretroviral therapy
HEPES 4-(2-hydroxyethyl)piperazine-1-ethanesulfonic acid
HIV Human immunodeficiency virus
HIV-1 Human immunodeficiency virus type 1
HIV-2 Human immunodeficiency virus type 2
HR Heptad repeat domain
IC50 Half maximal inhibitory concentration
LBD Lipid binding domain
LUV Large unilamellar vesicles
MLV Multilamellar vesicles
xviii
NHR N-terminal heptad repeat
Palm Palmitic acid
PBD Pocket binding domain
PBMC Peripheral blood mononuclear cells
PEG Polyethylene glycol
POPC 1-palmitoyl-2-oleyl-sn-glycero-3-phosphocholine
RAFI Rigid amphipathic fusion inhibitors
SEM Standard error of mean
SIV Simian immunodeficiency virus
SM Sphingomyelin
TM Transmembrane domain
Toco α-tocopherol
TRD Tryptophan-rich domain
Trp L-tryptophan
UNAIDS United Nations Programme on AIDS
VIRIP Virus inhibitory peptide
WHO World Health Organization
Fluorescence intensity
Fluorescence intensity at zero concentration of quencher
Fluorescence intensity in lipid
Fluorescence intensity in aqueous solution
Dissociation constant
Partition coefficient
Stern-Volmer constant
Lipid
Number of moles of lipid
Number of moles of water
Number of moles of peptide present in the lipid phase
Number of moles of peptide in the aqueous phase
Q Quencher
Intensities ratio
Intensities ratio in the absence of peptide
Intensities ratio normalized to the initial ratio
R Correlation coefficient
Volume of the lipid phase
Volume of the aqueous phase
Lipid molar volume
Water molar volume
λexc Excitation wavelength
ΔΨ Transmembrane potential
Ψd Dipole potential
2
1.1. HIV: origin and diversity
Human immunodeficiency virus (HIV) is the causative agent of the acquired immunodeficiency syndrome (AIDS), one of the most extreme cases of immune suppression caused by a pathogen (Murphy, 2011). Although the earliest documented case of HIV infection has been reported in samples of serum and lymph node biopsy from the present Democratic Republic of Congo, stored in 1959 and 1960, respectively (Worobey et al., 2008; Zhu et al., 1998), it was only in 1981 that AIDS was officially recognized; as an unusual pattern of symptoms observed in a small group of previously healthy homosexual men in USA (Gottlieb et al., 1981). Soon after, AIDS cases were reported in other groups, including intravenous drug users and hemophiliacs (Davis, 1983; Masur et al., 1981). HIV was identified and isolated for the first time in 1983 (Barré-Sinoussi et al., 1983), being consider as the causative agent of AIDS (Coffin et al., 1986).
Since the beginning of HIV epidemic, nearly 75 million people have been infected, with an outcome of about 36 million deaths. By the end of 2013, the United Nations Programme on AIDS (UNAIDS)/World Health Organization (WHO) epidemic update estimated 35.0 million (33.2 – 37.2 million) people were living with HIV, wherein 2.1 million (1.9 – 2.4 million) were newly infected people, and 1.5 million (1.4 – 1.7 million) died due to AIDS (UNAIDS, 2014).
Human immunodeficiency viruses belong to the Lentivirus genus, Retrovididae family and comprise two types of virus: HIV-1 and HIV-2. Although AIDS can be caused by both viruses, their origin and gene sequence differ. HIV-1 is the most virulent specie and progresses more rapidly to AIDS than HIV-2 (Weiss, 2000).
HIV and their lineages derived from multiple and independent zoonotic transmissions, i.e. cross-species transmissions, of simian immunodeficiency virus (SIV) from nonhuman primates into human in West and Central Africa; HIV-1 derived from the chimpanzee, Pan troglodytes, whereas HIV-2 from
Figure 1.1 - Geographic distribution of adults and children estimated to be living with HIV in 2013.
the sooty mangabey, Cercocebus atys. HIV-2 is endemic in West Africa, however the virus’ prevalence spread to Europe (especially Portugal) and India. The zoonotic transmissions by chimpanzees led to several HIV-1 lineages, groups M, N, O and P. Group M (Major/Main), which include various subtypes, is the most common and is responsible for the HIV-1 worldwide pandemic (Hemelaar, 2012; Reeves & Doms, 2002). A tremendous genetic variability, due to high mutations and recombinant rates of the reverse transcriptase enzyme which lacks a proof-reading mechanism, and high rates of virus replication are crucial factors in the worldwide spread of HIV, causing the virus to be highly adaptable to new hosts and selection pressures (Hemelaar, 2013).
1.2. HIV transmission and progression of disease
HIV infection takes place when body fluids are transferred from an infected person to an uninfected one. The virus can be transmitted through contaminated blood products (injection, blood transfusion/organ transplant), vertically (from mother to child) in pregnancy, birth or breastfeeding and, most frequently, through sexual activity (Murphy, 2011).
4
1.3. HIV-1 structure and life cycle
HIV-1 is an enveloped virus that infects CD4+ T cells, dendritic cells and macrophages (Murphy, 2011). HIV virions are spherical particles with ≈ 100 nm in diameter (Sougrat et al., 2007), coated by a viral envelope membrane derived from the host cell plasma membrane, which covers and protects their capsid structures and the single-strand RNA copies (Figure 1.3). HIV-1 envelope glycoprotein (gene designation Env), whose function is to mediate binding and fusion of the viral membrane with the host cell membrane, is the only membrane protein encoded by the genomic RNA (Blumenthal et al., 2012; Podbilewicz, 2014). Env is first synthesized in the endoplasmic reticulum (ER) as a precursor protein termed gp160. After glycosylation in the Golgi apparatus, the protein is cleaved by the cellular protease furin into two subunits: a surface subunit (gp120) and a transmembrane subunit (gp41) (Hallenberger et al., 1992) that remain noncovalently associated, comprising a trimer of heterodimers. These glycoproteins are the main targets of HIV-1 neutralizing antibodies that, through selection, developed many mechanisms to evade the host immune response, making them the most variable proteins of HIV-1 (Burton et al., 2004; Wyatt, 1998).
Figure 1.2 - The typical profile of untreated infection with HIV.
Each gp120 subunit contains an inner domain with five highly conserved regions, which are crucial to virus-cell attachment, and an outer domain with surface-exposed hypervariable loops (Figure 1.4), which are involved in immune evasion as they are a constantly moving target for the host’s immune system (Wilen et al., 2012).
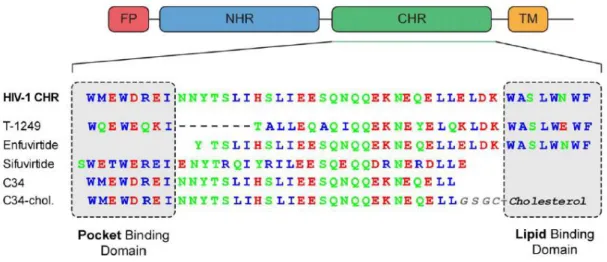
An ectodomain (extracellular domain), a transmembrane domain (TM) and an endodomain (intracellular domain) compose each gp41 subunit. The latter, also referred as, cytoplasmic tail (CT) plays a role in packaging, infectivity and cell pathogenicity (Yang et al., 2010). The transmembrane domain is responsible for Env’s anchorage in the viral membrane (Wilen et al., 2012). The ectodomain has a hydrophobic fusion peptide (FP) located at the N-terminal, whose function is to insert into the host membrane, and two heptad repeat regions, closer to the N-terminal (NHR) or C-terminal (CHR) (Franquelim et al., 2011). A Trp-rich domain, the membrane proximal external region (MPER), where several antibodies bind, is located at the C-terminal, between the TM and the CHR, and also seems to play an important role during membrane fusion (Lorizate et al., 2008).
Figure 1.3 - Schematic representation of HIV-1 virion.
6
Moreover, the genetic material of the virus is composed by two single-stranded RNA molecules surrounded by nucleocapsid proteins and enzymes that are required for the development of the virion, such as reverse transcriptase, protease and integrase, which are also in contact with HIV’s genome. This structure is enclosed in a cone-shaped capsid comprised by the viral protein p24. To ensure the integrity of the virion, the capsid is surrounded by a matrix of viral proteins (Karlsson Hedestam et al., 2008).
The HIV-1 replication cycle (Figure 1.5) can be divided into two phases, an early phase and a late one (Tözsér, 2003). The early phase begins with the attachment of the mature virion to the host cell membrane, leading to viral-cell membrane fusion, and entry of the cone-shaped capsid. At this stage, the viral RNA is released and, by reverse transcription, a double-stranded viral DNA is generated, which is then integrated into the host genome. In the late stage of the cycle, the viral DNA is transcribed into mRNA that encodes different viral proteins. At the end of this phase, the assembly of virion proteins and viral RNA takes place in the plasma membrane, and finally the immature virus exits the cell by a budding process followed by a protease-mediated maturation.
Figure 1.4 - Structure of gp160.
The research of HIV has been useful, not only for the understanding the nature of the disease, but also for prevention, diagnosis and treatment. Since HIV’s discovery as the causative agent of AIDS, the development of anti-HIV drugs has been the focus of intense research (De Clercq, 2013). As a consequence, many drugs are now available, but still no cure or vaccine was achieved. The majority of the approved antiretroviral drugs target three essential enzymes of the HIV life cycle: reverse transcriptase, integrase and protease (De Clercq, 2009). As reviewed by Adamson & Freed (2010), these drugs have significantly extended the life-expectancy of HIV patients. The combination of several antiretroviral drugs, known as highly active antiretroviral therapy (HAART), is considered the standard treatment for HIV patients. Despite having the advantage of combining multiple drugs, preventing HIV’s resistance to a single inhibitor, drug resistance can still emerge. As a consequence of this multi-drug resistance an alternative treatment, known as salvage therapy, is required. This will be more effective if new drugs are available.
Even though HIV infections decreased by 38% since 2001 and the treatment cost is more affordable, and consequently a higher number of people are receiving HIV treatment, there are 22 million people to whom antiretroviral therapy is still inaccessible (UNAIDS, 2014). Therefore, the development of more potent and economically viable drugs is required.
Figure 1.5 - Schematic representation of the HIV-1 cycle.
8
1.3.1. HIV-1 entry and its inhibition
As an enveloped virus, HIV-1 must transfer its genetic material across both the viral and host membranes to infect a cell (Doms & Trono, 2000). The attachment and viral fusion with host’s cell membrane are crucial steps in the HIV life cycle. The efficient blocking of these steps prevents the occurrence of the subsequent intracellular stages of the viral life cycle (Hollmann et al., 2013).
HIV-1 entry into the host cell is a multi-step process that comprises attachment of the virus to the cell surface, receptor binding, co-receptor binding and membrane fusion (Tilton & Doms, 2010).
The first step of HIV-1 entry is the binding of gp120 to the CD4 receptor of the host cells (Figure 1.6). Gp120 has high affinity towards the cell-surface receptor: nevertheless, this event is not sufficient to trigger membrane fusion (Klasse, 2012; Wilen et al., 2012). Therefore, gp120 must also bind to a co-receptor in host’s membrane. There are two chemokine receptors that act as major co-receptors for viral entry, CCR5 and CXCR4, which use depends on the viral strain (Locher et al., 2005). The interaction of gp120 with the CD4 receptor causes conformational changes enabling the glycoprotein to bind to the co-receptor. At this stage, the hydrophobic N-terminal gp41 fusion peptide is exposed and interacts with the membrane of the host cell, into which it inserts, prompted by a tripled-stranded coiled-coil (Doms & Trono, 2000), formed by the NHR from each gp41 of the trimer. During membrane fusion both helical domains of the gp41, NHR and CHR, folds into each other in an antiparallel fashion, resulting in a highly stable structure named six-helix bundle (6HB). The 6HB structure brings the viral and cell membranes into close proximity, allowing membrane fusion and, consequently, the release of the viral content into the host cell (Wilen et al., 2012).
Figure 1.6 - Entry mechanism of HIV-1.
Despite HAART’s efficiency at inhibiting HIV replication, reducing AIDS morbidity and mortality, it does not eradicate HIV infection (Tilton & Doms, 2010); patients require treatment indefinitely. As a result, long-term toxicity, drug-drug interactions and emergence of drug-resistance strains of HIV may arise, limiting treatment effectiveness. As a consequence, and also due to high costs of HAART, new strategies to inhibit viral replication have been investigated.
Since HIV-1 entry is a multi-step process involving multiple interactions between Env and host proteins, each step of the process can be a target for entry inhibitors. This new class of antiretroviral can be divided into three categories: attachment and CD4 inhibitors, co-receptor inhibitors and fusion inhibitors (Wilen et al., 2012). Attachment inhibitors target the gp120-CD4 binding step by blocking the interaction between gp120 and the CD4 receptor, while antagonists of the co-receptors act on the
binding step of gp120 to the co-receptor (CCR5 or CXCR4). Fusion inhibitors act on the gp41-mediated membrane fusion step (reviewed by Henrich & Kuritzkes 2013; Haqqani & Tilton 2013;
Berkhout et al. 2012).
Despite this promising approach in drug development against HIV-1, until now, only two entry inhibitors were approved by the USA Food and Drug Administration (FDA), and are currently clinically available; maraviroc, an inhibitor of the gp120 binding to the CCR5 co-receptor (Lieberman-Blum et al., 2008), and enfuvirtide (T20), a fusion inhibitor peptide that targets gp41 in its pre-hairpin conformation (Matthews et al., 2004).
1.4. Fusion inhibitors
The initial development of HIV-1 fusion inhibitors was based on the heptad repeat domains (HR) of gp41 (Jiang et al., 1993; Wild et al., 1992). The formation of the 6HB by the back-folding of gp41 NHR and CHR is a critical step for membrane fusion; after pore formation in its pre-bundle complex, this structure also stabilizes and expands the nascent fusion pore (Markosyan et al., 2003). Hence, the first strategy to suppress HIV-1 fusion was the use of synthetic peptides mimicking one of those domains. Peptides that mimic the NHR and CHR domains are known as N-peptides and C-peptides, respectively. These fusion inhibitors interact with gp41 domains interfering with the formation of the 6HB, and preventing the expansion and stabilization of the fusion pore (Wilen et al., 2012).
10
proximal region of gp41 (Reardon et al., 2014). Finally, class V includes peptides that target the gp41 fusion peptide, preventing its insertion into the target membrane and subsequent membrane fusion. To this class belongs a natural antiviral peptide present in human blood, termed virus inhibitory peptide (VIRIP) (Münch et al., 2007).
Additionally, new classes of fusion inhibitors that target the viral membrane were also reported: rigid amphipathic fusion inhibitors (RAFI) (St Vincent et al., 2010; Vigant et al., 2013), small lipophilic molecules such as LJ001 or JL103 (Vigant et al., 2013, 2014), or modified sterols as 25HC (Liu et al., 2013). All these small molecules have the ability to modify biophysical properties of the membrane, preventing the fusion process.
Figure 1.7 - Classes of HIV-1 fusion inhibitors.
1.5. C-peptides: new strategies against HIV-1 fusion
Structural analysis of the trimeric gp41 structure and understanding the CHR and NHR interaction enabled the development of peptides derived from the gp41 sequence towards HIV inhibition (Franquelim et al., 2011). The CHR region contains a pocket binding domain (PBD) complementary to deep hydrophobic pockets of the NHR core. Moreover, a HR core and a lipid binding domain (LBD) or tryptophan-rich domain (TRD) are also part of the CHR region.
C34, a C-peptide with 34 amino acids, was used to determine the trimeric coiled-coil structure of gp41 (Chan et al., 1997). Despite its high antiviral activity in vitro, C34 is not a good drug candidate due to its low solubility (Otaka et al., 2002) and other factors (some of them not totally understood), leading to low in vivo efficacy.
12
Based on the structural and functional information provided by C34 and enfuvirtide, new fusion peptides were developed.
T-1249 is a second generation fusion inhibitor. This peptide has 39 amino acid residues and was designed based on HIV-1, HIV-2 and SIV sequences (Eron et al., 2004). Even though T-1249 presented higher antiviral activity and a longer half-life than enfuvirtide, clinical development of this peptide was suspended due to problems in drug formulation (Martin-Carbonero, 2004).
Three-dimensional structural information of HIV-1 gp41 allowed the development of another second-generation fusion inhibitor, sifuvirtide. It is a 36 amino acid peptide engineered with different sequence and/or location in relation to C34, enfuvirtide and T-1249. In phase Ia clinical studies, sifuvirtide showed a higher potency and half-life in humans compared to enfuvirtide, enabling less clinical dosage and frequency of injections. Moreover, it showed to be highly effective against enfuvirtide-resistant strains (He et al., 2008b). Sifuvirtide successfully completed Phase IIb clinical trials (http://fusogen.com/en/company-news/177). Although sifuvirtide appear to be a good candidate towards HIV-1 inhibition, there is a continuous search to optimize fusion inhibitor peptides.
In 2001, a different approach was taken to overcome the drawbacks of enfuvirtide (Hildinger et al., 2001), by expressing a membrane-anchored version of enfuvirtide on a T-cell helper line. It was shown that this modified peptide (a construct of enfuvirtide, a short linker and a transmembrane domain) exhibited more antiviral activity than the construct without the transmembrane domain. Additionally, mutations in the membrane-proximal region of enfuvirtide inactivated the free peptide, but did not have the same effect on the membrane-anchored version of enfuvirtide. These results suggest that binding the drug to the cell membrane has a positive effect on its efficiency.
Based on this approach, a modified fusion peptide was developed to improve the antiviral activity of C34 by the addition of a cholesterol (Chol) moiety to its C-terminal (Ingallinella et al., 2009). It was
Figure 1.8 - Characteristics of several C-peptides.
hypothesized that using a cholesterol group as lipid anchor would be the most suitable approach due to the role of lipid rafts in HIV infection. Lipid rafts are microdomains within the lipid membrane, enriched in cholesterol and sphingolipids, where several transmembrane proteins and receptors are concentrated, including CD4, the main receptor for HIV infection (Aloia et al., 1988; Brügger et al., 2006). Besides the high antiviral activity observed for C34-Chol, this peptide also presents an increased half-life in vivo (≈ 24 h) (Ingallinella et al., 2009). Moreover, due to its cholesterol moiety, C34-Chol is able to partition into lipid membranes, especially cholesterol-rich domains (Hollmann et al., 2013). The increased antiviral activity and improved pharmacokinetic properties, along with peptide accumulation at the site of action (Augusto et al., 2014; Hollmann et al., 2013; Ingallinella et al., 2009), make this approach a good strategy for the development of new drugs.
While lipid conjugation is a preferential approach to improve peptide pharmacokinetics (Madsen et al., 2007), the covalent attachment of a polyethylene glycol (PEG) polymer to proteins is the most well-established strategy to prolong the half-life of a drug (Jevsevar et al., 2010).
1.6. Objectives in the context of the state-of-art
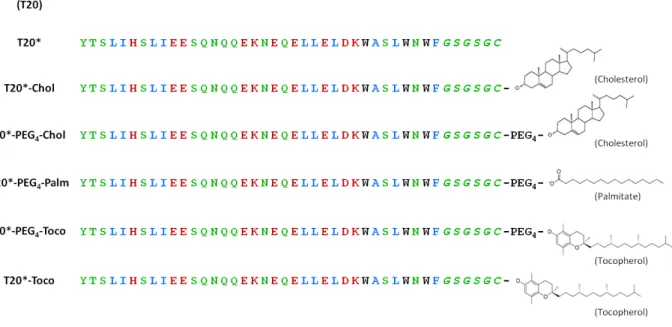
Despite major progresses in the development of new antiviral drugs, enfuvirtide still remains as the only class I fusion inhibitor peptide approved for the treatment of HIV by the USA Food and Drug Administration (FDA) and European Medicines Agency (EMA). In this context, and considering the advantage of the lesson of C34 peptide derivatization with PEG and cholesterol moieties, a new set of modified fusion inhibitors was designed: T20* (T20 or enfuvirtide with the additional GSGSGC residues on its C-terminal) was conjugated with different lipid moieties, namely cholesterol, palmitic acid (Palm) and α-tocopherol (Toco) as membrane anchors and a four residues PEG spacer in between the lipid and the peptide. As a result of this approach, 5 peptide derivatives were successfully synthetized and are the main focus of this work. The antiviral activity of these novel peptides showed higher antiviral activity than its parental T20*, being in this way promising candidates towards HIV inhibition.
As previously pointed out, the interaction of the inhibitor peptides with membranes is a key factor in the characterization and unravelling of the mechanism of action of these fusion inhibitors. Taking this into consideration, the aim of this work was to evaluate the interaction of this family of enfuvirtide-derived molecules with biomembrane model systems and human blood cells.
16
2.1. Materials
T20* (MW = 4997.4 g/mol), T20*-Chol (MW = 5368.0 g/mol), T20*-PEG4-Chol (MW = 5615.3 g/mol), T20*-PEG4-Palm (MW = 5440.1 g/mol), T20*-Toco (MW = 5412.0 g/mol) and T20*-PEG4-Toco (MW = 5659.3 g/mol) peptides were obtained on the context of a collaboration project with Prof. Matteo Porotto (Departments of Pediatrics and of Microbiology and Immunology, Weill Medical College of Cornell University, New York, USA).
Human blood samples were obtained from healthy volunteer donors at Instituto Português do Sangue (IPS), Lisbon, under an institutional agreement between IPS and Instituto de Bioquímica from Faculdade de Medicina da Universidade de Lisboa, with their informed written consent. The samples were drawn to K3EDTA anticoagulant tubes (Vacuette, Greiner Bio-One, Kremsmünster, Austria) and processed shortly after. This study was approved by the joint Ethics Committee of Faculdade de Medicina da Universidade de Lisboa and Hospital de Santa Maria (Lisbon).
POPC (1-palmitoyl-2-oleyl-sn-glycero-3-phosphocholine) and SM (egg sphingomyelin) were purchased from Avanti Polar Lipids (Alabaster, AL, USA). Acrylamide and HEPES (4-(2-hydroxyethyl)piperazine-1-ethanesulfonic acid) were obtained from Fluka (Buchs, Switzerland). KHCO3 (potassium hydrogencarbonate), EDTA (ethylenediaminetetraacetic acid), cholesterol, Pluronic-F127, ANS (8-anilino-1-naphthalenesulfonic acid ammonium salt), 5NS (5-doxyl-stearic acid) and 16NS (16-doxyl-stearic acid) were acquired from Sigma-Aldrich (St. Louis, MO, USA). The fluorescent probe di-8-ANEPPS (4-[2-[6-(dioctylamino)-2-naphthalenyl]ethenyl]-1-(3-sulfopropyl)-pyridinium) was purchased from Invitrogen - Molecular Probes (Eugene, OR, USA). LymphoprepTM was obtained from Stemcell Technologies (Vancouver, BC, Canada). Chloroform, DMSO (dimethyl sulfoxide), methanol, NaCl (sodium chloride), NH4Cl (ammonium chloride) and L-Tryptophan were acquired from Merck (Darmstadt, Germany).
HEPES buffer (HEPES 10mM pH 7.4 in NaCl 150 mM) was the working buffer used throughout the experiments. L-Tryptophan 500 µM stock solution was prepared in buffer, while ANS 2 mM and acrylamide 4 M solutions were prepared in ultrapure H2O. Stock solutions of the fluorescent probe di-8-ANEPPS 1 mg/mL and the lipophilic quenchers 5NS and 16NS 70 mM were prepared in ethanol. All stock solutions were stored at 4 ºC, except 5NS and 16NS (stored at -20 ºC).
2.2. Methods
2.2.1. Peptides
cholesterol (Chol), palmitic acid (Palm) or α-tocopherol (Toco) - with or without a four unit polyethylene glycol (PEG) spacer in between, as presented in Figure 2.1.
Stock solutions of each peptide, with a final concentration of 500 μM, were prepared in dimethyl sulfoxide (DMSO) and stored at 4 ºC.
2.2.2. Biomembrane systems preparation
Liposomes
Different lipids such as POPC, Chol and SM were weighed to generate vesicles of diverse compositions: pure POPC, POPC:Chol (2:1) and POPC:Chol:SM (1:1:1). The lipids were dissolved in an organic solvent (POPC and POPC:Chol in chloroform and POPC:Chol:SM in a chloroform:methanol (12:1) mixture), and mixed in a round-bottom flask. A thin lipid film was formed by solvent evaporation using a gentle N2 (g) flow. In order to remove residual organic solvent and, therefore, obtain a completely dried film, the flask was connected to a vacuum pump overnight. The dried lipid film was hydrated with buffer (HEPES) and, at least, 8 freeze-thaw cycles were performed until the formation of a liposome suspension of multilamellar vesicles (MLV). Large unilamellar vesicles (LUV) were obtained by extrusion (Mayer et al., 1986), using a mini-extruder (Avanti Polar Lipids, Alabaster, AL, USA), 1001RN syringes (Hamilton, Reno, NV, USA) and 100 nm pore polycarbonate 10 mm diameter membranes (Nucleopore-Whatman, Kent, UK). LUV with, approximately, 100 nm of diameter were obtained.
Figure 2.1 - Representation of enfuvirtide, T20* and its lipid derivatives.
18 Biological samples
Erythrocytes isolation
Blood samples were centrifuged for 10 min at 1200 g (Sorvall TC6 Centrifuge, H400 rotor) to remove plasma and buffy-coat. Isolated erythrocytes were washed, at least twice with working buffer, and a 100% hematocrit sample was obtained (Matos et al., 2010a).
Peripheral blood mononuclear cells (PBMC) isolation
PBMC were isolated from blood samples using a density gradient medium LymphoprepTM. Samples were centrifuged for 30 min at 540 g, allowing the removal of plasma, isolation of buffy-coat containing the desired cells and keeping the erythrocytes’ pellet intact (Matos et al., 2010a). Isolated PBMC were washed at least twice with working buffer and an erythrocytes lysis buffer (157 mM NH4Cl, 10 mM KHCO3, EDTA 5%, pH 7.4) was used in order to prevent possible contaminations. In the washing steps, samples were centrifuged for 10 min at 100 g.
2.2.3. Fluorescence spectroscopy measurements
Peptide aggregation
T20* derivatives, by being conjugated with lipid moieties, are prone to aggregation when in aqueous solutions; hence, protein aggregation was monitored by ANS fluorescence. ANS is an amphiphilic fluorescent probe sensitive to its microenvironment and is commonly used to evaluate the presence of hydrophobic pockets in proteins and peptides. The probe exhibits a low quantum yield (and therefore, low fluorescence emission) in aqueous solution; however, when located in a less polar environment, its quantum yield (and fluorescence intensity) increases, and its emission maximum shifts to lower wavelengths (Henriques et al., 2008).
A solution containing 12.8 μM of ANS in HEPES buffer was titrated with a stock solution of each peptide to achieve a final concentration within the 0-8 μM range. ANS fluorescence emission spectra were obtained from 400 to 600 nm, with an excitation wavelength (λexc) of 369 nm, using an Edinburgh Instruments FLS920 Series fluorescence spectrophotometer (Livingston, UK). Excitation and emission bandwidths were set to 5 and 10 nm, respectively.
Partition coefficient determination
The intrinsic fluorescence of T20* and its conjugates, as these peptides contain three tryptophan residues, allows the quantification of its membrane insertion. The fluorescence of this aromatic amino acid is strongly dependent of the physical properties of its micro-environment and can change significantly upon peptides’ insertion in the membrane.
For each peptide, the partition coefficient between an aqueous and a lipid phase in equilibrium can be described as (Matos et al., 2010b; Santos, 2003):
⏞
(2.1)
where and are the moles of lipid and water and and are the moles of peptide in lipid and water, respectively. Under most experimental conditions, the quantity of peptide is considerably lower in both phases than the total quantities of water or lipid ( ), therefore this equation can by simplified to:
⏞
(2.2)
In most literature it is common to represent the partition coefficient as a function of the volumes of each phase ( ) instead of the water and lipid quantities:
⏞
(2.3)
This parameter, named the Nernst partition coefficient can be related with equation (2.2) by:
(2.4)
where is the molar volume of water ( ) or lipid ( ).
20
(2.5)
Diverse membrane compositions, specifically POPC, POPC:Chol (2:1) and POPC:Chol:SM (1:1:1), were used to assess the peptides’ membrane partition coefficient. A fixed concentration of 10 μM of peptide in a HEPES buffer solution was titrated with a 15 mM LUV suspension, freshly prepared, yielding a final lipid concentration ranging from 0 to 5 mM. Preceding the fluorescence emission analysis, an incubation time of 10 min was used after each addition of LUV suspension, to stabilize peptides’ interaction with lipid membranes. The fluorescence emission spectrum of each peptide was recorded between 310 and 450 nm, considering that the maximum emission of the tryptophan residue in aqueous solution is 350 nm, and a λexc of 280 nm was used. The lipid titration was also performed on samples without peptide. Samples containing HEPES buffer and a tryptophan solution (30 μM) in HEPES buffer, both with DMSO as well, were used as a blank and control, respectively.
The intensity data of the nonpartitioning Trp was used to correct the scattering effects resulting from the successive addition of LUV. The correction factor for each addition is as follows (Ladokhin et al., 2000):
( )
( )
( )
(
2.6)where is the fluorescence intensity of the peptide, the lipid concentration and and
the fluorescence intensity of the tryptophan residue in the absence and presence of the lipid, respectively.
Membrane dipole potential assessment
Cellular lipid bilayers have three types of electrostatic potentials associated to them: transmembrane potential,
Δ
Ψ
, as a result of an imbalance of charge and an electrical potential difference across the membrane by the selective transport of ions and, therefore, a difference in the ion concentration in both sides of the membrane; surface potential,Ψ
S, generated by the charged head-groups ofphospholipids and the adsorbed ions at the interface, resulting in an accumulation of charges in the outer surface of the membrane; and dipole potential,
Ψ
d, which arises from the orientation of dipoleSince the dipole potential originates from oriented dipoles in the membrane/water interface, macromolecules interacting with lipid membranes can cause a change in the potential by the destabilization of such organization and/or by the contribution of their own dipoles to the membrane dipole potential. Thus, monitoring dipole potential alterations is a useful tool to study membrane interactions with molecules, such as proteins and peptides, particularly if they are not intrinsically fluorescent. Moreover, this avoids the requirement to derivatize peptides and proteins, which can modify their structure and, consequently, the function of these molecules. This strategy is also advantageous on the study of cell systems, as the peptides’ intrinsic fluorescence is interfered by other cellular proteic components (Matos et al., 2010b; Wang, 2012). Regardless the intrinsic fluorescence of T20* and its conjugates, their interaction with membranes was also evaluated by alterations in the dipole potential.
One of the fluorescent membrane probes described as sensitive to alterations in the dipole potential is di-8-ANEPPS (Gross et al., 1994).
Figure 2.2 - Schematic representation of the three types of membrane potential.
ΔΨ is the transmembrane potential, ΨS, the surface potential
and Ψdis the dipole potential. Typical values of dielectric
constant, ε, are given (Wang, 2012).
Figure 2.3 - Structure of di-8-ANEPPS (blue) between phospholipids (black).
22
This probe consists in two aliphatic chains, facilitating its incorporation in the outer leaflet of the membrane, attached to a chromophore region (conjugated structure) that stays nearby the lipid head-group region and senses the electric fields derived from the dipoles, acting as a reporter. This probe is believed to be electrochromic, i.e., a shift in the absorption and emission spectra occur under the influence of an electric field (Wang, 2012). A dual wavelength ratiometric measurement can be carried with the benefit of the signal being independent of probe or cell concentrations and avoiding photobleaching artifacts. Di-8-ANEPPS can only be used as a ratiometric probe of dipole potential if the measurements are based on excitation spectrum shifts (Vitha & Clarke, 2007). Thus, the excitation wavelengths of 455 and 525 nm ( ) were used and the emission wavelength was set to 670 nm in order to avoid membrane fluidity artifacts (Clarke & Kane, 1997; Gross et al., 1994). Additionally, a large excess of lipid relative to the probes’ quantity has to be used to ensure that the probe itself does not modify the dipole potential significantly (Clarke & Kane, 1997; Wang, 2012). The variation of the intensities ratio, , with the peptide concentration can be analyzed by a single binding site model (Cladera & O’Shea, 1998):
(2.7)
with the values normalized for the value in the absence of the peptide,
.
is the asymptotic minimum value of and is the dissociation constant.For a better observation of the excitation spectra shifts, data can be transformed in differential spectra by subtracting the normalized excitation spectra of the probe without the interacting peptide and the spectra in its presence. A sinusoidal curve with one minimum and one maximum, cutting across the axis is obtained, as exemplified in Figure 2.4.
Figure 2.4 - Representation of membrane dipole potential probed by di-8-ANEPPS.
As indicated before, the ratio of intensities, , is calculated by the quotient of the values at two wavelengths of the differential spectra. An increase in dipole potential leads to a blue shift in the excitation spectrum, resulting in an increased ratio value. Conversely, the decreasing potential leads to a red shift and a consequent decrease of the ratio. If the dipole potential remains unchanged, as there is no interaction between the peptide and the membrane, a shift in the excitation spectra is not expected.
Membrane dipole potential on LUV
In order to assess membrane dipole potential, LUV were labeled with the probe di-8-ANEPPS. A solution containing 500 μM of freshly prepared liposomes were incubated overnight with di-8-ANEPPS 10 μM, to maximize the incorporation of the probe in the membrane. Prior to fluorescence measurements, each peptide, yielding a final concentration within a range of 0-7 μM, was incubated with di-8-ANEPPS-labeled LUV for 1 h at room temperature. Excitation spectra and the ratio of intensities at the excitation wavelengths of 455 and 525 nm (
)
were obtained with the emission wavelength of 670 nm. Excitation and emission slits were set to 5 and 10 nm, respectively. As a control, liposomes incubated with ethanol instead of di-8-ANEPPS were also included.Membrane dipole potential on biological samples
Erythrocytes
A 1% hematocrit suspension of erythrocytes in HEPES buffer supplemented with 0.05% Pluronic F-127, from a previously prepared 10% hematocrit sample, was used for labeling with di-8-ANEPPS 10 μM. The suspension was incubated at room temperature for 1 h, with gentle agitation and protected from light. In order to remove unbound di-8-ANEPPS, two wash cycles were performed with centrifugations at 1500 g for 5 min.
T20* and its derivatives, with a final concentration ranging from 0 to 6 μM, were incubated with erythrocytes at 0.02% hematocrit for 1 h and at room temperature, before fluorescence measurements. The experimental conditions of fluorescence measurements were identical to those previously described for LUV.
Peripheral blood mononuclear cells (PBMC)
24
A concentration of 100 cells/μL was used to incubate PBMC with different concentrations of each peptide, within a range of 0-6 μM, for 1 h at room temperature. The experimental conditions of fluorescence measurements were identical to those previously described for LUV.
The variation of with the peptide concentrations for the different types of biomembranes was analyzed by a single binding model.
Fluorescence quenching
Fluorescence quenching refers to any process that decreases the fluorescence intensity of a given substance. An array of molecular interactions such as energy transfer, ground-state complex formation, molecular rearrangements, excited-state reactions or collisional quenching can result in the decrease of a molecules’ fluorescence intensity (Lakowicz, 2006). A quenching process, either static or dynamic, can occur if the fluorophore and the quencher are in contact with each other. In dynamic or collisional quenching, the quencher has to diffuse to the fluorophore during the lifetime of the excited state and, upon contact, the fluorophore returns to the ground state without emission of a photon. In static quenching, the fluorophore and quencher form a nonfluorescent complex. This molecular contact requirement allows the use of quenching experiments to disclose the accessibility of fluorophores to quenchers and, therefore, reveal the localization of fluorophores in proteins and membranes. If the fluorophore is located in the interior of a macromolecule, the quencher is unable to establish contact and neither collisional nor static quenching can occur (Lakowicz, 2006). Fluorescence’s collisional quenching is described by the Stern-Volmer equation:
(2.8)
where
I
0 andI
are the fluorescence intensities in the absence and presence of quencher, respectively,
K
sv is the Stern-Volmer constant and [Q] the concentration of quencher (Lakowicz, 2006). Low values ofK
sv usually indicate that the fluorophore is inaccessible to water soluble quenchers and a higher value of this constant is an indication that the fluorophore is reachable; it could be free in solution or on the surface of a macromolecule.Quenching by acrylamide
residues. As the concentration of quencher increases, some artifacts may arise; acrylamide also absorbs at the exciting light, thus an increasing fraction of light is absorbed by the quencher and, because the overall absorption by the sample is increased, the penetration of the exciting light is less efficient, leading to a decreased fluorescence emission detection. For this reason, a correction of the fluorescence intensities by a correction factor, CF, is necessary (Coutinho & Prieto, 1993):
(
)
(2.9)where AbsT is the absorbance of the total solution and AbsF is the absorbance of the fluorophore at the
initial concentration. Absorption measurements were performed on a Genesys 10S UV-Vis spectrophotometer (Thermo Fisher Scientific, Madison, WI, USA) at 290 nm.
Quenching data were analyzed using the Stern-Volmer equation.
Quenching by 5NS and 16NS
Fluorescence quenching can also be a valuable tool to evaluate the depth of insertion in the membrane of a fluorophore, as an accurate determination of this parameter is an important step in protein and peptide-membrane interactions (Ladokhin, 2014). This can be achieved using steric acid molecules with doxyl (quencher) groups attached at different positions, such as 5-doxyl-stearic acid (5NS) and 16-doxyl-stearic acid (16NS).
26
As depicted in Figure 2.5, 5NS, a stearic acid with the doxyl group at carbon 5 is a better quencher for molecules in a shallow position, close to the lipid-water interface, while 16NS, a molecule with the doxyl group attached to carbon 16, is expected to quench preferentially molecules buried deeply in the membrane (Fernandes et al., 2002).
An identical procedure to the quenching by acrylamide was used: a solution of each peptide (10 μM) was incubated with 3 mM POPC:Chol (2:1) LUV and successive additions of small volumes of 5NS or 16NS were made. The effective concentration of quencher at the membrane level was determined from the partition coefficient of both lipophilic molecules to biomembranes (Santos et al., 1998), and range from 0 to ≈ 0.6 M. For every addition, a 10 min incubation time was allowed before measurement. The same lipid suspension was used in both cases.
Steady-state fluorescence measurements were carried out with a λexc of 280 nm and the emission spectra were recorded between 310 and 450 nm. The SIMEXDA method (Fernandes et al., 2002) was applied to obtain the depth of Trp insertion in the membrane.
With the exception of ANS fluorescence, all fluorescence measurements mentioned above were conducted in a Varian Cary Eclipse fluorescence spectrophotometer (Mulgrave, Australia), with a controlled temperature of 25 ºC.
28
In previous works, it was demonstrated that the addition of a lipid moiety to a fusion inhibitor peptide increased its efficiency towards HIV-1 inhibition (Augusto et al., 2014; Hildinger et al., 2001; Hollmann et al., 2013; Ingallinella et al., 2009). Taking this into account, a previous assessment of the antiviral activity was obtained through collaboration with Prof. Matteo Porotto (Departments of Pediatrics and of Microbiology and Immunology, Weill Medical College of Cornell University, New York, USA). The conjugated peptides presented an increased antiviral activity, with an approximately 280-fold decrease of the half maximal inhibitory concentration (IC50) relative to the unconjugated peptide, T20*. The antiviral activity parameters for U87 cell line, viral strain SF162 are listed in Table 3.1.
Table 3.1 – Antiviral activity of different HIV-1 fusion inhibitors (U87 cell line; viral strain SF162).
Fusion inhibitor IC50 (nM)
T20* 640
T20*-Chol 2.28
T20*-PEG4-Chol 21.8
T20*-PEG4-Palm 2.44
T20*-Toco 6.44
T20*-PEG4-Toco 2.48
3.1. Peptide aggregation
The conjugation of peptides with lipid moieties may increase their susceptibility to aggregate in aqueous solution. For that reason, peptide aggregation was followed by ANS fluorescence.
In the presence of hydrophobic regions, ANS fluorescence emission shifts to lower wavelengths (blue shift). A blue shift is observed in the ANS’ maximum fluorescence emission for all conjugated peptides (Figure 3.1), which indicates the presence of aggregates in solution. Conversely, T20* does not seem to aggregate upon increasing its concentration. In its sequence, T20* has charged residues intercalated with hydrophobic ones (Figure 2.1 – Materials and methods), which can prevent its aggregation in aqueous solution. To quantitatively differentiate the aggregation of the conjugated peptides, a fitting of the normalized fluorescence intensity data was performed (Figure 3.2). Fitting parameters are summarized in Table 3.2.
Figure 3.1 - Fluorescence spectra of ANS titrated with T20* and its derivatives.
30
Table 3.2 – Slope, intercept and R2 values determined from the linear fit of ANS fluorescence intensity vs. peptide concentration data.
The slope (m), intercept (b) and the square of the correlation coefficient (R2) of the fit are represented for each peptide. The values represent mean ± SEM.
Peptide m b R2
T20* 0.0404 ± 0.00261 1.042 ± 0.0109 0.914
T20*-Chol 0.216 ± 0.00831 1.087 ± 0.0343 0.969
T20*-PEG4-Chol 0.278 ± 0.00538 1.103 ± 0.0222 0.992
T20*-PEG4-Palm 0.177 ± 0.00451 1.054 ± 0.0186 0.986
T20*-Toco 0.213 ± 0.00871 1.064 ± 0.0359 0.965
T20*-PEG4-Toco 0.261 ± 0.00775 1.100 ± 0.0312 0.981
The slope of the fit confirms that T20* is the least prone to aggregation. Conversely, although all conjugated peptides tend to form aggregates, T20*-PEG4-Chol and T20*-PEG4-Toco have the highest propensity. Although previous studies have reported that the PEG spacer improved substantially peptide solubility in aqueous media (Porotto et al., 2010), this feature was not observed for T20* conjugates.
3.2. Membrane partition
The evaluation of fusion inhibitor peptides’ interaction with membranes is a key aspect of their mode of action, since the efficiency of the drug can be correlated with the membranotropic properties of the peptide (Hollmann et al., 2013). Therefore the peptides’ partition to biomembrane model systems was assessed by means of peptide intrinsic fluorescence. Three membrane compositions were used: POPC, to mimic the fluidity properties of biological membranes, POPC:Chol (2:1), that mimics cholesterol-rich membranes, and POPC:Chol:SM (1:1:1), in order to replicate lipid rafts.
Figure 3.2 – Dependence of fluorescence intensity with peptide concentration.
The partition coefficient,
K
p, for each peptide was determined from the fitting of equation 2.5 (see Materials and methods) rearranged, to the fluorescence intensities ratio (I
/I
w) ratio vs. lipid concentration data. TheK
p, andI
/I
w values obtained are summarized in Table 3.3.Figure 3.3 – Partition of the peptides to lipid vesicles.
32
Table 3.3 - Partition coefficients of different fusion inhibitor peptides.
The partition coefficient (Kp) and I /Iwvalueswere obtained from the fitting of the data obtained for T20* and its
conjugates interaction with LUV of different compositions.
a The type of partition curve obtained impairs the use of the equation.
LUV Peptide
K
pI
/IwPOPC
T20* 68.85 ± 42.00 3.521 ± 1.295
T20*-Chol 149.3 ± 33.66 5.318 ± 0.7056
T20*-PEG4-Chol 1037 ± 181.1 2.754 ± 0.1148
T20*-PEG4-Palm 3417 ± 312.8 2.500 ± 0.03414
T20*-Toco 132.8 ± 46.48 3.736 ± 0.7134
T20*-PEG4-Toco 232.4 ± 35.81 4.132 ± 0.3100
POPC:Chol (2:1)
T20* ≈ 0 --
T20*-Chol 27.38 ± 38.19 11.22 ± 13.23
T20*-PEG4-Chol 575.5 ± 69.56 3.318 ± 0.1315
T20*-PEG4-Palm 537.4 ± 57.51 3.150 ± 0.1108
T20*-Toco --a --
T20*-PEG4-Toco 106.6 ± 29.60 5.799 ± 1.040
POPC:Chol:SM (1:1:1)
T20* ≈ 0 --
T20*-Chol
--a --a
T20*-PEG4-Chol
T20*-PEG4-Palm
T20*-Toco
T20*-PEG4-Toco
In the presence of POPC vesicles, the fluorescence intensity of T20* and the conjugates increases, indicating that an interaction between the peptides and membrane takes place. In a previous work, it was reported that, for POPC membranes, enfuvirtide has a
K
p of 1600 ± 100 (Veiga et al., 2004a), which is much higher than the obtained for T20* (K
p = 68.85 ± 42.00). Such difference may be due to the extra 6 amino acid residues of T20*, near to Trp rich region of the peptide, which may influence its partition to membranes.had a significantly higher
K
p, which is not the case. This suggests that the tryptophan residues of the peptide are in a more hydrophilic environment.Similarly to what has been reported for enfuvirtide (Veiga et al., 2004a), peptides’ interaction is diminished in cholesterol containing membranes. Still, T20*-PEG4-Chol and T20*-PEG4-Palm have the highest
K
p values, suggesting that PEG may potentiate membrane partition.Due to the type of partition curves obtained, it was not possible to determine the partition coefficients for POPC:Chol:SM membranes.
T20*-Toco and T20*-PEG4-Toco interact with lower extent with POPC and POPC:Chol membranes and have the lowest antiviral activity amongst the conjugated peptides. Therefore, these peptides were not considered for further analysis.
3.3. Membrane dipole potential
34
A decrease in the dipole potential is characterized by the minimum of the differential spectra to be at lower wavelengths than its maximum. This change depends on the peptide and its concentration. As it can be seen in Figure 3.4 (A, B), all T20* conjugates have a higher influence in the membrane dipole potential than T20*, in good agreement with the partition data.
In order to quantify the interaction between the peptides and the different lipid model systems, the ratio was plotted as function of the peptide concentration (Figure 3.4 - C, D). Affinity constants can be determined by the fitting of equation 2.7 (Materials and methods) to the dipole variation curves. The obtained values are summarized in Table 3.4.
Figure 3.4 - Fusion inhibitor interactions with di-8-ANEPPS labeled LUV.
Table 3.4 - Quantification of peptide binding to LUV.
Comparison of the dissociation constant values, Kd, obtained from the binding profiles of T20* and conjugates
with POPC and POPC:Chol, with the correspondent square of the correlation coefficient (R2) of the fitted curve. Values are presented as mean ± SEM.
a The type of curve obtained impairs the use of the equation.
Peptide POPC POPC:Chol
K
d(μM) R2K
d(μM) R2T20* --a -- 2.79 ± 1.53 0.704
T20*-Chol 2.06 ± 0.93 0.782 1.76 ± 0.23 0.970
T20*-PEG4-Chol 6.45 ± 2.07 0.946 2.33 ± 0.23 0.985
T20*-PEG4-Palm 5.12 ± 0.98 0.975 3.18 ± 0.40 0.980
The conjugated peptides present lower
K
dvalues than the unconjugated one for POPC vesicles, which suggest that the affinity towards membranes increase with the addition of a lipid moiety, in agreement with the partition data. Regarding to POPC:Chol vesicles, although T20* presents a higherK
d value than T20*-PEG4-Palm, and in spite of achieving a curve fit for the first (Figure 3.4, D - Inset), the correlation coefficient is fairly low (R2 = 0.704) and for that reason the estimatedK
d value might not be reliable.36
Similarly to the data obtained for liposome membranes, all T20* conjugates seem to cause a more pronounced decrease in the membrane potential dipole than T20*. Affinity constants can be determined for the interaction of peptides with di-8-ANEPPS labeled blood cells, and the obtained results are summarized in Table 3.5.
Figure 3.5 - Fusion inhibitor interactions with di-8-ANEPPS labeled cells.
Table 3.5 - Quantification of peptide binding to blood cells.
Comparison of the dissociation constant values, Kd, obtained by the binding profiles of T20* and conjugates to
PBMC and erythrocytes, with the correspondent square of the correlation coefficient (R2) of the fitted curve. The values are presented as mean ± SEM.
a The type of curve obtained impairs the use of the equation.
Peptide PBMC Erythrocytes
K
d(μM) R2K
d(μM) R2T20* 2.86 ± 2.13 0.750 --a --
T20*-Chol 0.239 ± 0.048 0.884 0.125 ± 0.020 0.931
T20*-PEG4-Chol 0.309 ± 0.071 0.853 0.215 ± 0.030 0.943
T20*-PEG4-Palm 0.181 ± 0.034 0.900 0.313 ± 0.027 0.978
Concerning the interaction of the peptides with human blood cells, all conjugated peptides exhibit higher affinity than T20*. T20*-PEG4-Palm presents the highest affinity towards PBMC, while T20*-Chol has the highest affinity to interact with erythrocytes. Overall, the conjugated peptides present a higher affinity for erythrocytes when compared to PBMC. This reinforces that the peptides may interact preferentially with cholesterol containing membranes, since erythrocytes have cholesterol-rich membranes (Leidl et al., 2008).
As these peptide drugs are expected to be injected, since oral administration should not be viable, peptide binding to blood cells has high relevance.
One of HIV-1 main targets for replication and distribution all over the body are erythrocytes: it is known that the virus can associate with erythrocytes in vivo (Hess et al., 2002) and can bind to erythrocyte membrane in vitro (Beck et al., 2009). Moreover, trans-infection of other immune system cells present in the blood can be mediated by the erythrocytes-bound viruses (Banki et al., 2006; He et al., 2008a). For this reason, these cells with a pre-bound fusion inhibitor peptide could potentially restrict virus spreading through the body, and upon interaction, the virus itself could remain with the fusion peptide in its own membrane, since HIV virus and erythrocytes appear to have a similar membrane composition (Aloia et al., 1988). Moreover, PBMC, which include HIV-1 preferential target cells, contribute significantly to the virus replication as it has been reported that virus bound to the surface of cells remains infectious for T cells (Olinger et al., 2000).
When injected, the fusion inhibitor peptides can be dissolved in the plasma, bound to plasma proteins, and also bound to cell membranes (Matos et al., 2010a). Therefore, concentrating antiretroviral peptides in cell membranes would enhance their availability towards the targets of the virus, increasing their efficiency and diminishing the amount of peptides bound to plasma proteins, which enhances drug clearance.
38
3.4. Localization in the lipid bilayer
In order to evaluate the location of the peptides in the membrane, we took the advantage of the quenching phenomena by using quenchers with different locations in the membrane. First, the accessibility of the tryptophan residues to the aqueous environment was evaluated by the fluorescence quenching of the peptides’ intrinsic fluorescence by acrylamide. As the conjugated peptides appear to have an higher affinity towards cholesterol-rich membranes, only POPC:Chol (2:1) membranes were considered.
Figure 3.6 - Accessibility of the peptide to the aqueous environment.