Sónia Cristina Heleno Correia
Bachelor degree in Applied Chemistry
Molecular analysis of microRNA
-
target
gene interactions in the pine seed
Dissertation to obtain the Master Degree in
Molecular Genetics and Biomedicine
Supervisor:
Célia Miguel, PI, iBET & ITQB NOVA.
Jury:
Arguer: Dr. Pedro Miguel Rodrigues de Barros
President: Prof. Dra. Paula Maria Theriaga Mendes Bernardo Gonçalves Supervisor: Prof. Dra. Célia Maria Rodrigues Miguel
L
O
M
B
A
D
A
Molecular analysis of microRNA-target gene interactions in the pine seed
Sónia Correia
Sónia Cristina Heleno Correia
Bachelor degree in Applied Chemistry
Dissertation to obtain the Master Degree in Molecular Genetics and Biomedicine
Molecular analysis of microRNA-target gene interactions in the pine seed
Supervisor:
Célia Miguel, PI, iBET & ITQB NOVA
Jury:
Arguer:
Dr. Pedro Miguel Rodrigues de Barros
President:
Prof. Dra. Paula Maria Theriaga Mendes Bernardo Gonçalves
Supervisor:
Prof. Dra. Célia Maria Rodrigues Miguel
Molecular analysis of microRNA-target gene interactions in the pine seed
Copyright Sónia Cristina Heleno Correia, FCT/UNL, UNL.
VII
Acknowledgements
To all my family, friends and colleagues who supported and believed in me, and went along with me in the good and bad moments, thank you!
To Célia Miguel who accepted and welcomed me for this project thesis, being perseverant and always available for doubts discussion and to guide me in the right direction, I’m so grateful!
To Andreia Rodrigues, my laboratory mother, who explained and taught almost everything in the lab, who dedicated me time of her PhD thesis, who spend whole nights and weekends in the hard final moments, and even in the Netherlands continued to help me in whatever I needed, thank you so, so much! You are a model who I have in great consideration a big kiss and luck to finish your thesis and in this step of your journey.
To Bruno Costa, the lab bioinformatitian, who taught me the first steps in command lines and how to deal with Linux, who has been available until the end, a big thank you and I owe you a coffee, beer and chocolates!
To Susana who performed many times of live mannequin so I could observe and absorb technics, who taught me how to maintain liquid cell cultures, how to isolate protoplasts, and to perform viability tests using the right fluorophores, thank you for your kindness and reasonable thinking.
To the rest of my lab colleagues Inês Chaves, Inês Modesto, Sofia Leal, Sofia Gonçalves, José Cerca, Cirenia Arias, Andreia Matos and Pedro, who created such a good work environment thank you for the support and contribution with ideas and discussion of work problems, and for the stories, teachings, laughs and joy in the pause moments, more than colleagues you became friends.
To my family who supported me and my special temperament in the last few times of writing, sorry and thank you. To my brother who always kept my feet on the ground, to my sister for her adolescent craziness and sweetness, to my cousin for the long talks, laughs and unconditional support, thank you dears I love you! To my grandfathers for all the contribute in my life, they have part in what I am now. And a giant thanks to my parents, for their love, patient and support, without them
this wasn’t possible.
IX
Resumo
Pinus pinaster é uma espécie de conífera com elevado valor ecológico e económico. O território ocupado por esta espécie, distribuída pela região mediterrânea, tem vindo a diminuir sobretudo devido a causas ambientais. A embriogénese somática possibilita a propagação em grande escala de plantas adaptadas a variados stresses permitindo contornar este problema. No entanto, esta técnica encontra-se pouco desenvolvida em P. pinaster. O estudo de reguladores da expressão génica como miARNs poderá contribuir para a sua optimização.
Os miARNs regulam a expressão génica a nível pós-transcripcional através da clivagem de mARNs ou da repressão da tradução. Neste trabalho, foram estudadas quatro interacções de clivagem entre miARN e mARN alvo. Primeiro, através da análise de dados de sequenciação com recurso a ferramentas bioinformáticas, foram previstos os mARNs alvo para uma lista de miARNs, dos quais sete pares miARN-alvo foram seleccionados. Seguidamente foi analisada a expressão de quatro mARNs alvo por RT-qPCR, em dois estádios embriogénicos, T4B (pré-cotiledonar) e T7 (maduro). Os quatro transcritos incluem ARF 10, 16, 17 (regulado pelo miR160) e F-box (regulado pelo miR482a); e dois clivados por novos miARNs: LEA (regulado pelo M09664) e PPR (regulado pelo M06658). Todos os transcritos apresentaram maior expressão em T4B.
Outros parâmetros como, conservação do miARN e do seu alvo, complementaridade entre miARN e alvo, e comparação de expressão entre miARNs e respectivos mARNs alvo, foram também abordados de forma a contribuir para a selecção de pares com elevada confiança. Apenas o par miARN160 e alvo ARF preencheu todas as condições.
Assim, foram identificados pela primeira vez potenciais alvos de miARNs em P. pinaster. Este trabalho contribuiu para o aumento do conhecimento sobre miRNAs em coníferas, apontando para potenciais funções no desenvolvimento embrionário. No entanto, são precisos mais estudos para validação das interacções entre os pares miARN-mARN alvo aqui estudados.
XI
Abstract
Pinus pinaster is a conifer species with high ecologic and economic value which covers a vast area of the Mediterranean region. However, the area occupied by P. pinaster has been decreasing mainly due to environmental causes. Somatic embryogenesis may contribute to circumvent this problem as it allows the large-scale propagation of plants adapted to several stresses. However, this technique is poorly understood in P. pinaster and the study of gene expression regulators like miRNAs may contribute to its improvement.
MiRNAs regulate gene expression at post-transcriptional level by mRNA cleavage or translation repression. In this work, a set of four miRNA-mRNA target cleavage interactions were studied. First, mRNAs targets were predicted for a list of miRNAs using bioinformatics tools to analyze available sequencing data, and seven miRNA-mRNA pairs were selected. Second, the expression of four of the mRNAs were analyzed by RT-PCR in two embryo developmental stages, T4B (pre-cotyledonary) and T7 (mature). The four transcripts included ARF 10, 16 ou 17 (regulated by miR160), F-box (regulated by miR482a), LEA (regulated by miRM09664) and PPR (regulated by miRM06658). All transcripts show a higher expression in T4B than in T7 stage. Several parameters were studied to ensure that high-confidence pairs were selected, namely conservation of miRNA and respective target, complementarity between miRNA and respective target, relation between miRNA expression and target expression. Only miRNA160-ARF target fulfilled all the conditions.
It was the first time that potential miRNA targets were identified in P. pinaster. This work contributed to uncover the miRNA landscape in conifers, pointing to potential functions in embryo development. However, more experiments are needed to further validate the interaction between the miRNA-mRNA targets studied.
XIII
Contents
Acknowledgements ... VII Resumo ... IX Abstract... XI List of abbreviations and acronyms ... XXIII
1. Introduction ... 1
1.1. Pinus pinaster - Distribution, ecologic and economic importance, deforestation and possible solutions... 1
1.2. Embryogenesis in Gymnosperms ... 1
1.3. Somatic embryogenesis ... 4
1.4. Small RNAs (in plants) ... 5
1.4.1. The biogenesis of miRNAs in plants... 5
1.4.2. The miRNA-mediated silencing pathways ... 7
1.4.3. miRNAs origin and conservation ... 9
1.4.4. miRNAs study in conifers ... 10
1.5. Objectives ... 11
2. Materials and Methods ... 13
2.1. Material ... 13
2.1.1. Prediction of miRNA-target pairs involved in seed development ... 13
2.1.1.1. Genomic resources ... 13
2.1.1.2. Software ... 13
2.1.2. Validation of the expression of target pairs in seed development ... 13
2.1.2.1. Biological material ... 13
2.1.2.2. Kits ... 13
2.1.2.3. Oligonucleotides ... 14
2.1.2.4. Chemicals and reagents ... 15
2.1.2.5. Other lab material ... 15
2.1.2.6. Equipments ... 15
2.1.2.7. Software ... 15
2.2. Methods ... 16
2.2.1. Prediction of miRNA-target pairs involved in seed development ... 16
2.2.1.1. In silico miRNA target prediction and miRNAs-target pairs selection for further characterization ... 16
2.2.2. Validation of the expression of miRNA-target pairs in seed development ... 17
2.2.2.1. RNA extraction, purification and sample preparation ... 17
2.2.2.2. cDNA synthesis ... 18
2.2.2.3. Amplification of miRNA targets in the different embryo stages ... 18
XIV
2.2.2.3.2. Optimization of primer amplification conditions ... 19
2.2.2.3.3. RT-qPCR ... 20
2.2.2.3.3. Calculations and Statistical data analysis ... 20
3. Results ... 23
3.1. Prediction of miRNA target genes involved in seed development ... 23
3.1.1. Target prediction of conserved miRNAs ... 23
3.1.2. Target prediction of novel miRNAs ... 24
3.2. Expression of predicted targets in the P. pinaster embryo T4B and T7 stages ... 24
3.2.1. RNA extraction and cDNA synthesis ... 24
3.2.2. Validation of the expression profiles by RT-qPCR: ... 29
4. Discussion ... 33
4.1. Prediction of miRNA target genes involved in seed development ... 33
4.1.1. miRNA target prediction and selection ... 33
Complementarity between miRNA and predicted target ... 35
miRNA target conservation ... 37
4.2. Validation of the expression of miRNA-target pairs in seed development ... 38
MiRNA-target expression analysis ... 41
Multiplicity of target sites ... 43
References ... 47
Annexes ...i
ANNEX I - Previous work ...i
ANNEX III - Determination of RT-qPCR primer amplification efficiency for the reference and target genes among the different tissues and biological replicates ... iii
ANNEX IV - Cq data for relative expression calculations ... xi
ANNEX V - Relative expression between the two biological replicates ... xiii
XV
Index of Equations
XVII
Index of Figures
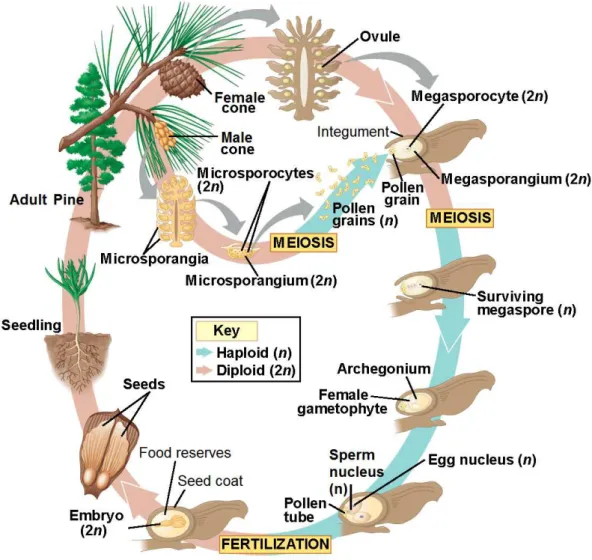
Figure 1.I Pine life cycle. Starting with the seed germination into a fertile adult tree, the development
of its sexual organs and production of gametes, pollination, and fertilization to produce a new seed. Image adapted from (Campbell and Reece 2008). ... 2
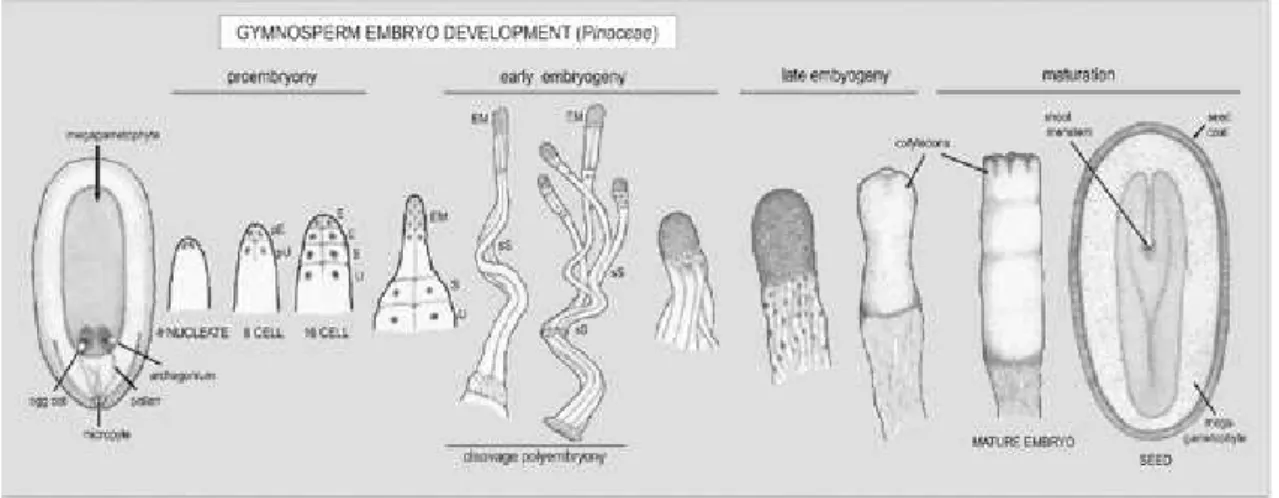
Figure 1.II Schematic overview of gymnosperm (Pinaceae) embryo development. Image adapted from (George 2008). Abbreviation: EP-embryo proper; pU-primary upper tier; pprymary embryonal tier; E-embryonal tier; S-suspensor tier; U-upper tier; EM-E-embryonal mass; sS-secondary suspensor. ... 3
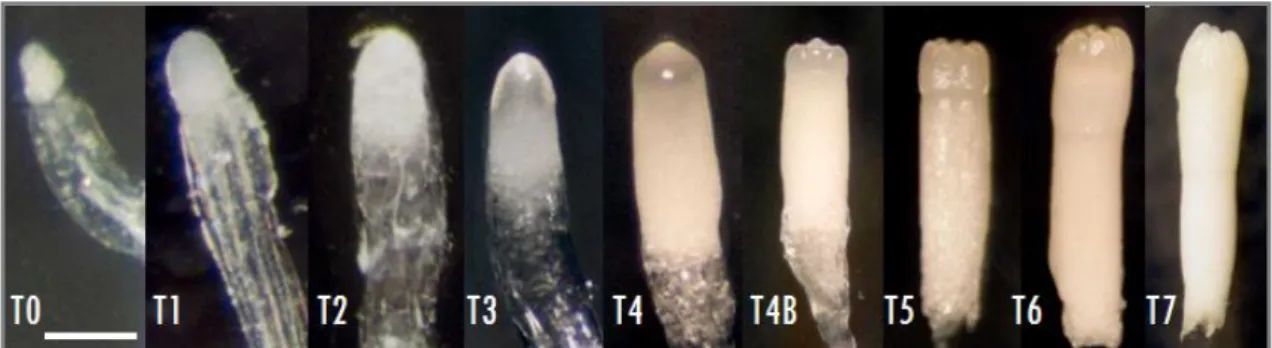
Figure 1.III Pinus pinaster zygotic embryo developmental stages, from T0 to T7, according to the
staging system of Gonçalves et al, 2005a. Bar: T0 and T1 = 300 µm; T2, T3 and T4 = 400 µm; T4B = 800 µm; T5, T6 and T5 = 0.1 cm (Gonçalves, et al. 2005b). ... 4
Figure 1.IV Summary of the major steps in miRNA biogenesis. Adapted from (Rogers & Chen 2013) 6
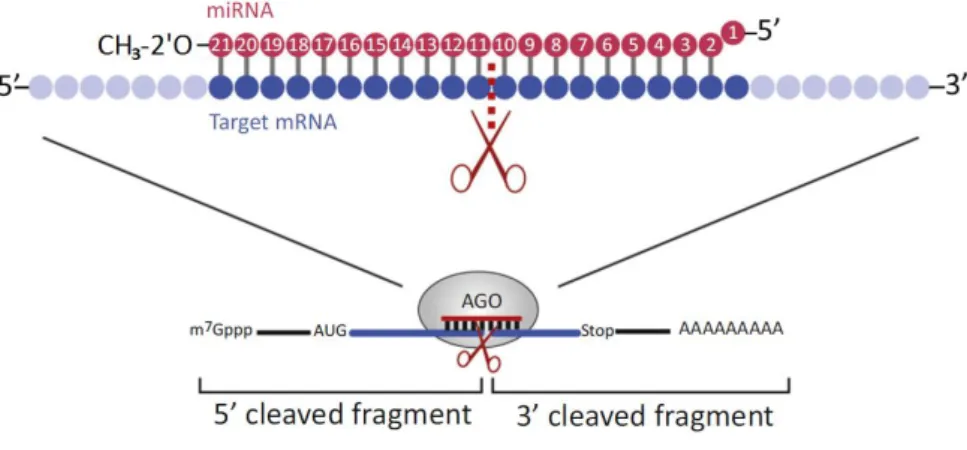
Figure 1.V The molecular mechanism behind the plant miRNAs’ endonucleolytic activity. Image
adapted from (Iwakawa & Tomari 2015). MicroRNAs recognize fully or nearly complementary binding sites on their targets. Usually, upon miRNA nucleotides 9–12 being engaged in Watson–Crick base pairing with their targets, the AGO cleaves the mRNA in the base-paired region; tipically between miRNA nucleotides 10 and 11. The slicing activity of the AGO resides in its PIWI domain. The 3′-most
nucleotide of plant miRNAs is modified with a 2′O-methyl group that protects them from degradation.
The miRNA 5′ terminal nucleotide is buried in the mid domain of AGOs and is not available for pairing
with the target. Legend adapted from (Huntzinger & Izaurralde 2011) ... 8
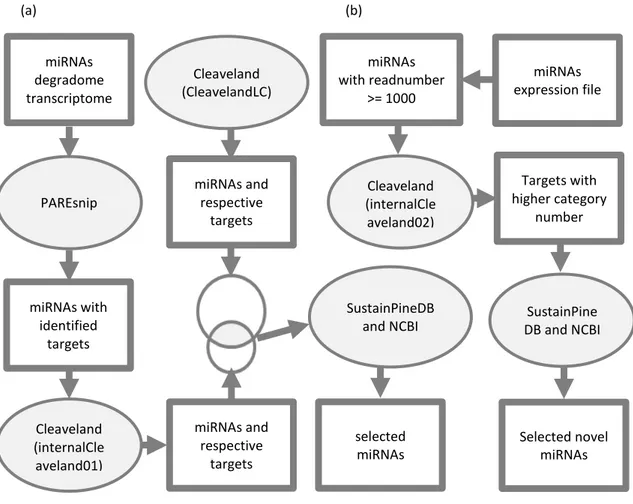
Figure 2.I Scheme of the target identification and selection of miRNAS and respective targets for further validation: (a) first analysis of the total miRNAs; (b) second analysis for novel microRNAs. Higher category number: For each miRNA target prediction, either PAREsnip or Cleaveland, give a
“category number” from 0 to 4. Categories from 0-2 are considered to be of higher category, and consequently less probable to be random degradation products. More information can be found in (Folkes et al. 2012). ... 17
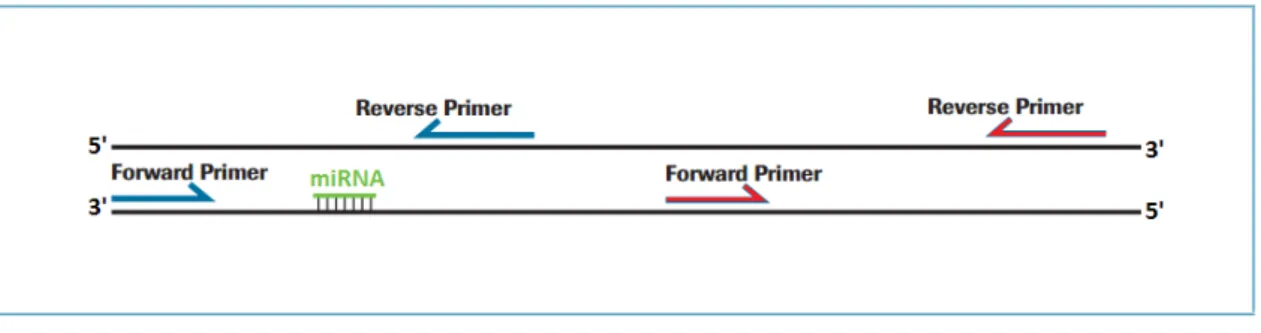
Figure 2.II Exemplification of a potential target of miRNA (mRNA). In green it is represented the
miRNA:mRNA-target interaction region. For each mRNA target two pairs of primers were designed, a pair (in blue) to amplify the cleavage position region and another pair (in red) to amplify the
downstream region of the mRNA target. This strategy of primers’ design was adapted from a
technique developed by Oh et al.(2008) to monitor the miRNA-directed cleavage of mRNAs called regional amplification quantitative RT-PCR (RA-PCR). ... 19
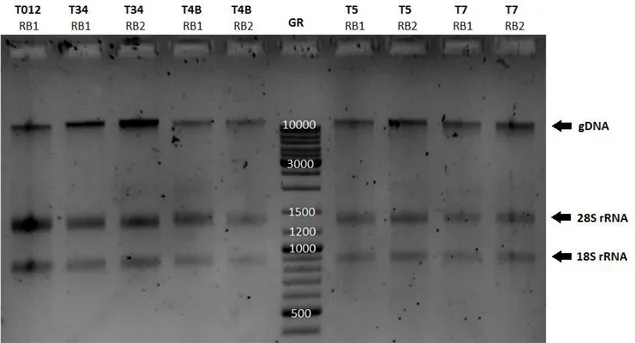
Figure 3.I Separation of the total RNA samples extracted from P. pinaster embryos in a 1% (w/v)
XVIII
Legend: gene ruler 100-10000 bp (GR); biological replicates 1 (RB1) and 2 (RB2); genomic DNA (gDNA); rRNA bands 28S (~1365pb) and 18S (~885). ... 28
Figure 3.II Separation of total RNA samples after TURBO DNase treatment in a 1% agarose gel
stained with RedSafe™ (0.025ul/ml). Run performed at 80V with ~200ng RNA (6:1 of loading buffer).
No gDNA contamination is observed. Some samples present extra faded bands at ~1694 bp and ~2307 bp above the 28s (~1261bp) and 18S (~830bp) band which might represent other RNA bands. Legend: gene ruler 1 100-10000 bp (GR1) and gene ruler 2 100-1000 bp (GR2); biological replicates 1 (RB1) and 2 (RB2); rRNA bands 28S and 18S. ... 28
Figure 3.IIII Relative expression of LEA, PPR, ARF and F-Box genes in the early cotyledonary
embryo stage (T4B) and the mature embryo stage (T7). The columns represent the relative expression and consist in the fold change values calculated by the Pfaffl method with efficiency corrections. The results are normalized to the cDNA of the pool sample, being set to the value of 1. The black bars represent the standard error of the mean (SEM) of the technical and biological replicates. For the first 3 genes a single amplicon of the unigene was quantified; the numerical results for each gene are (T4B: 1.240.095; T7: 0.430.013) for LEA, (T4B: 0.920.054; T7: 0.190.007) for PPR, and (T4B: 1.300.125; T7: 0.110.006) for ARF. For the F-box, two amplicons were independently quantified, one in the potential miRNA binding region (PM) (T4B: 1.870.132; T7:0.160.013) and the other in the downstream region (P3) (T4B:1.930.172; T7: 0.150.010). P-value between expression in T4B and T7 cDNAs: 0.0696 (LEA); 0.0429 (PPR); 0.0661 (ARF); 0.0471 (F-box PM); 0.1198 (F-box P3’). ... 32
Figure III.I Determination of RT-qPCR efficiencies of reference gene ATUB. Ct means were plotted
versus the log [cDNA dilution factor] to slope estimation for efficiency calculation. The linear regression was performed with excel tool. The error bars represent the SD of the Ct mean. Each set of color points corresponds to different cDNA samples, for a different stage and biological replicate, namely T4B_RB1, T4B_RB2, T7_RB1, T7_RB2 and the control pool. ... iii
Figure III.II Determination of RT-qPCR efficiencies for reference gene EF1. Ct means were plotted versus the log [cDNA dilution factor] to slope estimation for efficiency calculation. The linear regression was performed with excel tool. The error bars represent the SD of the Ct mean. Each set of color points correspond to different cDNA samples, for a different stage and biological replicate, namely T4B_RB1, T4B_RB2, T7_RB1, T7_RB2 and the control pool. ... iv
Figure III.III Determination of RT-qPCR efficiencies of reference gene HISTO3. Ct means were plotted
XIX
Figure III.IV Determination of RT-qPCR efficiencies of the ARF encoding transcript. Ct means were
plotted versus the log [cDNA dilution factor] to slope estimation for efficiency calculation. The linear regression was performed with excel tool. The error bars represent the SD of the Ct mean. Each set of color points correspond to different cDNA samples, for a different stage and biological replicate, namely T4B_RB1, T4B_RB2, T7_RB1, T7_RB2 and the control pool. ... vi
Figure III.V Determination of RT-qPCR efficiencies of LEA encoding transcript. Ct means were plotted
versus the log [cDNA dilution factor] to slope estimation for efficiency calculation. The linear regression was performed with excel tool. The error bars represent the SD of the Ct mean. Each set of color points correspond to different cDNA samples, for a different stadium and biologic replicate, namely T4B_RB1, T4B_RB2, T7_RB1, T7_RB2 and the control pool. ... vii
Figure III.VI Determination of RT-qPCR efficiencies of PPR encoding transcript. Ct means were plotted versus the log [cDNA dilution factor] to slope estimation for efficiency calculation. The linear regression was performed with excel tool. The error bars represent the SD of the Ct mean. Each set of color points correspond to different cDNA samples, for a different stadium and biologic replicate, namely T4B_RB1, T4B_RB2, T7_RB1, T7_RB2 and the control pool. ... viii
Figure III.VII Determination of RT-qPCR efficiencies of F-box PM encoding transcript. Ct means were
plotted versus the log [cDNA dilution factor] to slope estimation for efficiency calculation. The linear regression was performed with excel tool. The error bars represent the SD of the Ct mean. Each set of color points correspond to different cDNA samples, for a different stadium and biologic replicate, namely T4B_RB1, T4B_RB2, T7_RB1, T7_RB2 and the control pool. ... ix
Figure III.VIII Determination of RT-qPCR efficiencies of F-box P3 encoding transcript. Ct means were plotted versus the log [cDNA dilution factor] to slope estimation for efficiency calculation. The linear regression was performed with excel tool. The error bars represent the SD of the Ct mean. Each set of color points correspond to different cDNA samples, for a different stadium and biologic replicate, namely T4B_RB1, T4B_RB2, T7_RB1, T7_RB2 and the control pool. ...x
Figure V.IX Relative expression of four different genes among two different stages, the
XXI
Index of Tables
Table 2.I List of primers used for RT-qPCR ... 14
Table 2.II Optimized PCR reaction conditions common to all the selected primers. ... 19
Table 3.I List of conserved and novel miRNAs selected, respective unigene targets and protein annotations ... 25
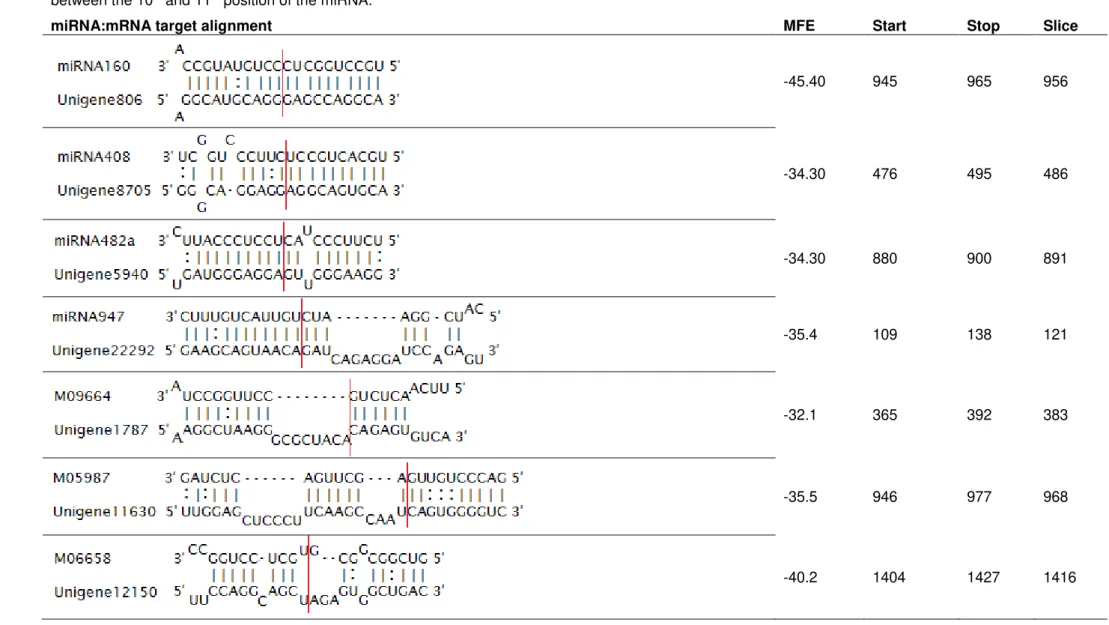
Table 3.II MiRNA and respective predicted unigene target alignment, the MFE and respective unigene nucleotides start, stop and slice sites. Slice site always in the 10th position of the miRNA. ... 26
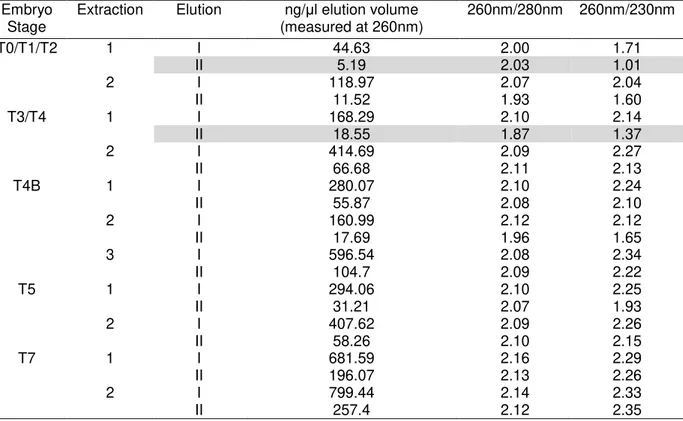
Table 3.III Quantification of total RNA samples extracted from P. pinaster embryos. Quantity and absorbance ratios measured by Nanodrop are shown. ... 27
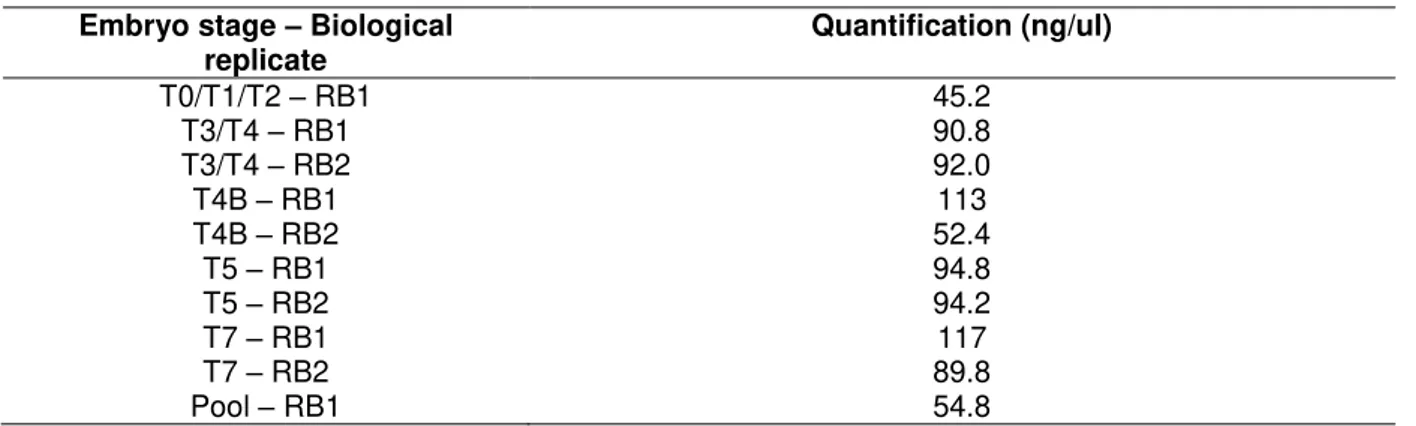
Table 3.IV Quantification of DNase-treated RNA samples with Qubit. ... 29
Table 3.V Primer efficiencies determined in the biological replicates and calculated according to the formula e=10(-1/slope). ATUB, EF1 and HISTO3 are the reference genes (RG*) and ARF, LEA, PPR, F-box PM and F-F-box P3 are the genes of interest (GOI). Standard error (se). ... 30
Table I.I List of small RNAs libraries and respective tissues of origin ...i
Table I.II List of degradome libraries and respective tissues of origin ...i
Table II.I Degradome vs transcriptome combinations used in bioinformatics analyses. ... ii
Table II.II Summary of RNA extraction reactions. ... ii
Table II.III Summary of cDNA synthesis reactions. Legend: RT+, reverse transcription reaction; RT-, reverse transcription minus control (reverse transcription reaction prepared with water instead of reverse transcriptase enzyme). ... ii
Table III.I Table of the linear regression constants, statistics of the linear regression r2 and SE(SLOPE), efficiency values and the standard error associated with its calculation, for the reference gene ATUB. ... iii
Table III.II Table of the linear regression constants, statistics of the linear regression r2 and SE(SLOPE), efficiency values and the standard error associated with its calculation, for the reference gene EF1. ... iv
XXII
Table III.IV Table of the linear regression constants, statistics of the linear regression r2 and
SE(SLOPE), efficiency values and the standard error associated with it calculation, for the ARF encoding transcript. ... vi
Table III.V Table of the linear regression constants, statistics of the linear regression r2 and SE(SLOPE), efficiency values and the standard error associated with it calculation, for the LEA encoding transcript. ... vii
Table III.VI Table of the linear regression constants, statistics of the linear regression r2 and
SE(SLOPE), efficiency values and the standard error associated with it calculation, for the PPR encoding transcript. ... viii
Table III.VII Table of the linear regression constants, statistics of the linear regression r2 and
SE(SLOPE), efficiency values and the standard error associated with it calculation, for the F-box PM encoding transcript. ... ix
Table III.VIII Table of the linear regression constants, statistics of the linear regression r2 and SE(SLOPE), efficiency values and the standard error associated with it calculation, for the F-box PM encoding transcript. ...x
Table IV.I RG cp average values and other statistic data from RT-qPCR analysis... xii
Table IV.II GOI cp average values and other statistic data from RT-qPCR analysis. ... xi
Table VI.I Read counts of the miRNAs studied in this work, obtained from sequencing libraries
prepared from the different ZE and MGM stages. The data are from the sequencing service performed
by LC Science. For all the samples two biological replicates (RB) were performed, except for “stage T0/T1/T2” that only had one sequenced sample since the biological material was limited. ... xiv
Table VI.II Read count of the selected cleaved target predicted by CleavelandLC for each degradome
library sequenced. ... xiv
Table VI.III Number of alternative miRNAs which have as target the same transcripts as the
XXIII
List of abbreviations and acronyms
3’-UTR, 3’ untranslated region;
5’-RLM-RACE, 5’-RNA-ligase-mediated rapid amplification of cDNA ends;
ARF, auxin regulator factor;
ATUB,-tubulin;
EF1, elongation factor 1;
EST, expressed sequence tag;
dsRNA, double stranded RNA;
Fwd, forward;
GOI, gene of interest;
HISTO 3, histone 3;
LEA, late embryo abundant;
MGM, megagametophyte
MRE, microRNA response element;
NGS, next-generation silencing;
NTC, non-template control;
PARE, parallel analysis of RNA ends;
Pol, polymerase;
PTGS, post-transcriptional gene silencing;
Rev, reverse;
RG, reference gene;
RT, reverse transcriptase;
RT-qPCR, real time quantitative PCR;
SE, somatic embryogenesis;
se, standard error;
TAE, tris-acetate-EDTA;
Ta, annealing temperature;
Ubiq, ubiquitin;
1
1. Introduction
1.1.
Pinus pinaster
- Distribution, ecologic and economic importance,
deforestation and possible solutions
Pinus is a genus of the Pinaceae family and includes several species, among which are Pinus pinaster Aiton, also known, among others, as Pinus maritima (or “Pinheiro-bravo” in Portugal). This conifer forest tree occurs in pure afforestations, or mixed with other forest tree species. It is distributed along the Mediterranean basin, more specifically in regions of the Iberian Peninsula, southwest and southern Europe, and the north of African coast (Jalas and Suominen 1972; Farjon 2013). The largest continuous plantation forest in Europe is in France where maritime pine is the main species. P. pinaster forests provide habitats for countless species and ecosystems. It has been also planted for soil conservation purposes, contributing to a good structure and fertile soil. It also represents an important source of raw materials for human use, such as wood, resin and paper pulp (Abad Viñas et al. 2016; Farjon 2010).
P. pinaster has preference for winter rainfall regime and mild temperatures but, due to its fast growth characteristics and tolerance to poor soils, it adapts to a range of diverse climates and habitats. During the 20th century, temperature in the Mediterranean basin increased by 1.5-4°C depending on the sub-region (Ferragina and Quagliarotti 2008) which consequently led to a reduction of precipitation in this area. These changes in climate are expected to continue leading to dryer soils and an increased risk of forest fires, contributing also to exposure to new pests and diseases as well as reproduction limitations. Overall, forests have been decreasing (The world Bank 2016). In Portugal, from 1965 to 2010 the area occupied by this species decreased approximately 263 thousand ha, occupying in 2010 approximately 23% of the Portuguese forest land (ICNF-IFN6 2013). The fast global climatic change scenario is threatening the biological diversity of the forest ecosystems and, as a consequence, the available genetic variability of Mediterranean forest species such as P. pinaster may also be compromised. The loss of such diversity may lead in the future to huge environmental, social and economic losses.
Human interventions, such as transfer of forest reproductive material, genetic improvement/breeding programs, and large-scale vegetative propagation tools such as somatic embryogenesis (SE) may integrate strategies for increasing productivity and should be promoted to improve the adaptation of P. pinaster to the predicted climate scenario of extreme temperatures and higher water stress (EUFORGEN 2007).
1.2.
Embryogenesis in Gymnosperms
2
gymnosperms like P. pinaster. As a monoic species, P. pinaster female cones are found in the upper branches of the tree, where they may be fertilized by pollen brought by the wind from the male cones, which are also present in the lower branches of the same tree. Unlike angiosperms, conifers have a single fertilization event (Cairney and Pullman 2007) where the male gametophyte (pollen grain, n) migrates through the egg cytoplasm (female gametophyte, n) and fuses with the egg nucleus, originating the zygote (2n) which will develop in embryo (Von Arnold 2008) (see figure 1). The megagametophyte developed upon fertilization is of mother origin (n) only and surrounds and nourishes the embryo while it grows. This conifer species takes two years from pollination to seed maturation (Cairney and Pullman 2007).
Figure 1.I Pine life cycle. Starting with the seed germination into a fertile adult tree, the
development of its sexual organs and production of gametes, pollination, and fertilization to produce a new seed. Image adapted from (Campbell and Reece 2008).
3
products and preparation for seed desiccation, dormancy and germination (Meinke 1995). The morphogenetic phase, can be divided into three phases, according to Singh 1978, proembryogeny phase, early embryogeny and late embryogeny (see figure 2) (Von Arnold 2008).
Figure 1.II Schematic overview of gymnosperm (Pinaceae) embryo development. Image
adapted from (Von Arnold 2008). Abbreviation: EP-embryo proper; pU-primary upper tier; pE-prymary embryonal tier; E-embryonal tier; S-suspensor tier; U-upper tier; EM-embryonal mass; sS-secondary suspensor.
The proembryogeny consists in the asymmetric division of the zygote. For Pinus spp., the fertilized nuclei divides to produce four free nuclei which later result in two initial cell tiers, the primary embryonal tier and the primary upper tier (See figure 2). These tiers divide again, and this phase ends with the elongation of the embryonal tier which will form the embryonal mass, and the remaining suspensor and upper tiers will give rise to the embryonal suspensor. During the early embryogeny, cells of the lower embryonal tier divide predominantly in a transverse plane and elongate, resulting in the embryonal mass and the thick secondary suspensor. The late embryogenesis is a period of histogenesis and organogenesis, were the root and shoot meristems are delineated and the plant apical-basal axis is established. The cotyledon primordia arise in a ring around the distal end of the embryo. At this stage provascular tissue and cortex also differentiate. By the end of the morphogenesis phase, the development program switches from pattern formation to the maturation phase, a period in which cell expansion and accumulation of storage reserves occur (Arnold 2008).
4
Figure 1.III
Pinus pinaster zygotic embryo developmental stages, from T0 to T7, according to the staging system of Gonçalves et al, 2005a. Bar: T0 and T1 = 300 µm; T2, T3 and T4 = 400 µm; T4B = 800 µm; T5, T6 and T5 = 0.1 cm (Gonçalves et al. 2005b).1.3.
Somatic embryogenesis
Fertile plants can develop from a single somatic cell and not just from a fertilized egg. Somatic embryogenesis (SE) is a fascinating nonsexual propagation process whereby somatic cells differentiate into somatic embryos (Von Arnold 2008).
Somatic embryos pass through a series of developmental stages which are similar to ZE and it has been observed in both angiosperms (Mordhorst et al. 1997) and gymnosperms (Cairney and Pullman 2007). For this reason SE has also been used as a model system to study plant embryogenesis (Von Arnold 2008; Trontin et al. 2016).SE offers a great potential to be applied in clonal selection, allowing the propagation of elite genotypes (Klimaszewska et al. 2016; Park et al. 2016). It offers the capability for large-scale vegetative propagation (Merkle 2016) particularly because of the possibility to scale up the propagation by using bioreactors (Von Arnold 2008). It is also an ideal system for genetic transformation, due to the initiation of SE from single cells (Montalbán et al. 2016; Winkelmann 2016). Somatic embryogenesis complemented by the application of other biotechnological tools offers new strategies for forest trees improvement favoring productivity, quality, and production systems of elite plants adapted to different environmental conditions, and more resistant or tolerant to abiotic and biotic stresses. (Merkle 2016; Montalbán et al. 2016). However, in vitro somatic embryogenesis is still subjected to several limitations. The application of SE to forestry plantation is currently restricted to a few conifer species due to deficiencies in the current protocols, which affect the induction, maturation, germination and plantlet conversion steps of SE (Park et al. 2016). Problems such as low or asynchronous embryo production, abnormal morphology, or poor root development have been reported (Montalbán et al. 2016).
5
Efficient development of somatic embryos requires a number of critical physical and chemical treatments with proper timing and is highly dependent of genetic features, unlike zygotic embryogenesis (Winkelmann 2016). Studies are therefore required to increase our understanding of the basic mechanisms governing the highly complex embryonic phase in conifers and the massive gene regulation (Von Arnold et al. 2016; Trontin et al. 2016). Epigenetic mechanisms, including DNA methylation, histone modifications and RNA interference, play a major role in gene regulation and have attracted a lot of attention in recent years.
SmallRNA pathways in particular, and especially miRNAs, have been highlighted as important regulators of developmental processes, among others, in several species including conifers (Mahdavi-Darvari et al. 2014; Miguel et al. 2016; de Vega-Bartol et al. 2013b)
By taking zygotic embryos as the reference, learning from and mimicking the situation in seeds, somatic embryogenesis can be improved and optimized in order to make use of the enormous potential this regeneration pathway offers for plant propagation and breeding (Winkelmann 2016).
1.4.
Small RNAs (in plants)
Small RNAs (sRNAs) expressed by eukaryotes are typically 20-30 nt non-coding RNA sequences that regulate several biological processes at the DNA or RNA level (Chen 2009).
There are a large diversity and complexity in small RNAs world. According to Axtell (2013) the small RNAs can be classified in two general groups according to their origin: hp-RNAs (hairpin small hp-RNAs), derived from intermolecular self-complementary RNA hairpin structures, and siRNAs, derived from dsRNA precursors. A secondary classification could be stablished based on other biogenesis characteristics or small RNA function. Thus, hp-RNAs could be divided in miRNAs, the aim of this study (the characteristics are described in the next sub-chapters), and other hp-RNAs non-miRNAs, a group barely annotated. SiRNAs, in its turn, are divided in three groups: heterochromatic siRNAs, responsible for repressive chromatin modifications but not found in conifers; secondary siRNAs, which its biogenesis is triggered by one of the above small RNAs; and NAT-siRNAs (natural antisense siRNAs) which instead of derive from an overlapping RNA locus, they arise from two independent but complementary transcribed RNAs. This hierarchical classification is not static since new miRNAs could be found or new functions could be revealed, or even other characteristics could be taken into account. SiRNAs could, for instance, be classified into tasiRNA (trans-acting siRNAs), casiRNA (cis-acting siRNAs), exo-siRNA (exogenous siRNAs) and endo-siRNA (endogenous siRNAs) (Ghildiyal and Zamore 2009).
1.4.1. The biogenesis of miRNAs in plants
non-protein-6
coding loci on the intergenic regions of the genome (Budak and Akpinar 2015; Jones-Rhoades et al. 2006). Besides these intergenic miRNA loci, intronic miRNAs are being increasingly reported, transcribed from the spliced out introns of the protein-coding genes (called mitrons) and, in spite of rare, exonic miRNAs, transcribed from the exons of protein-coding genes, have also been described in plants (Budak and Akpinar 2015).
The precursor sequences of miRNAs are largely determined by its genomic sequences (Meng et al. 2011). RNA polymerase II is responsible for transcribing the majority of miRNA genes. The recruitment of Pol II to MIR promoters involves the iteration of several transcriptional activators and various sequence motifs, similarly to the protein-coding genes (Meng et al. 2011; Rogers and Chen 2013) (see figure 1.IV). The transcript is stabilized by polyadenylation (addition of a 3' poly-A tail), and capping (addition of 5' 7-methylguanosine cap) and folds into a hairpin structure termed as miRNA primary transcript (pri-miRNA).
After transcription, pri-miRNAs are subjected to DCL-mediated two-step cleavage with help of other proteins and motifs (see figure 1 IV). This process occurs inside the nucleus, within specialized compartments called Dicing-bodies (D-bodies) (Meng et al. 2011). Dicer-like proteins (DCLs) have RNase III activity and initially cleave the pri-miRNAs near to the base of the stem, into a shorter stem-loop structure called precursor miRNA (pre-miRNA) (Rogers and Chen 2013). A second subsequent cleavage event
Figure 1.IV Summary of the major steps in miRNA
7
occurs in the pre-miRNA releasing the miRNA/miRNA* duplex (Budak and Akpinar 2015). Different DCL family members give rise to miRNAs with distinct sizes. DCL1 is responsible for the biogenesis of most plant miRNAs that mainly fall in the 18–21nt size range (Rogers amd Chen 2013).
Once the miRNA-duplex form is ready, the methyltransferase HEN1 (Hua Enhancer 1) adds a methyl group to the 2' OH of the 3' terminal nucleotide, thus protecting this termination against uridylation and consequent degradation by exonucleases (Meng et al. 2011). The export mechanism (from nuclei to cytoplasm) for plant miRNAs remains unknown (Budak and Akpinar 2015; Park et al. 2005).
Finally, to exert their regulatory roles, the mature miRNAs must be associated to a RNA-induced silencing complex (RISC). First, mature miRNA guide strand is separated from the passenger strand miRNA* and then, through binding to AGO proteins, it is loaded into a RISC complex (Rogers and Chen 2013).
The majority of miRNAs possess a 5'-Uridine which is usually sorted into AGO1, however, some miRNAs are bound by other AGOs. Ten different AGO proteins were already identified in Arabidopsis (Budak and Akpinar 2015; Meng et al. 2011). The fully assembled RISC then binds to its mRNA target trough sequence complementarity with its mature miRNA strand and directs mRNA silencing.
1.4.2. The miRNA-mediated silencing pathways
In plants, miRNAs were described to regulate their targets by post-trancriptional gene silencing (PTGS), either cleaving or inhibiting the translation of the target mRNA sequence (Sun 2012).
Regulation through miRNA-mediated target cleavage seems to provide a major contribution to silencing by miRNAs and it is a relatively well understood mechanism (Meng et al. 2011; Huntzinger and Izaurralde 2011). MicroRNAs can guide AGO components of RISC to the complementary mRNAs to direct target RNA cleavage. Commonly, cleavage of the target mRNA occurs in a single phosphodiester bond mostly between the 10th and 11th position of the miRNA (Huntzinger and Izaurralde 2011; Jones-Rhoades et al. 2006) (figure 1.V). Minor cleavages have also been reported between 9-10th and 11-12th positions (revied in Zheng et al. 2012). Extensive complementarity of the mRNA sequence to the loaded guide miRNA strand is frequently reported to be required for effective target recognition and consequent slicing in plants (Axtell 2013; Wang et al. 2015).
8
Figure 1.V The molecular mechanism behind the plant miRNAs’ endonucleolytic activity. Image adapted from (Iwakawa and Tomari 2015). MicroRNAs recognize fully or nearly complementary binding sites on their targets. Usually, upon miRNA nucleotides 9–12 being engaged in Watson–Crick base pairing with their targets, the AGO cleaves the mRNA in the base-paired region; tipically between miRNA nucleotides 10 and 11. The slicing activity of the AGO resides in its PIWI domain. The 3′-most nucleotide of plant miRNAs is modified with a 2′O-methyl group
that protects them from degradation. The miRNA 5′ terminal nucleotide is buried in the mid
domain of AGOs and is not available for pairing with the target. Legend adapted from (Huntzinger and Izaurralde 2011)
The translational repression mechanism mediated by miRNAs is yet poorly understood. (Iwakawa and Tomari 2015)
One miRNA can target multiple mRNAs, which usually are members of the same gene family (Jones-Rhoades et al. 2006; Iwakawa and Tomari 2015). Some targets of the same miRNA are up-regulated while others are down-regulated (Willmann et al. 2011). Additionally, a target mRNA could be simultaneously regulated by both slicing and translational repression, however the relationship between these two modes of miRNA action or the prevalence of one process over the other is still unknown (Rogers and Chen 2013).
9
Regulatory activities of the miRNAs are highly dynamic. They control a broad array of biological processes, including development, plant morphology, differentiation, proliferation and cell fate, and hormone signaling (Zhang, B. et al. 2005; Mallory and Vaucheret 2006; Sun 2012). They are also associated to a variety of environmental stress responses, including dehydration, mineral-nutrient stress, biotic stress (pathogens), mechanical stress or oxidative stress (Sunkar et al. 2012; Barciszewska-Pacak et al. 2015). Plant miRNAs also function in feedback regulation in small RNA pathway and in directing some siRNAs biogenesis (Chen 2009).
As regards to plant development, they have an essential role during all stages of the life cycle, operating from the first embryonic divisions up to the regulation of meiosis and gametogenesis, reproduction and genome reprogramming. Therefore the study of these regulatory RNAs may lead to a better understanding of plant embryogenesis eventually contributing to improvements in somatic embryogenesis.
1.4.3. miRNAs origin and conservation
It is known that some miRNAs are conserved among species. However, conclusions on evolutionary pathways should be drawn cautiously due to the fact that miRNAs are not extensively characterized in many plants and several reported novel miRNAs still require evidence verification. It is expected that some non-conserved miRNAs may be re-classified, as more miRNAs are being discovered. According to sequence similarity, structure configuration and shared function, miRNAs are organized in families.
Unlike animals where both mature miRNAs and their precursors are conserved, in plants only the mature sequence is conserved. Plant miRNA precursors also diverge more in structure and size. Their size may vary from 60 to 509 nucleotides, while in animals miRNA precursors are typically 70-80 nucleotides long (Zhang, B. et al. 2006a). These differences coupled with lack of sequence homology between miRNA of plants and animals, different biogenesis and mode of action suggests that miRNA families in plants and animals arose and evolved independently and convergently (Cuperus et al. 2011). However, recent findings about similarities in miRNA pathway between these two lineages and differences between evolutionary close species suggest a simpler hypothesis: the regulation by microRNAs have been inherited from a last common ancestor of plants and animals which already had a miRNA regulation system (Moran et al. 2017). None of the hypothesis could be ruled out and more studies are needed about this issue.
10
A large number of miRNAs are species-specific or belong to closely related species which suggests that some miRNAs have been recently created and other lost (Cuperus et al. 2011). The events underlying the creation of novel miRNAs are not well understood (Budak and Akpinar 2015; Cuperus et al. 2011). However, it have been suggested that they evolve and prevail by a neutral path. Different mutations could be responsible for transcript affinity for biogenesis machinery and, at the same time, target transcripts co-evolve, forming a functional pair. Rarely when incorporated in regulatory networks it prevail in the organism (Cuperus et al. 2011).
Conservation is an indicator of miRNA function. Conserved miRNAs play important roles in conserved gene regulation such as flower and leaf development, while non-conserved or lowly conserved miRNAs may play more specific roles in specific plant species such as cotton fiber differentiation (Zhang, B. et al. 2006a). Novel miRNAs have lower abundance and fewer targets identified compared with the conserved miRNAs, suggesting that the majority of them may have no function, whereas the abundantly expressed conserved miRNAs may be the main small RNA regulators of SE (Wu X.M. et al. 2015).
1.4.4.
miRNAs study in conifers
Large numbers of small RNAs have been identified by direct cloning and/or deep sequencing, with some targets being originally predicted via bioinformatics, based on either the perfect or nearly perfect sequence complementarity between a miRNA and the target mRNA, sequence conservation among different species in higher plants, or, more recently, using parallel analysis of RNA ends (PARE) (Yang et al. 2013). Currently, miRNAs have been reported for several species from the Pinaceae including Picea abies; P. glauca; P. sitchensis; P. engelmanni; Pinus abies; P. banksiana; P. contorta; P. densata; P. pinaster; and P. taeda, and deposited in mirBASE, mirNEST 2.0 and PMDR (Kozomara and Griffiths-Jones 2014;
Szcześniak and Makałowska 2014; Zhang Z. et al. 2010). For P. pinaster five miRNAs were present in mirNEST 2.0 database, until now based on EST sequences, the miRNA482, miRNA839f, miRNA1255f, miRNA1314, miRNA1863. However, none of them has been experimentally validated or analyzed regarding expression in specific tissues or developmental stages.
11
During the last years, and considering that, from the technical point of view, is easier to get enough amounts of embryo tissues for expression analysis from SE than from ZE, (Vashisht and Nodine 2014) several works were published on the miRNA presence, regulation and expression patterns, during somatic embryogenesis of different plant species such as maize (Dinkova and Alejandri-Ramirez 2014), cotton (Yang et al. 2013), rice (Chen C.-J. et al. 2011; Luo et al. 2006), Citrus (Wu X.M. et al. 2011; Wu X. Met al. 2015), Dimocarpus longan (Lin & Lai 2013), hydrid yellow poplar (Li T. et al. 2012), or the model organism Arabidopsis (Willmann et al. 2011). Regarding conifer species, studies in 8 stages of embryo development during somatic embryogenesis of Larix Kaempferi, demonstrated the presence of 28 miRNAs validated by RT-qPCR, and 9 target transcripts validated by 5’ RACE. Among the identified
miRNA target pairs were the miRNA156, miRNA159, miRNA160 (targeting two ARF genes probably of ARF 10, 16 or 17), miRNA162 (targeting DCL1), miRNA164 (targeting a NAC member) miRNA166 (targeting two HD-ZipIII genes), miRNA167, miRNA168, miRNA169 (targeting NFYA), miRNA171, miRNA390 (targeting TAS3), miRNA397 (targeting laccase), miRNA398 (targeting plastocyanin) (Zhang J. et al. 2012).
Only a miRNA study was performed in conifers ZE until now, more specifically, it were identified several miRNAs in early to late zygotic embryogenesis of Pinus taeda and validated by RT-qPCR, including the miRNA159, miRNA 166, miRNA 167, miRNA 171, miRNA 172 (Oh et al. 2008). More studies of miRNA gene expression regulation on conifers ZE are imperative.
Few regulatory proteins are unique to gymnosperms embryogenesis which can explain the differences between gymnosperm and angiosperm morphology and development (Cairney and Pullman 2007). Additionally, the expression pattern of miRNAs observed for example, upon callus induction, between embryogenic and non-embryogenic callus, as well as during somatic embryogenesis and differentiation is dependent on the plant species (Dinkova and Alejandri-Ramirez 2014). However, given that ZE transcript profiles are highly correlated between P. pinaster and A. thaliana (Trontin et al. 2016) and that many miRNAs are highly conserved, insights gained from studies using Arabidopsis will probably lay the groundwork to formulate hypotheses about their analogous functions in less experimentally amenable plant systems, like conifers. (Vashisht and Nodine 2014).
1.5.
Objectives
12
Previously, in the host lab, several small RNA and mRNA libraries prepared from seeds of P. pinaster have been generated and sequenced (see ANNEX I) leading to the identification of several microRNA families expressed during embryo development as part of the European project ProCoGen (Procogen 2013).
This master thesis aims at characterizing a set of miRNAs selected from previously identified miRNA list, focusing on the identification and validation of putative targets involved in the regulation of P. pinaster embryogenesis, and the interaction between the miRNA and the predicted target. Therefore, targets were first predicted using bioinformatics tools based on PARE technology and with resource to the miRNA and mRNA libraries, and P. pinaster transcriptome. This was followed by a RT-qPCR analysis of the predicted targets expression in embryo.
13
2. Materials and Methods
2.1. Material
2.1.1. Prediction of miRNA-target pairs involved in seed development
For the prediction of the miRNAs target the following preexisting resources were used in bioinformatics analyses:
2.1.1.1. Genomic resources
- P. pinaster miRNA sequencing data;
- P. pinaster transcriptome data (unigene library, Sustain Pine DB, version 3.0, publicly available at http://www.scbi.uma.es/sustainpinedb/assemblies/28?tab=inf);
- P. pinaster degradome data.
2.1.1.2. Software
- PAREsnip version 2.3. (is available at Java at http://srna-workbench.cmp.uea.ac.uk/ tools/ analysis- tools/paresnip/)
- Cleaveland version 4.3,
(the code is freely available at http://sites.psu.edu/axtell/software/cleaveland4/).
2.1.2. Validation of the expression of target pairs in seed development
For the validation of the expression of the miRNAs targets it were used the following resources:
2.1.2.1. Biological material
Biological samples corresponded to Pinus pinaster Aiton embryos at different developmental stages which had been previously isolated from immature female cones and sampled according to the stages defined by Gonçalves et al. (2005b), (see figure 1.III). The
female cones were collected in the Portuguese “Mata Nacional do Escaroupim” in “Salvaterra de Magos”.
2.1.2.2. Kits
- RNA extraction:
Plant/Fungi Total RNA Purification Kit, Norgen Biotek Corp, Canada.
- RNA purification:
TURBO DNA-free™ Kit, Catalog Number AM1907, Ambion®, Thermo Scientific™, Waltham, USA.
14
Transcriptor High Fidelity cDNA Synthesis Kit - Version 8.0, Roche, Switzerland. - Qubit RNA concentration measurement:
Qubit® RNA BR Assay Kit, Thermo Fisher Scientific, USA. - cDNA amplification:
- GoTaq® G2 Flexi DNA Polymerase kit, Promega, USA.
- LightCycler®480 SYBR Green I Master, version 13, Roche, Germany.
2.1.2.3. Oligonucleotides
Table 2.I List of primers used for RT-qPCR
Gene Name
SustainPineDB
or GenBank
accession
number
Sequence (5’ to 3’) Size
(pb)
Amplicon
size
1787PM Unigene 1787 (middle region)
FWD AAAGGGAATGGGTCAGTCC 19
130
REV GGGTTTCTTGACAGCGTC 18
12150P3’ Unigene 12150 (3’ region)
FWD GGAGAAGCCCAAAAGATTGA 20
217
REV TCCCAACAAGTGAACTACAA 20
806CP3’ Unigene 806 (3’ region)
FWD GACATACATCAGAACAACATCC 22
134
REV CACCTCAGACCTTTCAACC 19
5940CPM Unigene 5940 (middle region)
FWD TTTACCCAGTTTGAACAGAG 20
204
REV TCCACAACCACAACATCC 18
5940CP3’ Unigene 5940 (3’ region)
FWD GTGGTTGTGGAGAATAGG 18
132
REV CGAAATATGCCGAATCAC 18
UBIQa
(Ubiquitin) AF461687
FWR GATTTATTTCATTGGCAGGC 20
270
REV AGGATCATCAGGATTTGGGT 20
ATUBb
(-tubulin) Unigene 80862
FWD ATCTGGAGCCGACTGTCA 18
75
REV TGATAAGCTGTTCAGGATGGAA 22
EF1b (Elongation
factor-1)
Unigene 14762
FWR AATGTTGCTGTTAAGGAT 18
99
REV TATAATAACTTGAGCGGTAA 20
HISTO3b
(Histone 3) BX682612
FWD GCTGAGGCTTACCTTGTG 18
94
REV CCAGTTGTATATCCTTAGGCATAA 24
a- From Sónia Gonçalves 2005 (Gonçalves et al. 2005b) ; b- Reference genes for RT-PCR from (de Vega-Bartol et al. 2013a). PM represents primers designed for amplification of the middle
15
2.1.2.4. Chemicals and reagents
- Nuclease-Free Water; - Agarose;
- TAE buffer 1x;
- 25 mM dNTPs NZYMix (MB08601); - Loading Buffer:
- DNA Gel Loading Dye (6X), Thermo Scientific; - DNA size marker:
GeneRuler™ DNA Ladder Mix, Range 100–10,000 pb, 5 x 50 µg, Catalog #SM0331,
Thermo Scientific™, Waltham, USA.
GeneRuler™ 100bp DNA Ladder, Range 100-1,000 pb, # SM0241, Thermo
Scientific™, Waltham, USA.
- Nucleic acid staining solution for agarose gel:
RedSafe™ Nucleic Acid Staining Solution.
2.1.2.5. Other Lab material
- Mortar and Pestle;
-Lightcycler® 480 multiwell plate 96, white, Roche, USA.
2.1.2.6. Equipments
- AccuTherm Microtube Shaking Incubator, 120V, Labnet international, Inc., USA.
- C1000 Thermal Cycler with Dual 48/48 Fast Reaction Module, Gradient Enabled, Bio-Rad Laboratories, Inc, USA.
- Gel DocTM EZ Imager, with UV tray, Bio-Rad, EU. - NanoDrop Spectrophotometer ND-1000;
- Qubit® 3.0 Fluorometer, ThermoFisher Scientific, Malaysia.
- LightCycler®480 Instrument II, 96-well version, Roche, Switzerland.
2.1.2.7. Software
- Image LabTM Software 5.2.1, Bio-Rad.
16
2.2. Methods:
2.2.1. Prediction of miRNA-target pairs involved in seed development
2.2.1.1. In silico miRNA target prediction and miRNAs-target pairs selection for
further characterization
MiRNA targets prediction was performed using an in-house pipeline which includes two similar bioinformatics tools, but which use different prediction algorithms, namely Cleaveland (Addo-Quaye et al. 2009) and PAREsnip (Folkes et al. 2012) software. These software require three FASTA-formatted input datasets: degradome, smallRNA sequences list (miRNAs in this case), and transcriptome database. Transcriptome is available at SustainPineDB, the P. pinaster gene expression database containing ESTs clustered as unigenes (Canales et al. 2014). As result for each analyzed miRNA, these programs give the predicted targets, as unigene numbers. Some characteristics of the prediction performance or results accuracy are also made available.
A PAREsnip analysis was performed as the first filtering step for miRNAs and targets selection (see figure 2.II(a)). Each degradome library was compared to the transcriptome library (mRNA) representing the same embryo developmental stage (see ANNEX II, table II.II). The parameters used were sRNA minimum abundance of 5, category value until 2, sRNA length between 18-26bp, 4 maximum mismatches, and p-value cutoff of 0.05. The miRNAs with identified targets were subsequently used as input to Cleaveland v4.3 software
(“internalCleaveland01”), with p-value set for 1. The miRNAs and the respective identified targets resulting from “internalCleaveland01” analysis were compared with the results provided by LC Sciences (sequencing service provider company) using another analysis by Cleaveland,
“CleavelandLC” (using Cleaveland v 4.3), with a p-value equal to 1. These two Cleaveland analyses differ in the degradome input which was differently filtered.
The resulting identified miRNAs and respective targets which were not common between the two sets of results were not taken into account for further analyses. The same applies for results from female and male cones. The proteins putatively encoded by the identified target sequences were searched in the SustainPineDB and NCBI Genbank databases. The selection of miRNA/target pairs was essentially based on whether the protein was complete in the SustainPineDB, and also on the interest of the proteins in terms of development and embryogenesis.
17
Selected novel miRNAs miRNAs with identified targets miRNAs and respective targets miRNAs and respective targets selected miRNAs miRNAs with readnumber >= 1000 miRNAs expression file miRNAs degradome transcriptome Targets with higher category number PAREsnip Cleaveland (internalCle aveland01) Cleaveland (CleavelandLC) Cleaveland (internalCle aveland02) SustainPine DB and NCBI(a) (b)
SustainPineDB and NCBI
Figure 2.I Scheme of the target identification and selection of miRNAS and respective targets for further validation: (a) first analysis of the total miRNAs; (b) second analysis for novel microRNAs. Higher category number: For each miRNA target prediction, either PAREsnip or
Cleaveland, give a “category number” from 0 to 4. Categories from 0-2 are considered to be of higher category, and consequently less probable to be random degradation products. More information can be found in (Folkes et al. 2012).
2.2.2. Validation of the expression of miRNA-target pairs in seed development
2.2.2.1. RNA extraction, purification and sample preparation
Before RNA extraction the embryos, stored at -80ºC, were grinded in liquid nitrogen, using previously cooled mortar and pestle. Pools of 9 to 60 embryos were grinded at a time, depending on the developmental stage (see ANNEX II, table II.II). Initial developmental stages required higher number of embryos, given their smaller size. RNA was extracted using the Plant/Fungi Total RNA Purification Kit following manufacturer’s instructions. Several extraction reactions were performed for each developmental stage, from the five different stages of P. pinaster embryos.
18
Several RNA samples were combined to fulfill the minimum RNA quantity recommended for the DNase treatment. As a result two biological samples were obtained per developmental stage, with exception of T0/T1/T2 that only yielded one biological sample. Each RNA sample was visually checked for integrity after electrophoresis through 1% agarose gel stained with RedSafe.
Genomic DNA and other impurities were removed from the RNA samples by purification with TURBO DNA-free™ Kit, following the manufacturer’s instructions. One reaction of 50 l was performed for each embryo stage except for T0/T1/T2 where the total volume was 58 l. After treatment each RNA sample was visually checked for the absence of DNA through an electrophoresis with 1% agarose gel stained with RedSafe. RNA concentration was measured by Qubit® 3.0 Fluorometer, using a Qubit® RNA BR Assay Kit.
A pool sample was prepared by addition of 500ng of RNA of each biological replicate of each stage, and 1000 ng of T0/T1/T2 that only had one biological replicate.
2.2.2.2. cDNA synthesis
Each synthesis of cDNA was performed using 500 ng of RNA using the Transcriptor High Fidelity cDNA Synthesis Kit, according to manufacturer’s Standard Procedure for Quantitative RT-PCR. The summary of cDNA synthesis reactions could be found in ANNEX II, table II.III. Five hundred ng of RNA were used in each reaction. RT minus controls were included in the reactions for each stage. The quality of the cDNA synthesis was first verified with a PCR for amplification of the housekeeping Ubiquitin mRNA (results not showed). It was also performed an RT-qPCR for each cDNA synthesis in order to verify cDNA quality and purity, using GoTaq® G2 Flexi DNA Polymerase kit and primer for HISTO3 gene, indispensable since this technique has a higher sensitivity.
2.2.2.3. Amplification of miRNA targets in the different embryo stages
2.2.2.3.1. Primers design
Fourteen primer pairs were designed as shown in the figure below (figure 2.III) for amplification of potential miRNA targets selected, one pair comprising the cleavage position and another to amplify the downstream region of the target.
19
and for possible cross dimers between the two primers (forward and reverse) 3' end cross dimers with a ΔG of -5 kcal/mol and internal cross dimers with a ΔG of -6 kcal/mol were accepted.
Figure 2.II Exemplification of a potential target of miRNA (mRNA). In green it is represented
the miRNA:mRNA-target interaction region. For each mRNA target two pairs of primers were designed, a pair (in blue) to amplify the cleavage position region and another pair (in red) to
amplify the downstream region of the mRNA target. This strategy of primers’ design was
adapted from a technique developed by Oh et al.(2008) to monitor the miRNA-directed cleavage of mRNAs called regional amplification quantitative RT-PCR (RA-PCR).
Most of the primers were designed manually and the parameters confirmed with Oligoanalizer 3.1 (http://eu.idtdna.com/calc/analyzer accessed 16 December 2015). However, the primers for 3’ of unigene 11630, middle region of unigene 12150, and the 3’ and middle
region of the unigene 806 and unigene 8705, were designed by PerlPrimer Software v.1.1.21 (http://perlprimer.software.informer.com/1.1/ accessed 18 December 2015), due to the difficulty of finding adequate manually designed primers.
2.2.2.3.2. Optimization of primer amplification conditions
Table 2.II Optimized PCR reaction conditions common to all the selected primers.
Step Temperature
(ºC)
Duration
(s or min)
Initial denaturation 95 5’
Denaturation 95 45’’ x35
cycles
Annealing Ta 45’’
Extension 72 15’’
Final extension 72 5’
20
products were qualitatively evaluated by electrophoresis in agarose gel (1%). Only the primers which had one quality amplification product were selected for RT-qPCR optimization.
The conditions for the RT-qPCR were optimized in a gradient cycler testing annealing temperatures from 55-57ºC and different primer concentrations from 1 to 4nM. Only the primers which yielded a single amplification product were selected for expression analysis. The selected primer sequences and amplicon size are in table 2.1.
2.2.2.3.3. RT-qPCR
RT-qPCR was used to determine the expression of the selected targets in different embryos stages. The five validated primers for the genes of interest (GOI), 1787PM, 12150P3’,
806CP3’, 5940CPM, 5940CP3’, were used for amplification of cDNA from two embryo stages, namely the T4B and T7.
The RT-qPCR mix was prepared for a total volume of 20ul, with 10ul of all-in-one LightCycler SYBR Green I Master, 4μM of each primer (forward and reverse), 1ul of cDNA (dilution factor of 1:5), and H2O. The protocol was followed as suggested by the manufacturer, with annealing temperature of 55ºC during 20seg in a ramp rate of 2.2ºC/s. To product purity verification, and distinguishing nonspecific products or primer dimers a melting curve was performed immediately after amplification, using continuous acquisition (5 acquisitions per ºC). The PCR and melting curves were performed in the LightCycler®480 Instrument II, using 96- well plate. The Cts were determined by Second-derivation maximum method, an automatic tool
from the “LightCycler480 SW 1.5.1”.
For each reaction a non-template control (NTC) control was made replacing the cDNA with H2O. Additionally, for each cDNA an RT negative control was performed, with the cDNA RT minus sample. Three technical replicates and two biological cDNA replicates were performed for each stage. Each sample and the respective calibrator were amplified in the same plate assay and using the same master mix.
2.2.2.3.3. Calculations and Statistical data analysis
Gene expression quantification method:
For analysis of gene expression quantification by RT-qPCR the most commonly used method is relative quantification. The gene expression is measured relative to the levels of a normalizer sample (reference gene), and the results are expressed as a relative abundance of the transcript, or target gene/reference gene ratio. As reference genes, the Elongation factor-1, -tubulin and Histone 3 (see table 2.I) were chosen based on the work by Vega-Bartol et al. (2013a) that described their identification and adequacy for P. pinaster somatic embryogenesis.
21
𝑅𝐴𝑇𝐼𝑂 =
𝐸
𝐺𝑂𝐼∆𝐶𝑡𝐺𝑂𝐼(𝐶𝑎𝑙𝑖𝑏𝑟𝑎𝑡𝑜𝑟−𝑆𝑎𝑚𝑝𝑙𝑒)𝐸
𝑅𝐺∆𝐶𝑡𝑅𝐺(𝐶𝑎𝑙𝑖𝑏𝑟𝑎𝑡𝑜𝑟−𝑆𝑎𝑚𝑝𝑙𝑒)Equation 2.I Equation for expression ratio calculation (adapted from Pfaffl 2001). Legend: E
(efficiency); GOI (gene of interest); RG (reference gene); Ct (threshold cycle).
For this method it is necessary to determine the primer efficiency and measure the Ct of the amplification qPCR curves. As calibrator sample, a pool of the eight different samples of embryo stages was used.
For the calculations an excel page was used with the equations adapted from (Hellemans et al. 2007), using the calibration factor and conversion of RQs into NRQs.
Amplification efficiency determination:
For efficiency estimation, calibration curves were performed using the dilution method. A standard curve was created from a range of 5 serial dilutions for each gene in each cDNA sample, (Bustin et al. 2009), for each GOI (1:5, 1:10, 1:20, 1:50, 1:100), and for the reference genes (1:5, 1:10, 1:50, 1:100, 1:500). The Ct means were plotted against the logarithm cDNA dilution factor. The efficiency was calculated using the equation E=10(-1/SLOPE) (Pfaffl 2004), being the slope estimated through the excel function “PROJ.LIN”.
Statistical analyses:
The error was estimated using reported equations based on the first-order Taylor expansion (Hellemans et al. 2007) and propagated from the initial threshold cycles’ measured
mean to the expression ratio results. For efficiency obtained from a dilution calibration curve, the slope standard error (SE(SLOPE)) was predicted using the excel function PROJ.LIN.
For each amplified gene a significance test was performed between the expression values obtained for T4B and T7 stages. A normal distribution of results was assumed. A parametrical t-test student with Welch’s correction was performed using a free trial of GraphPad Prism 7 software (GraphPadSoftware, Inc., San Diego, CA, available in