Intratumoral Heterogeneity of MicroRNA
Expression in Rectal Cancer
Anne Haahr Mellergaard Eriksen1,2*, Rikke Fredslund Andersen1,2, Boye Schnack Nielsen3, Flemming Brandt Sørensen1,2, Ane Lindegaard Appelt1,4,
Anders Jakobsen1,2, Torben Frøstrup Hansen1,2
1Danish Colorectal Cancer Center South, Vejle Hospital, Vejle, Denmark,2Institute of Regional Health Research, University of Southern Denmark, Odense, Denmark,3Bioneer A/S, Hørsholm, Denmark, 4Department of Oncology, Rigshospitalet, University of Copenhagen, Copenhagen, Denmark
*anne.haahr.mellergaard@rsyd.dk
Abstract
Introduction
An increasing number of studies have investigated microRNAs (miRNAs) as potential mark-ers of diagnosis, treatment and prognosis. So far, agreement between studies has been minimal, which may in part be explained by intratumoral heterogeneity of miRNA expres-sion. The aim of the present study was to assess the heterogeneity of a panel of selected miRNAs in rectal cancer, using two different technical approaches.
Materials and Methods
The expression of the investigated miRNAs was analysed by real-time quantitative polymer-ase chain reaction (RT-qPCR) andin situhybridization (ISH) in tumour specimens from 27
patients with T3-4 rectal cancer. From each tumour, tissue from three different luminal loca-lisations was examined. Inter- and patient variability was assessed by calculating intra-class correlation coefficients (ICCs). Correlations between RT-qPCR and ISH were
evaluated using Spearman’s correlation.
Results
ICCsingle(one sample from each patient) was higher than 50% for miRNA-21 and miRNA-31.
For miRNA-125b, miRNA-145, and miRNA-630, ICCsinglewas lower than 50%. The ICCmean
(mean of three samples from each patient) was higher than 50% for miRNA-21(RT-qPCR and ISH), miRNA-125b (RT-qPCR and ISH), miRNA-145 (ISH), miRNA-630 (RT-qPCR), and miRNA-31 (RT-qPCR). For miRNA-145 (RT-qPCR) and miRNA-630 (ISH), ICCmeanwas
lower than 50%. Spearman correlation coefficients, comparing results obtained by RT-qPCR and ISH, respectively, ranged from 0.084 to 0.325 for the mean value from each patient, and from -0.085 to 0.515 in the section including the deepest part of the tumour.
Conclusion
Intratumoral heterogeneity may influence the measurement of miRNA expression and con-sequently the number of samples needed for representative estimates. Our findings with
a11111
OPEN ACCESS
Citation:Eriksen AHM, Andersen RF, Nielsen BS, Sørensen FB, Appelt AL, Jakobsen A, et al. (2016) Intratumoral Heterogeneity of MicroRNA Expression in Rectal Cancer. PLoS ONE 11(6): e0156919. doi:10.1371/journal.pone.0156919
Editor:Rajvir Dahiya, UCSF / VA Medical Center, UNITED STATES
Received:March 29, 2016
Accepted:May 20, 2016
Published:June 3, 2016
Copyright:© 2016 Eriksen et al. This is an open access article distributed under the terms of the Creative Commons Attribution License, which permits unrestricted use, distribution, and reproduction in any medium, provided the original author and source are credited.
Data Availability Statement:All relevant data are within the paper and its Supporting Information files.
Funding:The project expenses regarding research materials were covered by Vejle Hospital Research Council. The funder did not provide support in the form of salaries for authors. The Agency of Research and Innovation provided funding for BSN (Bioneer A/ S). The funding organizations did not play a role in the study design, data collection and analysis, decision to publish, or preparation of the manuscript.
two different methods suggest that one sample is sufficient for adequate assessment of miRNA-21 and miRNA-31, whereas more samples would improve the assessment of miRNA-125b, miRNA-145, and miRNA-630. Interestingly, we found a poor correlation between the expression estimates obtained by RT-qPCR and ISH, respectively.
Introduction
MicroRNAs (miRNAs) are short non-coding RNA molecules acting as negative gene regulators at the post-transcriptional level. It is well known that the same miRNA may affect several genes, but also that the same gene may be downregulated by different miRNAs. Thus, miRNAs represent a complex regulatory system of central biological importance. The system is dysregu-lated during malignant transformation, and it is generally anticipated that change of miRNA activity plays a central role in carcinogenesis [1–4]. Consequently, a considerable and increas-ing number of studies have investigated miRNAs as potential markers of diagnosis, treatment, and prognosis. The clinical implications, however, have so far been minimal [5]. One reason may be different methodological approaches, which hampers comparison of studies. Another issue is the different composition and quality of patient materials investigated. Moreover, the literature is dominated by many small studies without subsequent validation of relevant find-ings [5–10].
Another important obstacle is normalisation of real-time quantitative polymerase chain reaction (RT-qPCR) data, when measuring miRNA expression, as appropriate normalisation is important to ensure reliable and reproducible results. Despite an increasing number of miRNA expression studies, the literature is sparse when it comes to reliable normaliser candidates [11– 14].
Intratumoral heterogeneity is a general characteristic of malignant tumours [15–17] and represents a major obstacle in the study of tumour biology, miRNAs being no exception. To date, the issue has been almost neglected despite its obvious importance; the activities of miR-NAs are likely to vary in different parts of the tumour with potential major impact on the clini-cal application. Only few publications have addressed the problem of intratumoral
heterogeneity affecting the measurement of miRNA expression. One study is dealing with the issue in breast cancer [18], another one in hepatocellular carcinoma [19].
These challenges are especially relevant in patients with locally advanced rectal cancer, where treatment decisions are often based on single biopsies and the later interpretation of the tumour is influenced by the pre-operative radiotherapy [20,21].
The aim of the present study was to analyse the expression heterogeneity of a panel of selected miRNAs in rectal cancer specimens by two different technical approaches, and to elu-cidate their mutual concordance. RT-qPCR was chosen, since it is widely accepted as the gold standard for miRNA expression analyses.In situhybridization (ISH) was chosen because of its ability to visualise the cellular localisation of the investigated miRNAs in addition to the expression level.
Materials and Methods
Patients and tissue samples
Twenty-seven patients were randomly selected from a cohort of 239 patients who had under-gone resection for rectal cancer at Vejle Hospital, Denmark from 1999 to 2008. Inclusion was made only if the histopathological diagnosis was rectal adenocarcinoma pT3 or pT4, if no pre-operative chemo-radiotherapy was given, and if formalin-fixed paraffin-embedded (FFPE)
Technical University of Denmark. There are no patents, products in development or marketed products to declare. This does not alter the authors’
rectal cancer tissue was available from three different localisations of the tumour, including the luminal aspect.
According to The Regional Scientific Ethical Committees for Southern Denmark, ethics approval and written informed consent were not required, since the purpose of the study was to develop new methodology and no clinical data were further analysed (Act on Research Eth-ics Review of Health Research Projects, cf. § 14, section 1). The samples were collected during standard rectal resection, and the project was carried out without knowledge of the clinical data. The study was registered with The Danish Data Protection Agency, and The Danish Reg-istry of Human Tissue Utilisation was consulted before any tissue samples were used.
Available histological sections stained with hematoxylin and eosin (H&E) were examined by a pathologist in order to select three localisations from each tumour. The sections had to be cut from tissue blocks sampled from three different localisations, and all had to include the luminal aspects of the tumour mirroring the locations where diagnostic, endoscopic biopsies would have been taken. According to this selection, adjacent sections were cut from each of the FFPE tissue blocks for the heterogeneity analyses as follows: (a) one section to be stained with H&E for identification of Region of Interest (ROI), (b) four sections for ISH (5μm), (c) two
sections to be stained with hematoxylin for RT-qPCR (8μm), (d) one look-up section to be
stained with H&E. On a print of the H&E stained section, tumour and tumour microenviron-ment were identified by the pathologist and encircled as regions of interest (ROI). Subse-quently, the marking was transferred to the digital whole slide image of the ISH-slide, and to the H&E stained section and the hematoxylin stained section for RT-qPCR. For the RT-qPCR-analysis, the marked area was removed using a scalpel and collected in 1.5 ml RNase-free PCR tubes containing a drop of ethanol (99%) (S1andS2Figs).
Target miRNAs and normaliser miRNAs
Five target miRNAs were chosen based on the literature searches: miRNA-21 based on its well-known up-regulation in colorectal cancer (CRC) and suggested down-regulation after neo-adjuvant chemo-radiotherapy [6,9,22]; miRNA-31 based on the positive correlation between expression level and stage of CRC [4,23]; miRNA-125b, miRNA-145, and miRNA-630 based on their suggested up-regulation in rectal cancer tissue after neo-adjuvant chemo-radiotherapy [6–8].
Addressing the question of normalisation we recently performed a study on miRNA expres-sion profiling to identify and validate reference genes for relative quantification of miRNAs. MicroRNA-193a-5p, miRNA-27a, and let-7g were identified as the most stably expressed miR-NAs in our cohort of rectal cancer and were consequently used as normalisers in the present study [24].
Expression analysis by RT-qPCR
RNA extraction. RNA was isolated from the micro dissected FFPE tissue using the miR-Neasy FFPE Kit (Qiagen, Germany) according to the manufacturer’s instructions. First step was adding a lysis buffer containing proteinase K followed by a short incubation at 70°C. This was followed by DNase treatment and RBC buffer treatment. Ethanol was added and the sam-ple was applied to an RNeasy MinElute spin column, where the total RNA, including miRNA, was bound to the membrane. Finally, total RNA was eluted in 14μl RNase-free water.
001563 were used according to the manufacturer’s standard instructions for low sample input (LSI).
Custom MicroRNA RT Primer Pool and Custom MicroRNA PreAmp Primer Pool for ana-lysing the above mentioned miRNAs were created according to Protocol for Creating Custom RT and Preamplification Pools using TaqMan1MicroRNA Assays (Publication Part Number 4465407, Life Technologies).
RNA was reverse-transcribed using the Custom MicroRNA RT Primer Pool. Each RT reac-tion contained 3μl total RNA and 12μl RT reaction mix from TaqMan1MicroRNA Reverse
Transcription Kit.
Preamplification (12 cycles) was performed with the Custom MicroRNA PreAmp Primer Pool, each reaction containing 2.5μl RT Product, TaqMan1PreAmp Master Mix (2X) and
PreAmp Primer Pool in a total reaction volume of 25μl. The PreAmp Product was diluted 1:40
in TE buffer.
The RT-qPCR analyses were carried out on Applied Biosystems 7900 HT Real-Time System using 1μl diluted PreAmp product, TaqMan1MicroRNA Assays and TaqMan1Universal
Master Mix II NoAmpErase1UNG in a total reaction volume of 20μl. All reactions were
per-formed in triplicate. Data analysis was perper-formed using SDS software ver. 2.2.2 (Life Technologies).
Water was used as negative control. The no template control was included in the entire pro-cess (RT, preamplification and qPCR) and analysed together with samples.
Relative quantification. Average values of triplicate Cq values were used for further analy-sis. Cq is defined as the PCR cycle number at which the fluorescence meets the threshold in the amplification plot. The arithmetic mean of Cq values for miRNA-193a-5p, miRNA-27a, and let-7g was used for normalisation as mentioned above.
ΔCq values were converted to linear values for statistical analyses by the equation linear value (ΔCq) =2-ΔCqassuming that the amplification efficiency of the assays was close to 100%.
Expression analysis by in situ hybridization
Prior to the analysis, assay optimisation was accomplished to determine optimal probe concen-trations and hybridization temperatures. MicroRNA-31 was not detected in 10 samples ana-lysed during assay optimisation and was therefore not further explored. ISH for miRNA-21, miRNA-125b, miRNA-145, and miRNA-630 was performed as previously described [25] using the following concentrations: 20nM (miRNA-21 and miRNA-145), 30nM (miRNA-630), 50nM (miRNA-125b). The ISH analysis was performed using a Tecan Freedom Evo automated hybridization instrument (Tecan, Switzerland), in which the following steps were performed: pre-digestion with proteinase-K (15μg/ml) at 37°C for 8 minutes, pre-hybridization at 57°C
for 15 minutes, hybridization with double-carboxyfluorescein (FAM) labelled Locked Nucleic Acid (LNA) probes (Exiqon A/S, Denmark) for 1 hour. The miRNA-125b was processed at 56°C. After stringent washes with saline-sodium-citrate buffer the probes were detected with alkaline phosphatase-conjugated sheep anti-FAM Fab fragments, followed by incubation in 4-nitroblue tetrazolium and 5-bromo-4-chloro-3’-indolylphosphate (Roche, Denmark) for 60 minutes (90 minutes for miRNA-125b) resulting in a dark blue staining, and finally counter-staining with nuclear fast red (Vector Laboratories, CA, USA).
Image analysis and quantification
The areas of ROI encircled on the H&E stained sections were outlined on the ISH digital whole slide images, and staining artefacts as well as tissue artefacts were cleared. Some slides were in a poor condition caused by folded or lost tissue, which limited the size of the area included in the ROI. We found, not surprisingly, that images with a small ROI (less than 2 mm2) contributed with quite dramatic variation and they were therefore omitted from the sta-tistical analyses. For miRNA-21 five patients were excluded; for miRNA-125b and miRNA-630 three patients were excluded; and for miRNA-145 four patients were excluded.
A pixel classifier was trained to discriminate the blue ISH signal from the red counterstain, the unstained and weakly stained tissue, and the tissue-free areas. The following parameters were obtained during image processing from each ROI: area of intense blue (the ISH signal), area of weak blue (considered background ISH signal), area of purple blue (blue located over nuclear red), and the total area of the individual ROIs. The relative area fractions (areas of blue colour of interest divided by the total ROI area) were considered representative of the relative expression of the miRNA of interest.
Data analysis
All data were summarised using standard descriptive statistics. Inter- and intra-patient vari-ability was assessed by calculation of intraclass correlation coefficients (ICC), using a one-way random-effects model. Specifically, the ICC may in this setting be regarded as the percentage of the total variance in the samples accounted for by differences between the patients examined. If the majority of variation in the sample measurements is from inter-patient variation, the ICC is high (ICC!1). If the majority of variation is from intra-patient variation, the ICC is low (ICC!0). We considered ICC both for single samples (ICCsingle) and for the mean of samples within patients (ICCmean). The ICCsingleprovides an estimate of the reliability of a given sample as to rendering information about the specific patient (compared to all other patients). Corre-spondingly, the ICCmeanestimates the reliability of the information rendered by taking the mean of three samples from a patient.
The correlation between RT-qPCR and ISH-fractions for each miRNA was estimated for individual samples and for mean values for individual patients using the Spearman correlation coefficient.
In order to illustrate the inter- and intra-patient variation as well as the correlation between RT-qPCR and ISH values, all data were normalised to allow for plotting on a common scale. For each miRNA, the mean and the standard deviation for all RT-qPCR measurements of each patient were calculated, and any individual sample measurement was normalised to a standard scale by extracting the mean and dividing it by the standard deviation. This was also done for all ISH measurements, for each miRNA. The resulting values for both RT-qPCR and ISH were plotted separately for each miRNA.
Results
RT-qPCR
triplicate RT-qPCR measurements were removed from the dataset before further analyses. After normalisation, theΔCq values were converted to linear values for further analysis.
In situ hybridization
Relative expression estimates for the target miRNAs (miRNA-21, miRNA-125b, miRNA-145, and miRNA-630) were obtained by image analysis of the ISH-stained slides (Table 1).The miRNA-21 ISH resulted in a strong signal in the stromal tissue surrounding the epithelial tumour cells as also described previously [25,26]. A strong signal in enteric neurons in the stromal tissue and a weaker signal in other stromal cells were detected for miRNA-125b. The ISH for miRNA-145 resulted in a strong and a weak signal mainly in the smooth muscle cells and myofibroblastic cells surrounding the tumour cells [26,27]. The miRNA-630 ISH showed staining of tumour cells and a subset of the adjacent stromal cells. Both strong and weak ISH signals were considered in the image analysis. Examples of the ISH signals for miRNA-21, miRNA-125b, miRNA-145, and miRNA-630 with the corresponding classified images are shown inFig 1.
Intraclass correlation coefficient (ICC)
The ICC of each miRNA was calculated for both RT-qPCR and ISH as shown inTable 2. For miRNA-21, miRNA-145, and miRNA-630, the TBp-fraction (i.e. all blue colours) was used, but for miRNA-125b we did not include the areas with intense blue staining representing the enteric neurons.
Correlation between qPCR and ISH
The Spearman Correlation Coefficient was calculated to compare the results obtained by RT-qPCR and ISH, respectively (Table 3). For ISH, when comparing with the RT-qPCR, the TBp-fraction (all blue colours) was used for all four miRNAs, since RT-qPCR measures the total expression of the miRNA of interest, regardless of localisation. In general, there was a poor cor-relation between the estimates obtained by the two techniques with corcor-relation coefficients ranging from 0.084 to 0.325 for the mean value for each patient, and ranging from -0.085 to 0.515 in the section including the deepest part of each tumour.
Table 1. In situhybridization (ISH) for miRNA-21, miRNA-125b, miRNA-145, and miRNA-630: Classifiers, relative area fractions and localisation of ISH signal.
Classifier (ISH signal) Area fraction Localisation of ISH signal
miRNA-21 TBp* 0.0091–0.5751 Stromal cells
miRNA-125b TBp 0.0004–0.0848 Stromal cells
iB** 0.0000–0.0030 Enteric neurons in stroma
wpB*** 0.0004–0.0818 Other stromal cells
miRNA-145 TBp 0.0002–0.1141 Smooth muscle cells
miRNA-630 TBp 0.0012–0.1302 Tumour cells and stromal cells
Intense blue (iB) represents the strong ISH signal, weak blue (wB) the background ISH signal, and purple blue (pB) the blue located over nuclear red. *TBp (all blue colours) = iB + wB + pB
**For miRNA-125b, iB represents enteric neurons in the stromal tissue. They were present regardless of cancer and were excluded from the ICC analysis.
***wpB = TBp—iB; used for calculating the ICC for miRNA-125b.
The intra- and inter-patient variation and the correlation between RT-qPCR and ISH for miRNA-21, miRNA-125b, miRNA-145, and miRNA-630 are illustrated inFig 2. For miRNA-31 (RT-qPCR, only) seeS3 Fig.
Discussion
An increasing number of studies focus on miRNAs as potential biomarkers in cancer diagnosis and treatment, but the divergent and contradicting results in the literature are a major obstacle to clinical application [5,21]. The situation calls for a critical approach to methodological aspects among which heterogeneity ranks high.
Tissue heterogeneity is a general characteristic of malignant tumours. It is well known that the micro-environment varies throughout the tumour with effect on growth, proliferation, and metastatic potential. The behaviour of tumour mutations is inconsistent, too [16,17].
Fig 1.In situhybridization (ISH) visualizing the expression of miRNA-21, miRNA-125b, miRNA-145, and miRNA-630 in rectal cancer tissue.The ISH signal is corresponding to the blue colour in the left row. St: stroma; Ca: epithelial tumor cells.(A)Expression of miRNA-21 mainly present in the stroma adjacent to the epithelial tumour cells.(B)Pixel classifier corresponding to image A.(C)Expression of miRNA-125b with strong ISH-signal present in an enteric neuron (arrows) and weaker ISH signal representing different stromal cells.(D)Pixel classifier corresponding to image C.(E)Expression of miRNA-145 mainly present in smooth muscle cells (SMC) and myofibroblastic cells.(F)Pixel classifier corresponding to image E.(G)Expression of miRNA-630 scattered in epithelial tumour cells and adjacent stromal cells (arrows indicate examples of ISH-positive cells in the stroma).(H)Pixel classifier corresponding to image G.
Consequently, the issue holds crucial importance in biomarker research with perspectives of clinical application. This also applies to miRNAs. The present study addressed the heterogene-ity problem comparing two different methods of miRNA expression analysis.
The literature dealing with miRNA and intratumoral heterogeneity is sparse. Raychaudhuri
et al. (2012) investigated intratumoral heterogeneity of a panel of miRNAs in breast cancer [18] by RT-qPCR. They found a coefficient of variation (CV) of 40% within primary tumour samples and conclude that, intratumoral heterogeneity can lead to significant sampling bias and, assessment of miRNA profiles may require sampling at several different tumour locations. Peveling-Oberhaget al. (2014) [19] performed a miRNA profiling in hepatocellular carcinoma comparing different compartments of liver tumours and found that the miRNA dysregulation varies within tumour compartments. The two studies cannot without reservation be compared with our results, as none of them report the ICC. On the other hand, they both report signifi-cant intratumoral heterogeneity in accordance with the present study.
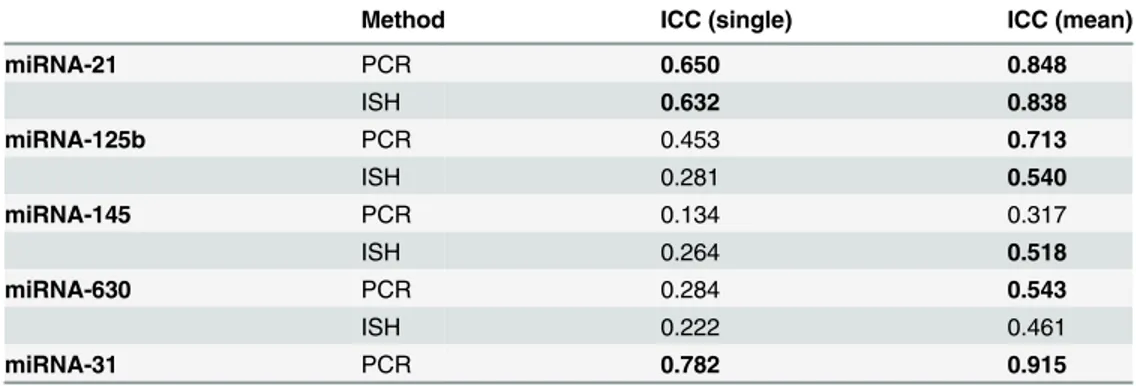
To the best of our knowledge, this is the first study to assess the intratumoral heterogeneity of miRNAs in rectal cancer. Moreover, we are not aware of any other studies applying the two techniques of RT-qPCR and ISH on adjacent sections of tissue to elucidate their mutual con-cordance. RT-qPCR was chosen, since it is widely accepted as the gold standard for miRNA expression analyses. ISH was chosen because of its ability to visualise the cellular localisation of the investigated miRNA in addition to the expression level. We used tumour specimens from Table 2. Intraclass Correlation Coefficient (ICC) for one sample from each tumour (ICCsingle) and for three different samples from each tumour (ICCmean) as obtained by RT-qPCR and ISH.
Method ICC (single) ICC (mean)
miRNA-21 PCR 0.650 0.848
ISH 0.632 0.838
miRNA-125b PCR 0.453 0.713
ISH 0.281 0.540
miRNA-145 PCR 0.134 0.317
ISH 0.264 0.518
miRNA-630 PCR 0.284 0.543
ISH 0.222 0.461
miRNA-31 PCR 0.782 0.915
The ICCsinglewas higher than 50% for miRNA-21 (RT-qPCR: 65%, ISH: 63%) and miRNA-31 (RT-qPCR: 78%), and for miRNA-125b, miRNA-145, and miRNA-630, it was lower than 50%.
As to ICCmeanit was higher than 50% for miRNA-21(RT-qPCR and ISH), miRNA-125b (RT-qPCR and ISH), miRNA-145 (ISH), miRNA-630 (RT-qPCR), and miRNA-31 (RT-qPCR) and lower than 50% for miRNA-145 (RT-qPCR) and miRNA-630 (ISH). As shown inTable 2, the ICCmeanis generally higher than the ICCsingle.
doi:10.1371/journal.pone.0156919.t002
Table 3. Spearman Correlation Coefficients comparing RT-qPCR and ISH for average measures for individual patients and for a single sample from each patient (the one of the three sections including the deepest part of the tumour).
Spearman Correlation (mean) Spearman Correlation (deepest section)
miRNA-21 0.158 0.294
miRNA-125b 0.084 -0.085
miRNA-145 0.273 0.312
miRNA-630 0.325 0.515
patients with rectal cancer to analyse the intratumoral heterogeneity of a panel of miRNAs with potential clinical relevance [4,6–9,22,23].
We found the overall extent of heterogeneity, as expressed by ICC, to be different for the five miRNAs. The CV is not as useful a parameter in this setting, as it does not provide a direct measure of the intra-patient variation relative to the overall variation in the measurements. The ICC, however, allows for comparison of the intra- and inter-patient variation in the data-sets from the two different methods, thus providing an estimate of the precision of the individ-ual measurements referring to a specific patient.
The inter-patient variation was higher than that of the intra-patient variation with respect to miRNA-21 and miRNA-31. This is an indication that the two miRNAs have potential as bio-markers, when analysing one sample (e.g. one diagnostic biopsy). Here we found that mean ICC values for RT-qPCR and ISH were almost identical for miRNA-21, 0.848 and 0.838, Fig 2. Inter- and intra-patient variation and correlation between RT-qPCR and ISH measurements for miRNA-21, miRNA-125b, miRNA-145, and miRNA-630.All data were normalised to be plotted on a common scale: see the main text for details. Each vertical line represents the range of the three measures obtained in the individual patient with different colours to represent RT-qPCR and ISH measurements, respectively. For each miRNA, patients were sorted according to their mean RT-qPCR measurement for plotting.
respectively. These values are in good concordance with Nielsenet al. (2011), who reported an ICC value for miRNA-21 ISH of 84% in CRC tissue [25].
On the other hand, for miRNA-125b, miRNA-145, and miRNA-630, the ICCsinglewas below 50%, requiring more cautiousness when interpreting results from a single sample. For miRNA-125b and miRNA-630 the ISH analysis showed lower ICC values (single and mean) than the RT-qPCR analysis, indicating a higher intra-patient variation for the ISH analysis. For miRNA-145 it was an opposite scenario with the ISH analysis showing higher ICC values (sin-gle and mean) than the RT-qPCR analysis, indicating a higher intra-patient variation for the RT-qPCR analysis. Therefore, relying only on the ICCs, none of the two techniques are supe-rior to the other.
Interestingly, we found a poor correlation between the results from RT-qPCR and ISH for all the miRNAs; so even though ICC (single and mean) is equal for RT-PCR and ISH for miRNA-21, the results are not comparable. The main explanation is likely to be inherent differ-ences in the methodology of RT-qPCR and ISH. E.g. different from the RT-qPCR technique, the ISH technique detects both precursor and mature miRNAs. However, it cannot be excluded that part of an explanation for the poor correlation could be small displacements of ROI when copying it from the primary plotting to the ISH digital whole slide image and to the slide for RT-qPCR. This would mean a difference in the analysed area, especially in the stroma, where all the miRNAs are represented.
In general, RT-qPCR has a high reproducibility and is a relatively low cost method applica-ble in most laboratories. FFPE tissue is well suited for miRNA expression analysis performed on a small amount of tissue with only the mature miRNAs being detected. However, RT-qPCR includes several preparatory steps (RNA extraction, reverse transcription, preamplification) in which technical variation can be introduced, and in addition proper normalisation is essential to ensure reproducible results.
The ISH technique presents several advantages, including the ability to visualise the cellular localisation of the investigated miRNAs in addition to the expression level. The quantitative ISH method requires standardised section thickness, because the quantitative estimates are not normalised against a reference standard. Other preparatory steps that may introduce some technical variation include proteolytic pre-treatment as well as tissue folds and detachment. In addition, ISH is a more laborious method not suitable for all laboratories, and data interpreta-tion requires specialised staff
In the present study it was possible to visualise the cellular localisation of the investigated miRNAs, and the corresponding ISH signal allowed for focus on the relevant cells in the ISH data analysis. For miRNA-125b we could leave out the strong ISH signal form the enteric neu-rons when calculating the ICC. For RT-qPCR, the same option is not available, and miRNA-125b from the enteric neurons is a part of the measured expression level. Since the enteric neu-rons are present regardless of cancer, leaving them out of the analysis would be the most accu-rate thing to do. In that case, RT-qPCR including miRNA-125b from the enteric neurons would give a biased estimate, and ISH would probably give a more correct result. This has to be balanced with the loss of cases in the ISH analyses due to folded or lost tissue. Thus, several cases were actually lost for all the analysed miRNAs, probably due to erroneous fixation of the tumours.
For all miRNAs ICCmeanwas higher than ICCsingle. A low ICC value could be explained as a high measurement noise, whereas a high ICC value indicates less measurement noise. The fact that ICCmeanwas higher than ICCsinglesuggests that pooling all three samples reduces the mea-surement noise, but only one available biopsy is often the scenario in clinical practice.
comprise the tumour heterogeneity. However, for clinical application of a method, practical factors such as number of biopsies needed for examination, accessibility and cost of the method, and interpretation of the results are indeed important factors
In conclusion, intratumoral heterogeneity should be considered in the analysis of miRNAs as biomarkers, and miRNA analysis should hence be performed on all available samples. One sample may be sufficient in some settings as indicated for miRNA-21 and miRNA-31 in the current study. The poor correlation between RT-qPCR and ISH suggests that results obtained by the two techniques should be compared with caution. In a clinical setting, RT-qPCR seems preferable as an easy method of getting reproducible results, however, it cannot be excluded that the ISH method may provide more clinically relevant expression estimates.
Supporting Information
S1 Fig. Rectal cancer specimen for miRNA expression analyses. (A)From the superficial / luminal part of the tumour, three different locations (red arrows) were chosen for examination. (B)The sections for RT-qPCR and ISH were cut at the same time as adjacent sections. The Region of Interest (ROI) was encircled on a print of the digital whole slide image of the HE-sec-tion. ROI was transferred to the digital whole slides of the ISH-images and to the sections cut for RT-qPCR.
(TIF)
S2 Fig. Region of Interest (ROI). (A)On a print of the H&E stained section, ROI was marked by the pathologist.(B)The marking was transferred to the sections stained with both hematox-ylin and eosin / stained with hematoxhematox-ylin only.
(TIF)
S3 Fig. Inter- and intra-patient variation for miRNA-31(RT-qPCR only).Data were nor-malised for plotting on a common scale. For any given measurement, the mean and the stan-dard deviation for that measurement for all samples were calculated, and any individual data point was normalised to a standard scale by extracting the mean and dividing it by the standard deviation. The resulting values for RT-qPCR were plotted for each patient.
(EPS)
S1 Table. Data from the RT-qPCR analysis. (XLSX)
S2 Table. Data from the ISH image analysis. (XLSX)
Acknowledgments
We thank Birgit Roed Sørensen, Trine Møller, Pia Nielsen, Tina Brandt Christensen and Lone Hartmann Hansen for technical assistance, and Karin Larsen for linguistic editing of the manuscript.
Author Contributions
References
1. Esquela-Kerscher A, Slack FJ. Oncomirs—microRNAs with a role in cancer. Nat Rev Cancer. 2006; 6 (4):259–69. PMID:16557279
2. Filipowicz W, Bhattacharyya SN, Sonenberg N. Mechanisms of post-transcriptional regulation by microRNAs: are the answers in sight? Nat Rev Genet. 2008; 9(2):102–14. doi:10.1038/nrg2290PMID: 18197166
3. Slaby O, Svoboda M, Michalek J, Vyzula R. MicroRNAs in colorectal cancer: translation of molecular biology into clinical application. Mol Cancer. 2009; 8:102. doi:10.1186/1476-4598-8-102PMID: 19912656
4. Laurila EM, Kallioniemi A. The diverse role of miR-31 in regulating cancer associated phenotypes. Genes Chromosomes Cancer. 2013.
5. Agostini M, Pucciarelli S, Calore F, Bedin C, Enzo M, Nitti D. miRNAs in colon and rectal cancer: A con-sensus for their true clinical value. Clin Chim Acta. 2010; 411(17–18):1181–6. doi:10.1016/j.cca.2010. 05.002PMID:20452339
6. Drebber U, Lay M, Wedemeyer I, Vallbohmer D, Bollschweiler E, Brabender J, et al. Altered levels of the onco-microRNA 21 and the tumor-supressor microRNAs 143 and 145 in advanced rectal cancer indicate successful neoadjuvant chemoradiotherapy. Int J Oncol. 2011; 39(2):409–15. doi:10.3892/ijo. 2011.1036PMID:21567082
7. Svoboda M, Izakovicova Holla L, Sefr R, Vrtkova I, Kocakova I, Tichy B, et al. Micro-RNAs miR125b and miR137 are frequently upregulated in response to capecitabine chemoradiotherapy of rectal can-cer. Int J Oncol. 2008; 33(3):541–7. PMID:18695884
8. Della Vittoria Scarpati G, Falcetta F, Carlomagno C, Ubezio P, Marchini S, De Stefano A, et al. A spe-cific miRNA signature correlates with complete pathological response to neoadjuvant chemoradiother-apy in locally advanced rectal cancer. International journal of radiation oncology, biology, physics. 2012; 83(4):1113–9.
9. Slaby O, Svoboda M, Fabian P, Smerdova T, Knoflickova D, Bednarikova M, et al. Altered expression of miR-21, miR-31, miR-143 and miR-145 is related to clinicopathologic features of colorectal cancer. Oncology. 2007; 72(5–6):397–402. doi:10.1159/000113489PMID:18196926
10. Kheirelseid EA, Miller N, Chang KH, Curran C, Hennessey E, Sheehan M, et al. miRNA expressions in rectal cancer as predictors of response to neoadjuvant chemoradiation therapy. Int J Colorectal Dis. 2013; 28(2):247–60. doi:10.1007/s00384-012-1549-9PMID:22903298
11. Davoren PA, McNeill RE, Lowery AJ, Kerin MJ, Miller N. Identification of suitable endogenous control genes for microRNA gene expression analysis in human breast cancer. BMC Mol Biol. 2008; 9:76. doi: 10.1186/1471-2199-9-76PMID:18718003
12. Chang KH, Mestdagh P, Vandesompele J, Kerin MJ, Miller N. MicroRNA expression profiling to identify and validate reference genes for relative quantification in colorectal cancer. BMC Cancer. 2010; 10:173. doi:10.1186/1471-2407-10-173PMID:20429937
13. Peltier HJ, Latham GJ. Normalization of microRNA expression levels in quantitative RT-PCR assays: identification of suitable reference RNA targets in normal and cancerous human solid tissues. Rna. 2008; 14(5):844–52. doi:10.1261/rna.939908PMID:18375788
14. Wotschofsky Z, Meyer HA, Jung M, Fendler A, Wagner I, Stephan C, et al. Reference genes for the rel-ative quantification of microRNAs in renal cell carcinomas and their metastases. Anal Biochem. 2011; 417(2):233–41. doi:10.1016/j.ab.2011.06.009PMID:21741950
15. Heppner GH. Tumor heterogeneity. Cancer Res. 1984; 44(6):2259–65. PMID:6372991
16. Hanahan D, Weinberg RA. Hallmarks of cancer: the next generation. Cell. 2011; 144(5):646–74. doi: 10.1016/j.cell.2011.02.013PMID:21376230
17. Hanahan D, Weinberg RA. The Hallmarks of Cancer. Cell. 2000; 100(1):57–70. PMID:10647931 18. Raychaudhuri M, Schuster T, Buchner T, Malinowsky K, Bronger H, Schwarz-Boeger U, et al.
Intratu-moral heterogeneity of microRNA expression in breast cancer. The Journal of molecular diagnostics: JMD. 2012; 14(4):376–84. doi:10.1016/j.jmoldx.2012.01.016PMID:22704963
19. Peveling-Oberhag J, Seiz A, Doring C, Hartmann S, Koberle V, Liese J, et al. MicroRNA Profiling of Laser-Microdissected Hepatocellular Carcinoma Reveals an Oncogenic Phenotype of the Tumor Cap-sule. Transl Oncol. 2014; 7(6):672–80. doi:10.1016/j.tranon.2014.09.003PMID:25500075
21. Lim SH, Chua W, Henderson C, Ng W, Shin JS, Chantrill L, et al. Predictive and prognostic biomarkers for neoadjuvant chemoradiotherapy in locally advanced rectal cancer. Crit Rev Oncol Hematol. 2015; 96(1):67–80. doi:10.1016/j.critrevonc.2015.05.003PMID:26032919
22. Li T, Leong MH, Harms B, Kennedy G, Chen L. MicroRNA-21 as a potential colon and rectal cancer bio-marker. World J Gastroenterol. 2013; 19(34):5615–21. doi:10.3748/wjg.v19.i34.5615PMID:24039353 23. Wang CJ, Zhou ZG, Wang L, Yang L, Zhou B, Gu J, et al. Clinicopathological significance of
micro-RNA-31, -143 and -145 expression in colorectal cancer. Dis Markers. 2009; 26(1):27–34. doi:10.3233/ DMA-2009-0601PMID:19242066
24. Eriksen AHM, Andersen RF, Pallisgaard N, Sørensen FB, Jakobsen A, Hansen TF. MicroRNA Expres-sion Profiling to Identify and Validate Reference Genes for the Relative Quantification of microRNA in Rectal Cancer. PloS one. 2016; 11(3):e0150593. doi:10.1371/journal.pone.0150593PMID:26937645 25. Nielsen BS, Jorgensen S, Fog JU, Sokilde R, Christensen IJ, Hansen U, et al. High levels of
micro-RNA-21 in the stroma of colorectal cancers predict short disease-free survival in stage II colon cancer patients. Clin Exp Metastasis. 2011; 28(1):27–38. doi:10.1007/s10585-010-9355-7PMID:21069438 26. Knudsen KN, Nielsen BS, Lindebjerg J, Hansen TF, Holst R, Sorensen FB. microRNA-17 Is the Most Up-Regulated Member of the miR-17-92 Cluster during Early Colon Cancer Evolution. PloS one. 2015; 10(10):e0140503. doi:10.1371/journal.pone.0140503PMID:26465597