doi:10.1093/eurpub/cky019
. . . .
Changes in access to primary care in Europe and its
patterning, 2007–12: a repeated cross-sectional study
Kla´ra Dimitrovova´1, Julian Perelman1,2
1 Escola Nacional de Sau´de Pu´blica, Universidade NOVA de Lisboa, Lisbon, Portugal
2 Centro de Investigac¸a˜o em Sau´de Pu´blica, Escola Nacional de Sau´de Pu´blica, Universidade NOVA de Lisboa, Lisbon, Portugal
Correspondence:Kla´ra Dimitrovova´, Escola Nacional de Sau´de Pu´blica, Universidade NOVA de Lisboa, Avenida Padre Cruz, 1600-560 Lisbon, Portugal, Tel: +351 (0) 21 75 12177, fax: +351 217 582 754, e-mail: [email protected] or [email protected]
Background:The strengthening of primary care (PC) has been encouraged as a strategy to achieve more efficient and equitable health systems. However, the Great Recession may have reduced access to PC. This paper analyses the change in access to PC and its patterning in 28 European countries between 2007 and 2012.Methods:We used data from the 2007 and 2012 waves of the EU-SILC questionnaire (n= 687 170). The dependent variable was the self-reported access to PC (‘easy’ vs. ‘difficult’). We modelled the access to PC as a function of the year and individual socioeconomic and country-level health system variables, using a mixed effects logistic regression, adjusting for sex, age, civil status, country of birth, chronic condition and self-reported health. Additionally, we interacted the year with socioeconomic and country-level variables.Results:The probability of reporting difficult access to PC services was 4% lower in 2012, in comparison with 2007 (OR = 0.96,P< 0.01). People with the lowest educational level (OR = 1.63,P< 0.01), high difficulty to make ends meet (OR = 1.94,P< 0.01) and with material deprivation (OR = 1.25,P< 0.01) experienced a significantly higher likelihood of difficult access. The better access in 2012 was significantly higher in people living in countries with higher health expenditures, a greater number of generalist medical practitioners, and with stronger gatekeeping.Conclusion:Access to PC improved between 2007 and 2012, and this improvement was greater for people living in countries with a higher investment in health and PC. However, the poor access amongst low-SE status people was stable over the period.
. . . .
Introduction
A
n adequate access to primary care (PC) is essential to ensure disease prevention, early diagnosis and adequate referral to secondary care.1 The strengthening of PC has therefore been encouraged internationally as a strategy to achieve more efficient health systems through infrastructure, qualified PC professionals and supportive PC policies.2Access to PC can be influenced by health systems and individual features. On the system side, the main determinants are (i) avail-ability, such as the sufficient supply of general practitioners (GPs) and equipment; (ii) geographical accessibility; (iii) organizational features, such as the existence of an appointment system, after-hours care arrangements and home visits; and (iv) affordability. On the individual side, we may mention (i) health needs and patient behaviour, i.e. the propensity to visit (or not) a GP according to self-perceived needs; and (ii) socioeconomic (SE) status, i.e. low-educated people may lack awareness and knowledge of the health system and may delay search for needed healthcare due to financial constraints on transportation costs or co-payments.3
During an economic recession, access to PC may be affected through disinvestment in healthcare, which may influence the availability, af-fordability and other organizational features of PC, and due to variations in people’s SE status and health needs. During the Great Recession, which has affected most of the European countries since 2008, some countries were better prepared than others as a result of some pre-existing fiscal measures (e.g. Czech Republic, Italy, Lithuania and Slovakia), but other countries, such as Greece, Spain and Portugal, had to adopt strict fiscal austerity, with large budget cuts and public sector reforms that may have restricted access to healthcare.4Studies
performed in Portugal,5Greece6 and in the Baltic states7 reported a significant increase in ‘unmet medical need’ during this period. The odds of reporting having an unmet medical need more than doubled in Portugal, the odds of facing unmet medical need were higher for
unemployed and uninsured patients in Greece, and the main reason for this increase in Latvia and Estonia was the inability to afford care and long waiting lists, respectively.
Nevertheless, to the best of our knowledge, no study has assessed the self-reported access to PC during this period, even though it is the main avenue to healthcare for most European citizens. Using a large database from 28 European countries, we analysed the change in self-reported access to PC before and during the Great Recession; we examined if some countries’ health system characteristics influenced access to PC during this period; and we examined if low-SE status people have been more affected than others during this period.
Methods
Data sources
We used individual and household data from the 2007 and 2012 cross-sectional waves of the European Statistics on Income and Living Conditions (EU-SILC) of 28 European countries. EU-SILC is a harmonized representative population survey on income distri-bution and social inclusion in Europe. The non-response rates varied from 8% (Cyprus) to 42% (Denmark) and from 5% (Romania) to 58% (Denmark) in 2007 and 2012, respectively.8 Our final sample comprised 687 170 individuals aged 25–81 years old. We excluded individuals younger than 25 years old (n= 119 408) because we used education as an important covariate of the SE status, and people younger than 25 are less likely to have concluded their education. Country level data were obtained from OECD,9–11WHO,12Eurostat13and World Bank sources.14
Dependent variable
We used the question on access to PC services to evaluate the self-perceived access to PC. Here, ‘PC services’ refers to ‘a GP, a primary
health centre, or to a casualty department or similar, where first-aid treatment could be received’, and access is defined in terms of the financial, physical, technical and health conditions of the household (e.g. distance, opening hours, infrastructure and equipment for people with physical disability), but not in terms of quality.15 Note that the access is evaluated for the household as a whole, which means, for example, that ‘if one member of the household has a disability, but if another member can access easily to the service for him, without representing any burden for the household, then the service would be considered as easily accessible by the entire household’. (p. 3)15 Therefore, all individuals within the
household are classified as having the same difficulty to access to PC. First, the question ‘From the place where you live, does the household use the services of primary health care facilities?’ is rated as ‘used’ and ‘not used’, and only if answered ‘used’, is there the subsequent question, ‘How do you rate this access?’, which is assessed on a Likert scale: (i) ‘with great difficulty’, (ii) ‘with some difficulty’, (iii) ‘easily’ or (iv) ‘very easily’.15We created a binary variable for ‘difficult access to PC’ by combining the first and second options, and the third and fourth, since only 4.11% of our sample experienced ‘great difficulty’ of accessing PC. We excluded observa-tions with missing data on the use of PC (n= 1999; 0.3% of the sample), and individuals who did not rate the difficulty in access because they did not use PC services (n= 11 502; 1.6% of the sample).
Explanatory variables
A recession is said to occur when real GDP falls for two consecutive calendar quarters.16 We measured the change across time using a year binary variable, with the 2007 wave representing access to PC before the Great Recession, when none of the 28 countries had a negative percentage change in GDP based on the previous year; and the 2012 wave representing the access to PC during/post-Great Recession, when 13 of the 28 countries still had a negative percentage change in GDP in the previous year, and others were in a recent post-recession period.17
We used individual SE characteristics to measure differences in access between the low-SE vs. high-SE status people. We used the education level, the ability to make ends meet and material depriv-ation. Note that the last two variables are collected at the household level; therefore, all individuals within the household have the same values. We divided the education categories into three levels, and the ability to make ends meet into four categories. We created a dummy variable of material deprivation based on the Eurostat definition as the enforced inability (rather than the choice not to do so) to afford at least three of nine specific items considered by most people to be desirable or even necessary to lead an adequate life.18
We also used as explanatory variables specific health system char-acteristics that may influence the propensity to visit a GP, such as: the supply of PC services measured by the rate of generalist medical
Table 1 Individual/household’s and country level characteristics in 2007 and 2012 of primary care users
2007 2012
(n= 339 453) (n= 347 717)
Individual characteristics n % n %
Difficult access to PC 73 903 22 72 280 21
Age [mean (SD)] 52 (16) 53 (16)
Male 157 713 46 160 326 46
Married 218 141 64 214 014 62
Country of birth (same as residence) 313 449 92 317 591 92
Country of birth (any other EU country) 8 762 3 11 637 3
Country of birth (any other country) 17 242 5 18 489 5
Educationa
Tertiary education 85 858 25 97 212 28
Secondary education 193 440 57 198 276 57
No education/primary education 60 155 17 52 229 15
Deprivation 68 314 20 76 583 22
Ability to make ends meet
Easily or very easily 64 269 19 59 076 17
Fairly easily 84 974 25 78 082 22
With some difficulty 103 438 30 103 461 30
With difficulty or great difficulty 86 772 26 107 098 31
Self-reported health
Very good 59 711 18 61 129 18
Good 141 483 42 151 323 44
Fair 91 954 27 90 559 26
Bad or very bad 46 305 14 44 706 13
Chronic condition 113 635 33 122 999 35
Country level characteristics Gatekeepingb
No gatekeeping 83 189 25 81 885 24
Moderate gatekeeping 106 903 31 111 037 32
Fully enforced gatekeeping 149 361 44 154 795 44
Total health expenditure per capita [mean (SD)] 2650 (1210) 2840 (1310)
Rate of GMP per 1000 inhabitants [mean (SD)] 0.94 (0.54) 0.95 (0.50)
Note: Sample: individuals aged 25 and over. Source: EU-SILC 2007 and 2012.
a: The levels of education were constructed based on the aggregation of ISCED (International Standard Classification of Education) levels: 0–1, 2–3 and 4–5 for ‘no education/primary education’, ‘secondary education’ and ‘tertiary education’, respectively.
b: No gatekeeping: AT (Austria) CY (Cyprus) CZ (Czech Republic) DE (Germany) GR (Greece) IS (Iceland) LU (Luxembourg) SE (Sweden); Moderate gatekeeping: BE (Belgium) BG (Bulgaria) EE (Estonia) FI (Finland) FR (France) IE (Ireland) LV (Latvia) PL (Poland) SK (Slovak Republic); Fully enforced gatekeeping: DK (Denmark) ES (Spain) HU (Hungary) IT (Italy) LT (Lithuania) NL (Netherlands) NO (Norway) PT (Portugal) RO (Romania) SI (Slovenia) UK (United Kingdom).
practitioners (GMP) per 1000 inhabitants,13the total health expend-iture per capita (US Dollar, 2010 constant prices, constant PPPs, OECD base year),9,14and the existence of a gatekeeping system to specialist services (2, ‘fully enforced gatekeeping system’; 1, ‘moderate gatekeeping’; and 0, ‘no gatekeeping’).10–12
Covariates
We controlled for individual variables, namely age, sex, civil status, country of birth, self-reported health and the existence of a chronic condition, as proxies for needs.19Observations with missing data on
any of the explanatory variables or covariates were excluded (n= 25 007; 3.5% of the sample).
Statistical analysis
We modelled the self-reported access to PC as a function of the year, and individual SE and country-level variables, using multilevel mixed-effects logistic regression, with two level predictors. The use of a multilevel mixed-effects model (i.e. containing both fixed effects and random effects) is justified by individuals being nested in different countries.20In our data, level 1 corresponds to the fixed equation of the model at the individual-level in which the odds ratios are analogous to those in a standard regression and are estimated directly. Level 2 corresponds to the random equation of the model at the country-level, which is intended for modelling the intra-country correlation, since the observations in the same country are correlated because they share common cluster-level random effects. These random effects take the form of random intercepts
or random coefficients, and are summarized according to their estimated variances and covariances.20 This was the base model
(Regression I). Additionally, we performed two separate regressions with interactions. Regression II contains interaction terms between year and level 1 variables (SE variables of the individual), with the assumption that the Great Recession might have affected access to PC differently in low-SE and high-SE status people. Regression III contains interaction terms between year and level 2 variables, with the assumption that the Great Recession might have influenced access to PC differently in countries with different rates of GMP per 1000 inhabitants, with different total health expenditures per capita, and with different gatekeeping systems.
The likelihood-ratio test comparing the model to ordinary logistic regression without the conditional set of random effects was highly significant (P< 0.00) for all our models, precluding the use of a simple logistic regression model.20Furthermore, a similar method-ology has been used by other researchers, using 2009 EU-SILC data, to study unmet needs.21All the analyses were conducted with Stata
version 13.
Results
Descriptive analysis
Descriptive statistics are presented intable 1. In 2007 and 2012, 22% and 21% of individuals reported having difficult access to PC services, respectively. People with no education/primary education fell from 17% to 15% between 2007 and 2012, and the percentage of
Figure 1 Difference in reporting difficult access to primary care between 2007 and 2012, by country. Note: Switzerland, Croatia and Malta are not included due to missing data in 2007.
Source: EU-SILC 2007 and 2012; authors’ computations
people with difficulties/great difficulties to make ends meet rose from 26% to 31%. The mean total health expenditure per capita and the rate of GMP per 1000 inhabitants was 2650$ and 0.94, and 2840$ and 0.95 in 2007 and 2012, respectively, and 44% of the in-dividuals lived in a country with fully enforced gatekeeping systems. Between 2007 and 2012, 17 countries experienced a decrease in the difficulty of accessing PC, with the highest decrease observed in Lithuania (-10.9 pp) and the lowest decrease observed in Italy (-0.1 pp). Eleven countries experienced an increase in the difficulty of accessing PC, with the lowest increase reported in France (0.1 pp) and the highest increase reported in Romania (9.0 pp;figure 1).
Multivariate analysis
The probability of reporting difficult access to PC services was 4% lower in 2012 in comparison with 2007 (OR = 0.96,P< 0.01; Regression I,
table 2). People with the lowest educational level (OR = 1.63,P< 0.01), with the highest difficulty to make ends meet (OR = 1.94,P< 0.01), and with material deprivation (OR = 1.25,P< 0.01) experienced a signifi-cantly higher likelihood of difficult access to PC services. Also, people with the poorest self-reported health and people with a chronic condition experienced a significantly higher difficulty in accessing PC (OR = 1.71,P< 0.01 and OR = 1.03,P< 0.01, respectively).
People living in countries with higher total health expenditures per capita and with a higher rate of GMP per 1000 inhabitants experienced a lower difficulty of accessing PC. Specifically, a 1000 US$ higher health expenditure per capita was associated with a 4% improvement in access to PC (OR = 0.96,P< 0.1), and a one-point higher rate of GMP per 1000 inhabitants was associated with a 34% significantly lower probability of difficult access to PC (OR = 0.66,
P< 0.01).
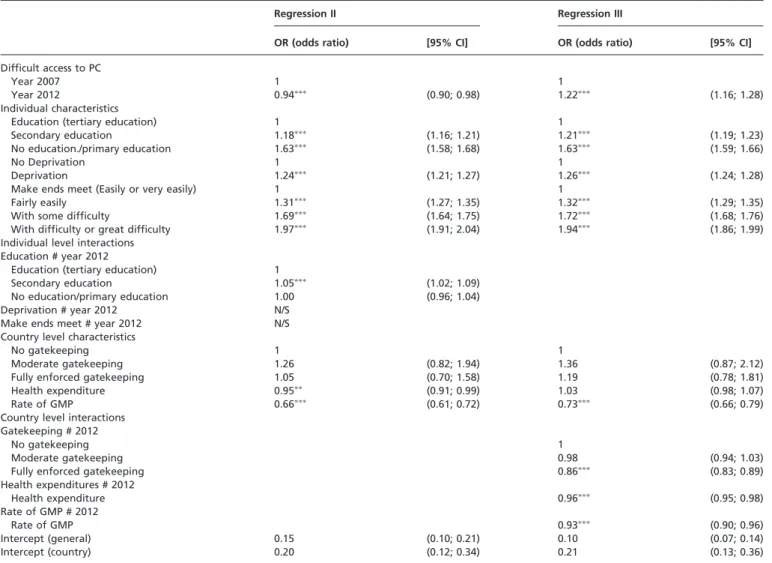
The effect of individual SE characteristics during the great recession
The statistical significance of the interactions was tested using the contrasts of marginal linear predictions test.22The results were
stat-istically significant only for education (P< 0.01). Between 2007 and 2012 there was a slight but significant improvement in access to PC, for those with secondary education in comparison with those with tertiary education (OR = 0.99, P< 0.01), but overall there were no significant changes in the SE patterning of access to PC (Regression II,table 3).
The effect of the health systems characteristics during the great recession
The results for the interacting terms were statistically significant (P< 0.01) for all health systems characteristics, which indicates that between 2007 and 2012 access to PC was significantly improved for people living in countries with higher total health expenditures per capita; with higher rate of GMP per 1, 000 inhab-itants, and with fully enforced gatekeeping systems (OR = 0.94,
P< 0.01; Regression III,table 3).
Conclusions
Key findings and interpretation
First, our study shows that the probability of reporting difficult access to PC in 28 European countries fell by 4% in 2012, in comparison to 2007. Some studies showed that unmet medical needs increased significantly across Europe during the Great Recession.5–7,23–25However, these studies did not investigate where these needs were unmet. Our finding clearly suggests that these worrisome results may not have been caused by access to PC. In fact, during the Great Recession, in many countries there was an impulse towards outpatient care through the substitution of secondary care with PC, an increased centralization of hospitals with improved coordination in PC, and an overall investment in PC.26,27
For example, in Portugal despite the increase in user charges (co-payments) at all levels of care, it was ensured that this rise was proportionally lower for PC, and that the fees remained relatively low. Also, other incentives were set for patients to go first to PC, such as the exemption of user charges in emergency care from episodes that resulted from referral by a GP.28 In Latvia, co-payments for GP were kept relatively unchanged, despite the increase for outpatient care. Additionally, the share of spending on GP care increased from 9% in 2008–14% in 2010, and the payments to GP also rose by 45% during this period.27Also in Lithuania PC suffered less drastic budget cuts as compared with other levels of care, and had funding priority. In addition, providers were forced to increase efficiency by introducing incentives to treat more patients in PC (amongst other measures), in order to maintain access to healthcare.27 In the Netherlands GPs were given a more central
role in the provision of care in the community, and their role as gatekeepers was strengthened. Also, specialized nurses to provide care for patients with chronic diseases were introduced at the PC level. In order to achieve this, the expenditure on GP care was allowed to grow by 2.5% per year between 2014 and 2017, while
Table 2 Multilevel mixed-effects logistic regression for the prob-ability of reporting difficult access to primary care, between 2007 and 2012, in 28 European Countries
Regression I
OR (odds ratio) [95% CI]
Difficult access to PC
Year 2007 1
Year 2012 0.96 (0.95; 0.98)
Individual characteristics
Age 1.00 (1.00; 1.00)
Female 1
Male 1.02 (1.01; 1.03)
Not married 1
Married 1.00 (0.98; 1.01)
Country of birth (same as residence) 1
Country of birth (any other EU country) 0.95 (0.91; 0.99) Country of birth (any other country) 0.73 (0.71; 0.75) Education (tertiary education) 1
Secondary education 1.21 (1.19; 1.23) No education/primary education 1.63 (1.59; 1.66)
No deprivation 1
Deprivation 1.25 (1.23; 1.27)
Make ends meet (easily or very easily) 1
Fairly easily 1.32 (1.29; 1.35)
With some difficulty 1.72 (1.68; 1.76) With difficulty or great difficulty 1.94 (1.89; 1.99) Self-reported health (very good) 1
Good 1.13 (1.11. 1.15)
Fair 1.29 (1.26; 1.33)
Bad or very bad 1.71 (1.66; 1.76) No chronic condition 1
Chronic condition 1.03 (1.02; 1.05) Country level characteristics
No gatekeeping 1
Moderate gatekeeping 1.28 (0.83; 1.98) Fully enforced gatekeeping 1.06 (0.70; 1.61) Health expenditure 0.96 (0.93; 1.00)
Rate of GMP 0.66 (0.61; 0.72)
Intercept (general) 0.14 (0.10; 0.20) Intercept (country) 0.20 (0.12; 0.35)
Note: The intra-class correlation (ICC) for the empty model was 0.10 (95% CI 0.06; 0.16) and 0.06 (95% CI 0.04; 0.10) after the addition of all individual variables.
: P< 0.1;:P< 0.05;:P< 0.01.
other healthcare expenditures were forced to decrease.27In Belgium one of the programme aimed at strengthening PC was to grant financial incentives to GPs to establish their practices in deprived areas.27 There are thus many examples suggesting that in some countries the budget cuts in the healthcare sector did not affect the most basic and inexpensive care, and were even accompanied by improved access to PC.
Second, our study also shows that people with low SE status, i.e. with lower education, lower ability to make ends meet, and those with material deprivation, reported poorer access to PC, suggesting significant SE inequalities in favour of the high-SE status people, after controlling for need differences. Earlier studies report no evidence of income-related inequality in the utilization of PC services, measured by the probability of visiting a GP, and by the conditional number of visits, in EU29and OECD30countries. Some authors even report a pro-poor distribution in some countries.29,30
We assume that accessing PC represents a considerable burden for people with low-SE status, and that they may live in SE disadvantaged areas where access to PC may be influenced by the availability (or not) of transportation systems, by the distance to PC facilities, and by a shortage of PC physicians.31We used a subjective measure of the economic hardship (make ends meet) instead of income, since this perceived economic well-being is an important indicator for understanding the financial capacity of the individual
at any age.32This measure is used in many studies, and has shown clear associations with health outcomes.33 Nevertheless, we also performed the analysis using quintiles of income, and the SE patterning was maintained, with the people in the lowest quintiles of income experiencing a significantly greater likelihood of difficult access to PC services, in comparison with the highest quintile of income (OR = 1.63,P< 0.01).
Third, our study shows that in 2012, in comparison to 2007, there were no substantial changes in the SE patterning of access to PC, which suggests that the SE inequalities in access to PC remained the same, which is consistent with the persistent SE inequalities in health in Europe.34Nonetheless, it also indicates that during the period of the economic crisis the most vulnerable populations were not impaired in relation to the better-off, and that some policy measures were in place to provide some social and financial protection to the poorer people. For example, in Portugal, exemptions to user charges increased considerably, with the purpose of protecting the lower-income people and other vulnerable population groups.28 Also, in the Netherlands the decrease of care allowance was adjusted in a way that people with lower incomes experienced less reduction than people with higher incomes and additional protection was offered for GP care, maternity care and care for children.26
Table 3 Multilevel mixed-effects logistic regression for the probability of reporting difficult access to primary care, including individual and country level interactions with year
Regression II Regression III
OR (odds ratio) [95% CI] OR (odds ratio) [95% CI]
Difficult access to PC
Year 2007 1 1
Year 2012 0.94 (0.90; 0.98) 1.22 (1.16; 1.28)
Individual characteristics
Education (tertiary education) 1 1
Secondary education 1.18 (1.16; 1.21) 1.21 (1.19; 1.23)
No education./primary education 1.63 (1.58; 1.68) 1.63 (1.59; 1.66)
No Deprivation 1 1
Deprivation 1.24 (1.21; 1.27) 1.26 (1.24; 1.28)
Make ends meet (Easily or very easily) 1 1
Fairly easily 1.31 (1.27; 1.35) 1.32 (1.29; 1.35)
With some difficulty 1.69 (1.64; 1.75) 1.72 (1.68; 1.76)
With difficulty or great difficulty 1.97 (1.91; 2.04) 1.94 (1.86; 1.99) Individual level interactions
Education # year 2012
Education (tertiary education) 1
Secondary education 1.05 (1.02; 1.09)
No education/primary education 1.00 (0.96; 1.04) Deprivation # year 2012 N/S
Make ends meet # year 2012 N/S Country level characteristics
No gatekeeping 1 1
Moderate gatekeeping 1.26 (0.82; 1.94) 1.36 (0.87; 2.12)
Fully enforced gatekeeping 1.05 (0.70; 1.58) 1.19 (0.78; 1.81)
Health expenditure 0.95 (0.91; 0.99) 1.03 (0.98; 1.07)
Rate of GMP 0.66 (0.61; 0.72) 0.73 (0.66; 0.79)
Country level interactions Gatekeeping # 2012
No gatekeeping 1
Moderate gatekeeping 0.98 (0.94; 1.03)
Fully enforced gatekeeping 0.86 (0.83; 0.89)
Health expenditures # 2012
Health expenditure 0.96 (0.95; 0.98)
Rate of GMP # 2012
Rate of GMP 0.93 (0.90; 0.96)
Intercept (general) 0.15 (0.10; 0.21) 0.10 (0.07; 0.14)
Intercept (country) 0.20 (0.12; 0.34) 0.21 (0.13; 0.36)
Note: #, interaction; N/S, not significant. Both regressions included as confounder the age, sex, civil status, country of birth, self-reported health and chronic condition. The odds ratios for these variables were not included in the table to ease the reading.
:P< 0.05;:P< 0.01.
Finally, our results show that during the Great Recession people living in countries with higher total health expenditures per capita, with higher rate of GMP per 1000 inhabitants, and with fully enforced gatekeeping systems experienced a greater improvement in access to PC. Recent evidence showed that European countries with higher overall health expenditures had stronger PC systems, possibly due to the decentralization of services delivery and due to the necessary costs of maintaining this strong structure, but had also slower growth in healthcare spending.35 This result suggests
that countries with higher investment in health and PC resources were better equipped to face the detrimental effect of the crisis in access to PC.
Limitations
This study has some limitations that should be addressed. First, it would be desirable to measure the yearly evolution of the difficulty of access to PC before and during the entire period of the Great Recession. However, data regarding the access to PC are available only in thead hocmodules of the EU-SILC, which are collected every five years. Therefore, we were able to analyse the changes in access to PC only between 2007 and 2012, which however correspond well to the pre- and post-recession period.
Second, we did not measure access in terms of effectiveness, quality and continuity of care, since these are not taken into con-sideration in the questionnaire. Therefore, some people may have good physical access to PC but they may have poor treatment compliance, lower quality of care or lower continuity of care.
Third, access is a broad concept and the perception of the difficulty in access to PC may vary both within and across countries. Even though there is a comprehensive validation procedure applied for EU-SILC data,36 to the best of our
knowledge, no specific validation of the ‘access to PC’ question was performed. Note however that the Eurobarometer survey on health and long-term care (2007)37used a similar question.
Fourth, the EU-SILC questionnaire does address PC non-utiliza-tion, and it is therefore not possible to know if non-users do not use PC services by choice (e.g. people with high SE status who use specialized private care), or because they are not able to do so (e.g. very low SE status people who face major access barriers). Additionally, the non-utilization of health services may not be a function of individual choice, since some choices are not informed due to a lack of education or of culturally acceptable services.38
Hence, even if non-users represented only 1.6% of the sample, our analysis might be biased by considering only the sub-sample of users. In order to evaluate this potential bias, we performed an additional analysis, using a two-stage regression. First, we estimated the predicted probability of the use of PC services for each individual, using a probit regression. Then we replicated the original logistic regressions weighting observations by the inverse predicted prob-ability of being a PC user, from the probit regression. We found no differences in the OR between the two models, i.e. with and without sample weights, which suggests that the results in terms of access to PC are not biased by the non-users (see full results in the
Supplementary Appendix).
Finally, although EU-SILC is a standard and comparable survey that contains a nationally representative samples of individuals aged 16 years and older in 32 European countries, it has some limita-tions.39 Sampling methods vary across countries, and the non-responses are handled through proxy interviewing and imputation of missing data, in order to complete samples and avoid selection bias. The full information about quality reports of each country is publicly available elsewhere.8
Supplementary data
Supplementary dataare available atEURPUBonline.
Acknowledgements
We thank the research members from Nova Healthcare Initiative for their fruitful discussions on a late draft of this article. The final manuscript is the responsibility of the authors. The first author thanks Fundac¸a˜o para a Cieˆncia e a Tecnologia for the PhD research Grant (FCT PhD Programmes).
Funding
The first author was supported by a PhD research Grant (FCT PhD Programmes) from Fundac¸a˜o para a Cieˆncia e a Tecnologia.
Conflicts of interest: None declared.
Key points
Access to PC improved between 2007 and 2012, and this
improvement was greater for people living in countries with a higher investment in health and in PC.
Low-SE status people report poorer access to PC and this
was stable between 2007 and 2012.
Supportive PC policies are essential especially during
economic recession periods; nevertheless, more attention should be given to the reduction of inequalities in access to PC.
References
1 Starfield B, Shi L, Macinko J. Contribution of primary care to health systems and health.Milbank Q2005;83:457–502.
2 Hansen J, Groenewegen PP, Boerma WGW, Kringos DS. Living in a country with a strong primary care system is beneficial to people with chronic conditions.Health Aff2015;34:1531–7.
3 European Observatory on Health Systems and Policies. In: Kringos DS, Boerma WGW, Hutchinson A, Saltman RB, editors. Building Primary Care in a Changing Europe, 2015. 172 p. United Kingdom: WHO Regional Office for Europe. 4 Karanikolos M, Mladovsky P, Cylus J, et al. Financial crisis, austerity, and health in
Europe.Lancet2013;381:1323–31.
5 Legido-Quigley H, Karanikolos M, Hernandez-Plaza S, et al. Effects of the financial crisis and Troika austerity measures on health and health care access in Portugal.
Health Policy (New York)2016;120:833–9.
6 Zavras D, Zavras AI, Kyriopoulos I-I, et al. Economic crisis, austerity and unmet healthcare needs: the case of Greece.BMC Health Serv Res2016;16:309. 7 Karanikolos M, Gordeev VS, Mackenbach JP, McKee M. Access to care in the Baltic
States: did crisis have an impact?Eur J Public Health2016;26:236–41. 8 European Commission CIRCABC. Comparative EU Quality Reports [Internet].
Available at: https://circabc.europa.eu/faces/jsp/extension/wai/navigation/container. jsp?FormPrincipal:_idcl=FormPrincipal:_id1&FormPrincipal_SUBMIT=1&id=47d fd41d-52ab-4ec6-89b2-951e2a542a57&javax.faces.ViewState=6%2BZHCB55B2O Dj8KPnd%2B8j8Vesnegcb8lnmQlYsMM84lEMgTRiod4 (7 December 2017, date last accessed).
9 OECD Statistics. Health Expenditure and Financing [Internet]. Available at: http:// stats.oecd.org/ (1 February 2017, date last accessed).
10 Paris V, Devaux M, Wei L. Health Systems Institutional Characteristics: A Survey of 29 OECD Countries. OECD Heal Work Pap No 50, OECD Publ. 2010. 11 Joumard I, Andre´ C, Nicq C. Health care systems: efficiency and institutions.OECD
Econ Dep2010;769:133.
12 WHO Europe, European Observatory on Health Systems and Policies. Health System Reviews (HiTs) [Internet]. World Health Organization; 2017. Available at: http://www.euro.who.int/en/about-us/partners/observatory/publications/health-system-reviews-hits (1 February 2017, date last accessed).
13 Eurostat Database. Physicians by Medical Speciality [Internet]. Available at: http:// ec.europa.eu/eurostat/data/database (1 February 2017, date last accessed). 14 The World Bank. Health Expenditure Per Capita, PPP [Internet]. Available at:
http://data.worldbank.org/indicator/SH.XPD.PCAP.PP.KD (1 February 2017, date last accessed).
15 European Commission. Eurostat. EU-SILC 2012 Module on Housing Conditions – Description of SILC Secondary Target Variables [Internet]. 2010. Available at: http://ec.europa.eu/eurostat/documents/1012329/6071326/2012+Module+-+hous ing.pdf/2dc3c3ed-6637-4bcb-8f5d-369269eb0164
16 Samuelson PA, Nordhaus WD.Economics. 19th edn. New York, NY: McGraw-Hill/ Irwin, 2010.
17 Eurostat Database. Percentage Change on Previous Period. Gross Domestic Product at Market Prices [Internet]. Available at: http://ec.europa.eu/eurostat/data/database (13 February 2017, date last accessed).
18 Eurostat. Glossary: Material Deprivation – Statistics Explained [Internet]. Available at: http://ec.europa.eu/eurostat/statistics-explained/index.php/Glossary: Severe_ material_deprivation_rate (30 January 2017, date last accessed).
19 Mohseni M, Lindstrom M. Social capital, trust in the health-care system and self-rated health: the role of access to health care in a population-based study.Soc Sci Med2007;64:1373–83.
20 StataCorp.Stata Multilevel Mixed-Effects Reference Manual: Release 13. College Station, TX: Stata Press, 2013.
21 Chaupain-Guillot S, Guillot O. Health system characteristics and unmet care needs in Europe: an analysis based on EU-SILC data.Eur J Health Econ2015;16:781–96. 22 StataCorp.Working with categorical data and factor variables. In Stata Release 13
Statistical Software. College Station, Texas: Stata Press, 2013.
23 Karanikolos M, Kentikelenis A. Health inequalities after austerity in Greece.Int J Equity Health2016;15:83.
24 Madureira-Lima J, Reeves A, Clair A, Stuckler D. The Great Recession and inequalities in access to health care: a study of unemployment and unmet medical need in Europe in the economic crisis.Int J Epidemiol2017;1–11.
25 Reeves A, McKee M, Stuckler D. The attack on universal health coverage in Europe: recession, austerity and unmet needs.Eur J Public Health2015;25:364–5. 26 Mladovsky P, Srivastava D, Cylus J, et al. Health policy responses to the financial
crisis in Europe.Policy Summ2012;1–38.
27 Maresso A, Mladovsky P, Thomson S, et al. Economic crisis, health systems and health in Europe – Country experience. Economic Crisis, Health Systems and Health in Europe, 2015. 517 p.
28 Barros PP. Health policy reform in tough times: the case of Portugal.Health Policy (New York)2012;106:17–22.
29 Van Doorslaer E, Koolman X, Jones AM. Explaining income-related inequalities in doctor utilisation in Europe.Health Econ2004;13:629–47.
30 Van Doorslaer E, Masseria C, Koolman X. Inequalities in access to medical care by income in developed countries.Can Med Assoc J2006;17;174:177–83.
31 Mobley LR, Root E, Anselin L, et al. Spatial analysis of elderly access to primary care services.Int J Health Geogr2006;5:19.
32 Litwin H, Sapir EV. Perceived income adequacy among older adults in 12 countries: findings from the survey of health, ageing, and retirement in Europe.Gerontologist
2009;49:397–406.
33 Ahnquist J, Wamala S, Lindstrom M. Social determinants of health – a question of social or economic capital? Interaction effects of socioeconomic factors on health outcomes.Soc Sci Med2012;74:930–9.
34 Hu Y, van Lenthe FJ, Borsboom GJ, et al. Trends in socioeconomic inequalities in self-assessed health in 17 European countries between 1990 and 2010.J Epidemiol Commun Health2016; doi: 10.1136jech-2015-206780.
35 Kringos DS, Boerma W, Van Der Zee J, Groenewegen P. Europe’s strong primary care systems are linked to better population health but also to higher health spending.Health Aff2013;32:686–94.
36 Eurostat. EU Statistics on Income and Living Conditions (EU-SILC) Methodology – Data Quality [Internet]. 2015. Available from: http://ec.europa.eu/eurostat/statisti cs-explained/index.php? title=EU_statistics_on_income_and_living_conditions_ (EU-SILC)_methodology_–_data_quality&oldid=272009 (8 December 2017, date last accessed).
37 European Commission.Health and Long-term Care in the European Union, Vol. 283, Special Eurobarometer. 2007. Available from http://ec.europa.eu/commfrontoffice/ publicopinion/archives/ebs/ebs_283_en.pdf.
38 Allin S, Grignon M, Le Grand J. Subjective unmet need and utilization of health care services in Canada: what are the equity implications?Soc Sci Med2010;70:465–72. 39 Arora VS, Karanikolos M, Clair A, et al. Data resource profile: the European
Union statistics on income and living conditions (EU-SILC).Int J Epidemiol
2015;44:451–61.