ABSTRACT: Liming represents a management procedure that can affect the soil structure and its thermodynamic processes. In this
context, the aims of this study were to assess (i) the effects of the
surface and incorporated liming on the clay dispersion, soil water
availability, and aeration capacity; (ii) the influence of soil chemical
alterations in its physical attributes. For this, a field experiment was
installed in a family farming property, located in the southeastern
region of the State of Paraná, in a Dystrudept soil. The treatments
were 3 application modes (on the surface, incorporated via plowing
and incorporated via subsoiling and harrowing), with and without
15 Mg·ha–1 of lime, aiming to increase the base saturation in the
topsoil (0 – 0.20 m) to approximately 70%. Eighteen months after
application, undisturbed and disturbed soil samples were collected
from the 0 – 0.10 and 0.10 – 0.20 m layers to evaluate the
water-dispersed clay (WDC), water content at the field capacity (θFC)
SOIL AND PLANT NUTRITION -
Article
Surface and incorporated liming effects on
clay dispersion, water availability, and aeration
capacity of a Dystrudept soil
André Carlos Auler1*, Luiz Fernando Pires2, Eduardo Fávero Caires3
1. Universidade Estadual de Ponta Grossa - Programa de Pós-Graduação em Agronomia - Ponta Grossa (PR), Brazil. 2. Universidade Estadual de Ponta Grossa - Departamento de Física - Ponta Grossa (PR), Brazil.
3. Universidade Estadual de Ponta Grossa - Departamento de Ciência do Solo e Engenharia Agrícola - Ponta Grossa (PR), Brazil.
*Corresponding author: [email protected]
Received: Jul. 15, 2016 – Accepted: Oct. 3, 2016
and at the permanent wilting point (θPWP), plant available water capacity (PAWC), relative water capacity (RWC), aeration capacity
(AC), granulometry and the soil structural and chemical attributes.
WDC content in the 0 – 0.10 m layer increased when the soil was
revolved and it was influenced exclusively when lime was applied
on the soil surface. With surface liming there were increase in θFC,
θPWP, PAWC and RWC, and reduction in AC in the 0 – 0.10 m layer. In
the 0.10 – 0.20 m layer isolated effects were verified of the modes
application and liming on θFC, PAWC and RWC, while θPWP was not influenced by treatments. The soil water availability and aeration
capacity alterations were mainly affected by micro and macroporosity
increases, pH reduction, Al3+ precipitation, and substitution of this
ion in the exchange complex by Ca2+ and Mg2+.
INTRODUCTION
Soil water availability and aeration capacity are important soil physical attributes which depend on soil structure affecting the crop development and yield (Fernández-Ugalde et al. 2009). Low water availability reduces water and nutrients plant uptake, especially in acid soils where the root grow was limited in the surface layers (Caires et al. 2008; Joris et al. 2013).
Soil acidity is considered a limiting factor to the yield in extensive areas of the world, especially in tropical and subtropical regions (von Uexküll and Mutert 1995). Specifically, in Brazil near 70% of the soils are estimated as acids (Quaggio 2000). Damages caused by the soil acidity are commonly corrected through lime application. However, the acidity correction dynamics depends on the mode of corrective material application (Caires et al. 2008; Caires et al. 2011).
Lime application started to be carried out at the soil surface after the no-tillage system appearance. However, as lime presents low water solubility and the products of its reaction with the soil have limited mobility, the surface liming action is slow in reducing sub-superficial acidity (Caires et al. 1998; Ciotta et al. 2004; Caires et al. 2011). On the other hand, in conventionally tilled areas, the tilled layer acidity is neutralized through lime mechanical incorporation, and the reaction is favored by mixing the corrective material with the soil (Caires et al. 2006).
Although incorporation favors lime reaction, when used isolated, soil tillage alters its structure, changing thermodynamic processes that occur, such as water availability and aeration capacity (Gómez-Paccard et al.
2015). Liming might affect the soil structure in positive or negative ways (Haynes and Naidu 1998; Bronick and Lal 2005).
However, the number of scientific works about the influence of liming on the soil physical attributes is scarce, contrasting and commonly limited to the Oxisols aggregation mechanisms, especially in clay dispersion and flocculation (Castro Filho and Logan 1991; Roth and Pavan 1991; Haynes and Naidu 1998; Albuquerque et al. 2000; Albuquerque et al. 2003).
The comprehension about the effects of the clay dispersion and soil flocculation is important, and these attributes affect the porous space (Spera et al. 2008). These alterations might also reflect in the soil water availability and aeration capacity.
In this context, data obtained in this study aimed to assess (i) the effects of the surface and incorporated liming on the clay dispersion, soil water availability and aeration capacity of a Dystrudept; (ii) the influence of soil chemical alterations in its physical attributes.
MATERIAL AND METHODS
Study location and characterization
The experiment was installed in May 2012, in a family farming property in the city of Irati (lat 25°28′S, long 50°54′W, altitude of 821 m.a.s.l.), southeastern region of Paraná State, Brazil. The rainfall data registered from the beginning of the experiment and the region background average is presented in Figure 1. According
Figure 1. Weekly rainfall and monthtly average rainfall in region of study. For monthtly average rainfall was considered the periodo between 1963 to 2013.
0 50 100 150 200 250
1 2 3 4 1 2 3 4 1 2 34 1 23 4 1 2 3 4 1 2 34 1 23 4 1 2 3 4 1 2 3 4 1 2 34 1 23 4 1 2 3 4 1 2 34 1 2 34 1 2 34 1 2 34 1 2 3 4 1 2 3 4 1 2 34
Jun Jul Aug Sep Oct Nov Dec Jan Feb Mar Apr May Jun Jul Aug Sep Oct Nov Dec 2012
1, 2, 3 and 4: Weeks of the month Weekly rainfall Monthly average
2013
P
rec
ip
itatio
n
to the Köppen classification, the region has a humid subtropical climate (Cfb) (IAPAR 2009).
The soil under study is classified as a Dystrudept silt-clay (Soil Sur vey Staff 2013), or “Cambissolo Háplico Alumínico” according to Brazilian System of Soil Classification (Santos et al. 2013). Neither liming or fertilizer was applied since the conversion into agroecosystem pasture (from the 1960s). The forage implemented in the experimental area was the giant missionary grass (Axanopus catharinensis), managed in continuous grazing and low stocking rate. The soil attributes evaluated before the experiment installation are presented in Table 1.
Experiment characterization and development
The experiment was carried out in bands with a factorial design (3 × 2). In the bands (300 m2)
, the different modes of lime application were distributed (on the surface; incorporated via plowing and harrowing; incorporated via subsoiling and harrowing); while in the plots (150 m2) 0 (control) and lime (15 Mg·ha–1) application treatments were established. The lime rate was calculated to raise the base saturation in the topsoil (0 – 0.20 m) to approximately 70%, according to the results obtained by Caires et al. (2005) and Caires et al. 2006). The lime used presented 285 and 200 g·kg–1 CaO and MgO as well as 101, 75 and 75% neutralizing power, reactivity and effective calcium carbonate equivalent, respectively.
Thus, the treatments were: Control — no lime and no tillage; LS — lime on the surface and no tillage; PH — no lime but tillage with plowing and harrowing; LIPH —
lime incorporated via plowing and harrowing; SH — no lime but tillage with subs oiling and harrowing; LISH — lime incorporated with subsoiling and harrowing.
In the treatments that involved tillage for incorporation, the application was carried out in 2 phases: 50% of the dosage before the first management operation (plowing or subsoiling) and the remaining 50% after this operation, however, before the leveling harrowing (the same for both incorporation modes). In the LS treatment, the corrective material was applied in a single dosage, broadcasted on the soil surface (Caires et al. 2006; Joris et al. 2016).
For plowing, a 3-disc of 28” reverse plow was employed and the subsoiling was carried out with 5 parabolic stems spaced at 0.40 m. Both operations were carried out at 0.25 m soil depth. After these initial operations, harrowing was carried out with a leveling harrow of 32 discs of 20″, spaced at 0.175 m and 0.10 m depth.
After liming application, in May 2012 (and 2013), the intercropped system of black oat and hairy vetch (50 kg·ha–1 for each one) was implemented through surface sowing during the autumn-winter season. In August 2012 (and 2013), the crop dissection was carried out (glyphosate, 3 c.p. L·ha–1). After that, the corn crop was sowed (October 2012 and November 2013) with a 0.90 m row spacing and density of around seven seeds per meter. It was conducted without soil preparation, employing a five-line sowing-fertilizing machine equipped with plane discs to open furrows, and modified double disc to deposit fertilizer and seed.
The crop phytosanitary treatment and the phytomass management were made with a backpack sprayer, aiming to avoid machinery traffic on the area. In 2013 – 2014, the same crop succession was employed with few adaptations according to the crop needs.
Layer
( m) pH
OC (g·kg–1)
H + Al Al3+ Ca2+ Mg2+ K+ CEC V m
(cmolc·dm–3) (%)
0 – 0.10 3.7 27.46 16.33 6.80 1.00 1.30 0.61 19.24 15 70
0.10 – 0.20 3.6 19.46 19.63 9.00 0.40 0.50 0.41 20.94 6 87
Layer ( m)
Sand Silt Clay WDC6 PD7 BD8 TP9 Ma10 Mi11 AC12
(g·kg–1) (Mg·m–3) (m3·m–3)
0 – 0.10 46 474 480 238 2.50 1.19 0.51 0.05 0.46 0.07
0.10 – 0.20 54 469 477 248 2.53 1.21 0.51 0.06 0.45 0.08
Table 1. Soil chemical and physical attributes in the 0 – 0.10 and 0.10 – 0.20 m layers (n = 4) of the Dystrudept before the experiment installation.
Sampling, evaluations, and analyses
Eighteen months after liming, around 30 days after corn sowing, 4 soil samples were collected (considered as replications) per plot in the intrarows of the crop, in each soil layer (0 – 0.10 and 0.10 – 0.20 m). Disturbed and undisturbed soil samples were obtained. Disturbed soil samples were collected using a shovel and the undisturbed ones with stainless steel volumetric rings (0.05 × 0.05 m, external diameter and height) employing an Uhland sampler.
The undisturbed samples were saturated by the capillary rise procedure and submitted to matric potentials (Ψm) –6 and –10 kPa in a tension table (model M1-0801, Eijkamp®).
After this, the water content at the field capacity (θFC) defined as –10 kPa was determined. After the thermodynamic equilibrium, the undisturbed samples had their wet mass evaluated and, afterwards, they were dried in a forced air circulation oven (105 °C/48 h) to obtain the dry soil mass. Later on, the soil bulk density (BD) and volumetric water contents were calculated (Dane et al. 2002). Disturbed samples were used to determine the gravimetric water content at –1,500 kPa Ψm considered the permanent wilting point (θPWP), which was calculated considering the BD of the undisturbed soil sample (Dane et al. 2002).
Plant available water capacity (PAWC) was calculated through the differences between θFC and θPWP, and the relative water capacity (RWC) through the relation between θFC and water content at saturation (θS)(Reynolds et al. 2007). Aeration capacity (AC) was calculated through the difference between the total porosity (TP) and θFC. TP was determined considering the relation between BD and particle density (PD), which was determined by helium gas pycnometer (model ACCUPYC 1330, Micromeritics Instrument Corp.®).
Microporosity (Mi) was obtained considering the soil water retained at –6 kPa and macroporosity (Ma) by the difference between TP and Mi (Dane et al. 2002).
Disturbed soil samples were dried in a forced air circulation oven (40 °C/48 h) and sieved in a 2-mm mesh sieve. Later on, the sand, silt, clay and water-disperse clay (WDC) contents were determined by the densimeter method; however, without previous sample treatment (H2O2 30 v·v
–1) and the use of chemical dispersion
(NaOH 1.0 mol·L–1) in the latter (Dane et al. 2002). The degree of flocculation (DF) was calculated based on the total clay content and WDC (Dane et al. 2002). The organic carbon
content (OC) was determined by the Walkley-Black method; active acidity (pH); potential acidity (H+Al); and Al3+, Ca2+ and Mg2+ contents were also evaluated (van Raij et al. 2001).
Statistical analysis
The variance analysis statistical model was applied to both soil layers (0 – 0.10 and 0.10 – 0.20 m) data employing the completely randomized design in factorial arrangement (2 × 3), with four replications (Fisher 1966). Presuppositions of residue normality and homoscedasticity were verified by the Shapiro-Wilk and Bartlett tests, respectively (Bartlett 1937; Shapiro and Wilk 1965). When necessary, Box-Cox optimum potency was used to the data transformation (Box and Cox 1964). After presuppositions had been verified, the F-test was employed. In the case of significant interactions, decomposition analyses were carried out and whenever necessary the Tukey’s test was applied to multiple comparisons (Tukey 1959), and Pearson’s linear correlation analyses were performed (Pearson and Filon 1898). The software R, version 3.0.2, was used in the statistical analyses (R Core Team 2013).
RESULTS
Soil chemical and structural physical attributes
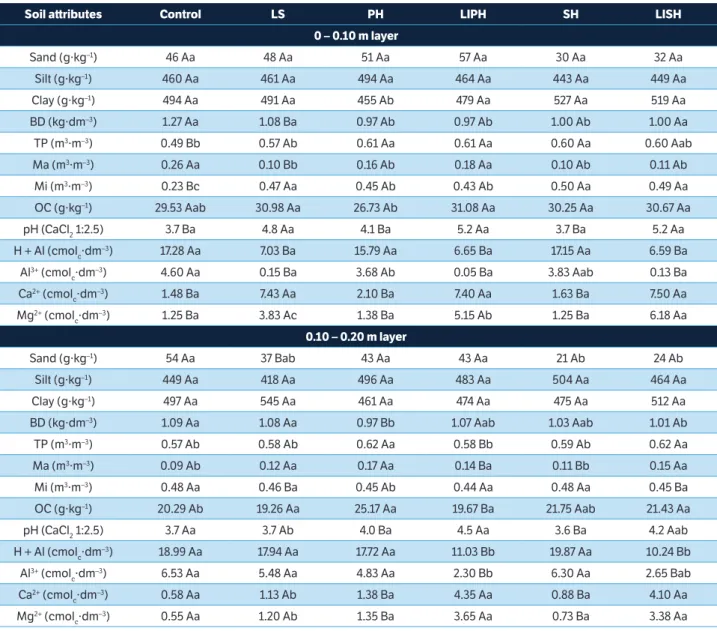
There was influence of the modes of lime application, the liming and their interaction on BD, TP, Ma, Mi and soil chemical attributes (pH, Ca2+, Mg2+, H + Al and Al3+ contents), in both soil layers (Table 2). Even with or without liming addiction, direct effects of tillage were verified, such as reduction in BD and increase in TP and Ma, as already reported by Auler et al. (2017).
Liming increased soil pH, Ca2+ and Mg2+, and reduced H + Al and Al3+ in all modes of application in the 0 – 0.10 m layer. In the 0.10 – 0.20 m these effects only occurred when lime was incorporated, and treatments with incorporation did not differ from each other (Table 2).
Water-dispersed clay and degree of flocculation
Soil attributes Control LS PH LIPH SH LISH
0 – 0.10 m layer
Sand (g·kg–1) 46 Aa 48 Aa 51 Aa 57 Aa 30 Aa 32 Aa
Silt (g·kg–1) 460 Aa 461 Aa 494 Aa 464 Aa 443 Aa 449 Aa
Clay (g·kg–1) 494 Aa 491 Aa 455 Ab 479 Aa 527 Aa 519 Aa
BD (kg·dm–3) 1.27 Aa 1.08 Ba 0.97 Ab 0.97 Ab 1.00 Ab 1.00 Aa
TP (m3·m–3) 0.49 Bb 0.57 Ab 0.61 Aa 0.61 Aa 0.60 Aa 0.60 Aab
Ma (m3·m–3) 0.26 Aa 0.10 Bb 0.16 Ab 0.18 Aa 0.10 Ab 0.11 Ab
Mi (m3·m–3) 0.23 Bc 0.47 Aa 0.45 Ab 0.43 Ab 0.50 Aa 0.49 Aa
OC (g·kg–1) 29.53 Aab 30.98 Aa 26.73 Ab 31.08 Aa 30.25 Aa 30.67 Aa
pH (CaCl2 1:2.5) 3.7 Ba 4.8 Aa 4.1 Ba 5.2 Aa 3.7 Ba 5.2 Aa
H + Al (cmolc·dm–3) 17.28 Aa 7.03 Ba 15.79 Aa 6.65 Ba 17.15 Aa 6.59 Ba
Al3+ (cmol c·dm
–3) 4.60 Aa 0.15 Ba 3.68 Ab 0.05 Ba 3.83 Aab 0.13 Ba
Ca2+ (cmol c·dm
–3) 1.48 Ba 7.43 Aa 2.10 Ba 7.40 Aa 1.63 Ba 7.50 Aa
Mg2+ (cmol c·dm
–3) 1.25 Ba 3.83 Ac 1.38 Ba 5.15 Ab 1.25 Ba 6.18 Aa
0.10 – 0.20 m layer
Sand (g·kg–1) 54 Aa 37 Bab 43 Aa 43 Aa 21 Ab 24 Ab
Silt (g·kg–1) 449 Aa 418 Aa 496 Aa 483 Aa 504 Aa 464 Aa
Clay (g·kg–1) 497 Aa 545 Aa 461 Aa 474 Aa 475 Aa 512 Aa
BD (kg·dm–3) 1.09 Aa 1.08 Aa 0.97 Bb 1.07 Aab 1.03 Aab 1.01 Ab
TP (m3·m–3) 0.57 Ab 0.58 Ab 0.62 Aa 0.58 Bb 0.59 Ab 0.62 Aa
Ma (m3·m–3) 0.09 Ab 0.12 Aa 0.17 Aa 0.14 Ba 0.11 Bb 0.15 Aa
Mi (m3·m–3) 0.48 Aa 0.46 Ba 0.45 Ab 0.44 Aa 0.48 Aa 0.45 Ba
OC (g·kg–1) 20.29 Ab 19.26 Aa 25.17 Aa 19.67 Ba 21.75 Aab 21.43 Aa
pH (CaCl2 1:2.5) 3.7 Aa 3.7 Ab 4.0 Ba 4.5 Aa 3.6 Ba 4.2 Aab
H + Al (cmolc·dm–3) 18.99 Aa 17.94 Aa 17.72 Aa 11.03 Bb 19.87 Aa 10.24 Bb
Al3+ (cmol c·dm
–3) 6.53 Aa 5.48 Aa 4.83 Aa 2.30 Bb 6.30 Aa 2.65 Bab
Ca2+ (cmol c·dm
–3) 0.58 Aa 1.13 Ab 1.38 Ba 4.35 Aa 0.88 Ba 4.10 Aa
Mg2+ (cmol c·dm
–3) 0.55 Aa 1.20 Ab 1.35 Ba 3.65 Aa 0.73 Ba 3.38 Aa
Table 2. Soil physical and chemical attributes in the 0 – 0.10 and 0.10 – 0.20 m layers of a Dystrudept due to the modes of lime application and liming.
Averages (n = 4) followed by the same capital letter for liming and the same small letter for the modes of lime application did not differ from each other by Tukey’s test (p < 0.05). Control = Treatment without liming; LS = Liming on the soil surface; PH = Plowing and harrowing without lime; LIPH = Lime incorporated via plowing and harrowing; SH = Subsoiling and harrowing without lime; LISH = Lime incorporated via subsoiling and harrowing; BD = Bulk density; TP = Total porosity; Ma and Mi = Macro and microporosity, respectively; OC = Organic carbon content (Walkley-Black method); pH = In CaCl2; H + Al = Potential acidity; Al
3+, Ca2+, and Mg2+ = Aluminium, calcium, and magnesium exchangeable, respectively. Adapted from Auler et al. (2017).
and harrowing > without tillage (Table 3 and Figure 2). Differently, in 0.10 – 0.20 m layer, WDC was influenced by the modes of lime application and the liming but not by their interaction (Table 3). In this specific case, liming increased the clay dispersion and treatments, without tillage and with plowing and harrowing, presented WDC statistically similar and lower than the treatments with subsoiling and harrowing in the 0.10 – 0.20 m soil layer (Figure 2).
However, for the DF there was influence of the modes of application and their interaction with liming in the
Sources of variation WDC DF θFC θPWP PAWC RWC AC 0 – 0.10 m layer
Modes of application * * * * * * *
Liming ns ns * * * * *
Modes versus liming ns * * * * * *
CV (%) 8 8 5 11 17 6 24
W 0.95ns 0.97ns 0.95ns 0.92ns 0.96ns 0.97ns 0.94ns
B0 0.00ns 4.57ns 3.30ns 20.12* 2.06ns 2.45ns 2.07ns
Sources of variation WDC DF θFC θPWP PAWC RWC AC
0.10 – 0.20 m layer
Modes of application * * * ns ns * *
Liming * ns * ns * * ns
Modes versus liming ns ns ns ns ns ns *
CV (%) 7 17 22 7 14 3 14
W 0.92ns 0.99ns 0.92ns 0.95ns 0.98ns 0.97ns 0.96ns
B0 10.12ns 9.15ns 4.18ns 7.40ns 6.27ns 1.71ns 6.76ns
Table 3. Summary of ANOVA of the water-dispersed clay, degree of flocculation, water content in field capacity, permanent wilting point, plant available water capacity, water relative capacity, and aeration capacity in the 0 – 0.10 and 0.10 – 0.20 m layers of a Dystrudept due to the modes of lime application and liming.
*Significant by the F-test (p < 0.05); nsNon-significant. WDC = Water-dispersed clay; DF = Degree of flocculation; θ
FC = Water content in field capacity;
θPWP = Permanent wilting point; PAWC = Plant available water capacity; RWC = Relative water capacity; AC = Aeration capacity; CV = Coefficient of variation.; W = Shapiro-Wilk test; B0 = Bartlett test.
c
b
a
b b
a
Surface PH SH
Modes of application
A A
B
A
200 250 300 350 350
Without With
Liming
WDC (g∙k
g
−1)
200 250 300
WDC (g∙k
g
−1) Aa
Ab Ab
Ba
Aa Aa
40 50 60 70
Surface PH SH
DF (%)
DF (%)
DF (%)
Modes of application
a
ab b
20 30 40 50
20 30 40 50
Surface PH SH
Modes of application
A A
Without With
Liming
Figure 3. Degree of flocculation (DF) in the 0 – 0.10 (a) and 0.10 – 0.20 m (b, c) layers of a Dystrudept due to the modes of lime application [on the surface, incorporated via plowing and harrowing (PH) and via subsoiling and harrowing (SH)] and liming [without (■) or with lime (■)]. Average values (n = 4) followed by the same capital letter for liming and the same small letter for the modes of application did not differ from each other by Tukey’s test (p < 0.05).
Figure 2. Water-dispersed clay content (g·kg–1) in the 0 – 0.10 (■) and 0.10 – 0.20 m (■) layers of a Dystrudept soil due to the modes of application (a) and liming (b). Average values (n = 4) followed by the same capital letter for liming and small letter for modes of application did not differ from each other by Tukey’s test (p < 0.05). PH = Incorporated via plowing and harrowing; SH = Incorporated via subsoiling and harrowing.
(a) (a)
(b)
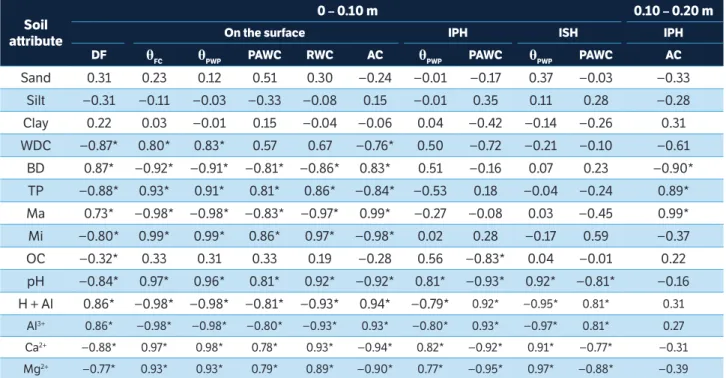
The acidity correction in LS reduced DF according to the increase found in the pH, Ca2+ and Mg2+ contents. However, the opposite were noted for Al3+ and H + Al contents. DF presented strong positive correlations with BD and Ma and strong negative correlations with TP and Mi (Table 4).
Soil water availability
In the layer 0 – 0.10 m, θFC, θPWP, PAWC, and RWC were influenced by the modes of lime application, liming and its interaction (Table 3). In this layer, without soil acidity correction, the PH, and SH treatments were not different from each other regarding θFC and were higher than that in the Control (Figure 4a). However, with liming the θFC with LISH treatment was higher than that with LIPH, while the LS treatment was similar with both modes of lime application. Among modes of lime application, liming increased θFC in the layer 0 – 0.10 m only when the corrective material was applied on the surface (Figure 4a). Regarding θPWP, in the layer 0 – 0.10 m, without liming, the PH and SH treatments did not differ from
each other and were higher than Control. While with soil acidity correction, there was no statistical difference between modes of lime application for θPWP in this layer. However, liming provided higher θPWP in the layer 0 – 0.10 m among lime application methods (Figure 4b).
Changes in the θPWP and θFC,in the 0 – 0.10 m layer, reflected on the PAWC. In this layer, without soil acidity correction, the Control treatment presented lower PAWC when compared with the PH and SH treatments, which did not differ from each other. Liming PAWC did not showed statistical differences among the LS, LIPH, and LISH treatments. However, liming resulted in a distinct PAWC behavior in the 0 – 0.10 m layer, regarding lime application methods. In treatments without soil disturbance, liming increased PAWC while with treatments that involved incorporation with plowing and harrowing or subsoiling and harrowing, liming reduced PAWC (Figure 4c).
The RWC in the 0 – 0.10 m layer was sensitive to changes in θS and θFC. Without soil acidity correction, the WLWT treatment presented RWC lower than that presented with PH and SH, which did not differ from
Soil attribute
0 – 0.10 m 0.10 – 0.20 m
On the surface IPH ISH IPH
DF θFC θPWP PAWC RWC AC θPWP PAWC θPWP PAWC AC
Sand 0.31 0.23 0.12 0.51 0.30 −0.24 −0.01 −0.17 0.37 −0.03 −0.33
Silt −0.31 −0.11 −0.03 −0.33 −0.08 0.15 −0.01 0.35 0.11 0.28 −0.28
Clay 0.22 0.03 −0.01 0.15 −0.04 −0.06 0.04 −0.42 −0.14 −0.26 0.31
WDC −0.87* 0.80* 0.83* 0.57 0.67 −0.76* 0.50 −0.72 −0.21 −0.10 −0.61
BD 0.87* −0.92* −0.91* −0.81* −0.86* 0.83* 0.51 −0.16 0.07 0.23 −0.90*
TP −0.88* 0.93* 0.91* 0.81* 0.86* −0.84* −0.53 0.18 −0.04 −0.24 0.89*
Ma 0.73* −0.98* −0.98* −0.83* −0.97* 0.99* −0.27 −0.08 0.03 −0.45 0.99*
Mi −0.80* 0.99* 0.99* 0.86* 0.97* −0.98* 0.02 0.28 −0.17 0.59 −0.37
OC −0.32* 0.33 0.31 0.33 0.19 −0.28 0.56 −0.83* 0.04 −0.01 0.22
pH −0.84* 0.97* 0.96* 0.81* 0.92* −0.92* 0.81* −0.93* 0.92* −0.81* −0.16
H + Al 0.86* −0.98* −0.98* −0.81* −0.93* 0.94* −0.79* 0.92* −0.95* 0.81* 0.31
Al3+ 0.86* −0.98* −0.98* −0.80* −0.93* 0.93* −0.80* 0.93* −0.97* 0.81* 0.27
Ca2+ −0.88* 0.97* 0.98* 0.78* 0.93* −0.94* 0.82* −0.92* 0.91* −0.77* −0.31
Mg2+ −0.77* 0.93* 0.93* 0.79* 0.89* −0.90* 0.77* −0.95* 0.97* −0.88* −0.39
Table 4. Pearson’s correlation coefficients (n = 8) between structural physical attributes, granulometry, and chemical attributes with water availability and aeration capacity due to liming applied on the surface, incorporated with plowing and harrowing or incorporated with subsoiling and harrowing in the 0 – 0.10 or 0.10 – 0.20 m layers (significant interactions).
*Significant to the F-test (p < 0.05). IPH = Incorporated with plowing and harrowing; ISH = Incorporated with subsoiling and harrowing; DF = Degree of flocculation;
each other. However, with liming, LS and LISH treatments were similar and higher than the LIPH. Regarding application methods, liming increased RWC only when lime was applied on the surface (Figure 4d).
In the 0.10 – 0.20 m layer, no significant interactions were observed for the variables θFC, θPWP, PAWC, and RWC. However, in this layer θFC and RWC were isolated influenced by the modes of lime application and the liming. While regarding PAWC there were only liming effects. The θPWP was not altered by the treatments in this layer (Table 3).
Treatments with plowing and harrowing presented lower θFC than that ones without tillage and with subsoiling and harrowing, which were not different from each other in the 0.10 – 0.20 m layer. Also, in this layer liming reduced θFC (Figure 5).
PAWC increased with liming in the 0.10 – 0.20 m layer, as a direct effect of θFC increase in this layer (Figure 5). Alterations of θFC in the 0.10 – 0.20 m layer, due to the modes of lime application and liming, also reflected on the RWC. In this layer, liming reduced RWC and the
treatments with plowing and harrowing presented RWC lower than that with treatments without tillage or with subsoiling and harrowing, which were not different from each other (Figure 5).
When lime was applied on the surface, θFC, θPWP, PAWC, and RWC presented strong positive correlations with WDC, TP, Mi, pH, Ca2+ and Mg2+, and strong negative correlations with BD, Ma, H+Al and Al3+. Arbitrarily, for incorporation with plowing and harrowing and incorporation with subsoiling and harrowing were verified significant correlations between θPWP and PAWC only with soil chemical attributes, and restricted to the 0 – 0.10 m soil layer (Table 4).
Soil aeration capacity
There was influence of lime application modes, liming and their interaction in AC in both soil layers, except for liming in the 0.10 – 0.20 m layer (Table 3). In the 0 – 0.10 m layer, the Control treatment presented higher AC than that in the PH and SH treatments, which Bb
Aa Aa
Aab
Ab
Aa
0,15 0,30 0,45 0,60
Bb
Ba Ba
Aa
Aa
Aa
0,10 0,20 0,30 0,40
Bb
Aa Aa
Aa Ba Ba
0,00 0,10 0,20 0,30
Surface PH SH
Bb
Aa
Aa Aa
Ab
Aa
0,50 0,60 0,70 0,80
Modes of application
Surface PH SH
Modes of application
Surface PH SH
Modes of application
Surface PH SH
Modes of application
θFC
(m
3∙m −3)
θPWP
(m
3∙m
−3
)
PA
W
C
(m
3∙m
−3
)
R
WC
(m
3∙m
−3
)
Figure 4. Water content in field capacity (θFC; a) and at the permanent wilting point (θPWP;b), plant water available capacity (PWAC; c) and soil relative water capacity (RWC; d) in the 0 – 0.10 m layer of a Dystrudept due to the modes of lime application [on the surface, incorporated via plowing and harrowing (PH) and via subsoiling and harrowing (SH)] and liming [without (■) or with lime (■)]. Averages (n = 4) followed by the same capital letter for liming and the same small letter for the modes of lime application did not differ from each other by Tukey’s test (p < 0.05).
(b)
(d) (a)
were not different from each other. With liming, AC, in the LIPH treatment, was higher than that in LS and LISH, which were similar in the 0 – 0.10 m layer. When the soil was not revolved to incorporate lime, surface liming promoted reduction in AC in the 0 – 0.10 m layer (Figure 6a).
In the layer 0.10 – 0.20 m, the PH treatment presented higher AC than that in the Control and SH treatments, which were similar to each other (Figure 6b). With liming, there was no difference in AC in the layer 0.10 – 0.20 m regarding the modes of lime application (Table 3). However, in relation to PH and SH treatments, the AC, in the 0.10 – 0.20 m layer, with LIPH was reduced and with LISH was increased, respectively (Figure 6b). In the 0 – 0.10 m layer, AC was correlated positively with BD, Ma, H + Al and Al3+ content and negatively with WDC, TP, Mi, pH, Ca2+ and Mg2+ contents, when lime was applied on the soil surface (Table 4). In the 0.10 – 0.20 m, AC was negatively correlated only with BD and positively with TP and Ma for the LIPH treatment in relation to PH treatment (Table 4).
a b a
a a a
a a a
a b a
0,00 0,20 0,40 0,60 0,80 0,00 0,20 0,40 0,60 0,80
Surface PH SH
Modes of application
A B A A A B A B Without With Liming θFC , θPWP
, PAWC, and RWC (m
3∙m −3)
θFC
,
θPWP
, PAWC, and RWC (m
3∙m −3 ) θ PWP WRC θ FC PAWC Aa Ab Ab Bb Aa Ab 0,05 0,15 0,25 0,35 Ab Aa Ab Aa Ba Aa 0,05 0,10 0,15 0,20
Surface PH SH
Modes of application
Surface PH SH
Modes of application
A C (m 3∙m −3) A C (m 3∙m −3)
Figure 5. Water content in field capacity (θFC) and at the permanent wilting point (θPWP), plant available water capacity (PAWC), and relative water capacity (RWC) in the 0.10 – 0.20 m layer of a Dystrudept due to the modes of application (a) and liming (b). Average values (n = 4) followed by the same capital letters for liming and small letter for mode of application did not differ from each other by Tukey’s test (p < 0.05). PH = Incorporated via plowing and harrowing; SH = Incorporated via subsoiling and harrowing.
Figure 6. Aeration capacity in the layers 0 – 0.10 (a) and 0.10 – 0.20 m (b) of a Dystrudept due to the modes of lime application [on the surface, incorporated via plowing and harrowing (PH), and incorporated via subsoiling and harrowing (SH)] and liming [without (■) or with (■) lime]. Averages (n = 4) followed by the same capital letter for liming and small letter for modes of lime application did not differ from each other by Tukey’s test (p < 0.05).
DISCUSSION
Clay dispersion and flocculation
The lowest WDC and the highest DF in the without tillage treatment (with and without liming) possibly resulted from the preservation of the soil macroaggregates. These results were not obser ved for PH and SH independently of the liming (Fernández-Ugalde et al. 2009). For WDC, considering that soil mobilization in the 0 – 0.10 m layer was the same for the treatments with plowing and subsoiling, as a function of the harrowing operation employed in both modes of application, the distinction among them might be ascribed to: (i) higher clay content in the soils under subsoiling and harrowing in relation to that under plowing and harrowing (Table 2); and (ii) the combined effect of higher soil Ma under plowing and harrowing when compared to that under subsoiling and harrowing (Table 4); together with the 2 wet (a)
(a)
(b)
and dry cycles occurred before the sample collection in 2013, between the 2nd week of June and the 2nd week of September, and between the 3rd week of September and the 3rd week of November (Figure 1), which preceded sample collection.
This effects occur because the initial clay content is one of the most important attributes in determining the amount of WDC (Kjaergaard et al. 2004), and the soil fast wetting, after a dr y c ycle, might have a disaggregating action due to the air bubbles trapped in the soil macropores (Kemper and Rosenau 1984; Roth and Pavan 1991; Oliveira et al. 2005; Pires et al. 2005, 2007). The fast soil wetting is due to the high water infiltration in soils with high macroporosity (Alaoui et al. 2011).
Considering that this result for PH and SH was not observed for DF (Figure 3a), it can be assumed that DF is more sensitive than WDC to assess the clay dispersion. It occurs for soils submitted to disturbance and differences in the initial total clay content (Table 2). One possible explanation for this result is that WDC did not consider the initial total clay content, which directly affects the WDC (Dane et al. 2002).
The non-significant effect of liming on the WDC and DF for LPH, and LSH treatments in the 0 – 0.10 m layer was possibly due to: (i) high Al3+ and H+ natural content in the soil (Table 1), considering that the trivalence and the small hydrated ions radius, respectively, present high resistance to dispersion (Russel 1973; Rengasamy et al. 1986; Haynes and Naidu 1998); and (ii) the lime time of reaction in the soil (18 months), since the dispersive effect of liming through the increase of negative charges, as a consequence of the increase in the soil pH, is minimized with time after the application due to the higher Ca2+ and Mg2+concentration, positively charged Al amorphous hydroxide [Al(OH)2+] precipitation and the highest soil solution ionic strength, which compresses the double diffuse layer and promote flocculation of the initially dispersed particles (Haynes and Naidu 1998; Albuquerque et al. 2003).
On the other hand, the significant effect of the liming in DF for the LS treatment in the 0 – 0.10 m layer might be explained by the exchange of Al3+ by Ca2+ and Mg2+ increasing the diffuse double layer, which increases the clay dispersion (Haynes and Naidu 1998; Albuquerque et al. 2003). Therefore, having in mind that LS exhibits a structure more closed than LPH and LSH (Table 2),
which preserves soil macroaggregates with Ca2+ coated surfaces (Briedis et al. 2012), the dispersed clays cannot be oriented and, as a result, they cannot flocculate to form new micro-aggregates and remain dispersed (Westerhof et al. 1999).
Similarly, although the lime reaction was lower in the 0.10 – 0.20 m layer when compared to 0 – 0.10 m, the pH and the Ca2+ and Mg2+ were lower and the Al3+ was higher in this layer in treatments without lime (Table 2). Therefore, in this case, the clay dispersion was certainly favored by the substitution of Al3+ for Ca2+ and Mg2+ in the cationic exchange complex, as a consequence of the Al3+ ion precipitation process, and the H+ ion reduction in the soil solution, which is clearly related to the valence effects and the hydrated ion radius (Russel 1973; Rengasamy et al. 1986; Albuquerque et al. 2000; Dontsova and Norton 2002).
Liming effects in the soil-water-air relations
The positive correlation between θFC and WDC might be an indirect effect of the highest WDC, considering that the WDC reduces the soil structure stability and alters its porous space (Roth and Pavan 1991; Albuquerque et al. 2003; Auler et al. 2017). This hypothesis is reinforced when are considered the similarities and correlation of θFC and Mi in the layer 0 – 0.10 m (Tables 2,4). In such case, higher Mi implies higher retention per capillarity, justifying higher θFC (Houlbrooke and Laurenson 2013; Libardi 2012).
Positive correlations between θPWP and Ca 2+ and
respectively (Figure 4b); however, in this case, Mi increase was more significant to the increase in PAWC.
Regarding the alterations in several soil physical and chemical attributes, through liming on the surface or incorporated, presented in this study, the absence of treatment effects on the θPWP in the 0.10 – 0.20 m layer (Table 3), might possibly be ascribed to the small variation of the lime reaction in this layer (Table 2) — pH between 3.6 and 4.5, for example — as a function of the short time of application (Joris et al. 2016).
Only the Control and SH treatments presented poor and ideal PAWC, respectively, in the 0 – 0.10 m layer, considering the PAWC categories revised by Reynolds et al. (2007) for fine texture soils: “ideal” (> 0.20 m3·m–3), “good” (≥ 0.15 and ≤ 0.20 m3·m–3), “limited” (≥ 0.10 and ≤ 0.15 m3·m–3) and “poor” (< 0.10 m3·m–3). According to this classification, LS, LIPH and LISH treatments presented limited PAWC and, on the other hand, PH treatment showed good PAWC in this layer.
These results show that although liming might be beneficial to soil water retention, mainly in the 0 – 0.10 m layer (Auler et al. 2017), soil acidity correction might limit the PAWC if there is lack of rainfall, depending on the period and the water stress level (Caires et al. 2008; Joris et al. 2013). However, when the crop root system reaches the 0.10 – 0.20 m soil layer, the plants are not likely to suffer water stress, since in this layer there was good PAWC regardless of the modes of lime application or liming (Table 3).
On the other hand, these limitations might not compromise crop growth, development and yield (Caires et al. 2008), since liming increases root growth, nutrient adsorption and accumulation of dr y mass in corn and soybeans in water stress conditions, mainly with Al3+susceptible genotypes (Joris et al. 2013).
Regarding RWC effects, according to Reynolds et al. (2007), only treatments with plowing and harrowing presented optimal balance between the soil water availability and aeration (RWC between 0.60 and 0.70), in both soil layers. The remaining treatments might have reduced the microbial activity in the soil due to lack of water (RWC < 0.60) or air in the soil (RWC > 0.70), which might hamper important processes that influence plant development such as mineralization (Reynolds et al. 2007).
In the 0 – 0.10 m layer, the increase in the BD and Ma, and reduction in TP and Mi, due to LS treatment in relation to Control shows strong positive correlations with AC (Table 4). It is important to emphasize that in this
study the increase in BD did not influence Ma reduction, such as it is usually observed (Silva et al. 2014; Auler et al. 2017). This behavior might be a consequence of biopores formation, influenced by the increase in the earthworm activity or at root growth conditioned by liming (Caires et al. 2008; Joris et al. 2013; Auler et al. 2017). In this case, the biopores formation also might explain those correlations. AC correlations in the 0.10 – 0.20 m layer, between the treatments with plowing and harrowing, only occurred with physical attributes, show that these alterations depend on the soil disturbance (increase in the Ma) and not from liming (Table 4). That result might be explained due to the importance of the macropores for the soil aeration (Silva et al. 2014).
AC values below 0.10 m3·m–3 were not observed for all modes of lime application, with or without liming, in both soil layers (Figure 6). This value is considered as a limiting factor to the crop development. It is important to emphasize that the Control treatment provided increase in AC, in the 0 – 0.10 m layer, when compared to the conditions prior to the experiment installation, although BD increase was also observed (Table 1).
These results were possibly due to the stoloniferous growth habit and the fasciculate root system of the forage
A. catharinensis, considering the short time between the conversion of the area from pasture to agriculture (20 months). This behavior might be the result of biopores formation in the soil through the slow and gradual decomposition of the fasciculate roots and stolons of the forage (Auler et al. 2017). These results reinforce the plant beneficial effects on the soil structural quality.
CONCLUSION
The application of lime after eighteen months affects the soil clay dispersion uniquely when applied on the surface. Surface liming is the better mode of lime application to increase the soil water availability, mainly the water content at the field capacity. These changes are more significant in the 0 – 0.10 m soil layer. Surface liming also reduces the aeration capacity in this layer, but not until critical limits.
Alaoui, A., Caduff, U., Gerke, H. H. and Weingartner, R. (2011).
Preferential flow effects on infiltration and runoff in grassland
and forest soils. Vadose Zone Journal, 10, 367-377. http://dx.doi.
org/10.2136/vzj2010.0076.
Albuquerque, J. A., Bayer, C., Ernani, P. R. and Fontana, E.
C. (2000). Propriedades físicas e eletroquímicas de um
Latossolo Bruno afetadas pela calagem. Revista Brasileira
de Ciência do Solo, 24, 295-300. http://dx.doi.org/10.1590/
S0100-06832000000200006.
Albuquerque, J. A., Bayer, C., Ernani, P. R., Mafra, A. L. and Fontana,
E. C. (2003). Aplicação de calcário e fósforo e estabilidade da
estrutura de um solo ácido. Revista Brasileira de Ciência do Solo, 27,
799-806. http://dx.doi.org/10.1590/S0100-06832003000500004.
Auler, A. C., Pires, L. F., Santos, J. A. B., Caires, E. F., Borges, J. A.
R. and Giarola, N. F. B. (2017). Effects of surface-applied and
soil-incorporated lime on some physical attributes of a Dystrudept
soil. Soil Use and Management. In press. http://dx.doi.org/10.1111/
sum.12330.
Bartlett, M. S. (1937). Properties of sufficiency and statistical
tests. Proceedings of the Royal Society of London, 160, 268-282.
Box, G. E. P. and Cox, D. R. (1964). An analysis of transformations.
Journal of the Royal Statistical Society, 26, 211-252.
Briedis, C., Sá, J. C. M., Caires, E. F., Navarro, J. F., Inagaki, T. M.,
Boer, A., Quadros Neto, C., Ferreira, A. O., Canalli, L. B. and Santos,
J. B. (2012). Soil organic matter pools and carbon-protection
mechanisms in aggregate classes influenced by surface liming in
a no-till system. Geoderma, 170, 80-88. http://dx.doi.org/10.1016/j.
geoderma.2011.10.011.
Bronick, C. J. and Lal, R. (2005). Soil structure and management:
a review. Geoderma, 124, 3-22. http://dx.doi.org/10.1016/
j.geoderma.2004.03.005.
Caires E. F., Alleoni, L. R. F., Cambri, M. A. and Barth, G. (2005).
Surface application of lime for crop grain production under a no-till
system. Agronomy Journal, 97, 791-798. http://dx.doi.org/10.2134/
agronj2004.0207.
Caires, E. F., Barth, G. and Garbuio, F. J. (2006). Lime application
in the establishment of a no-till system for grain crop production
in Southern Brazil. Soil and Tillage Research, 89, 3-12. http://
dx.doi.org/10.1016/j.still.2005.06.006.
REFERENCES
Caires, E. F., Chueiri, W. A., Madruga, E. F. and Figueiredo,
A. (1998). Alterações de características químicas do solo e
resposta da soja ao calcário e gesso aplicado na superfície
em sistema de cultivo sem preparo do solo. Revista Brasileira
de Ciência do Solo, 22, 27-34. http://dx.doi.org/10.1590/
S0100-06831998000100004.
Caires, E. F., Garbuio, F. J., Churka, S., Barth, G. and Corrêa,
J. C. L. (2008). Effects of soil acidity amelioration by surface
liming on no-till corn, soybean, and wheat root growth and
yield. European Journal of Agronomy, 28, 57-64. http://dx.doi.
org/10.1016/j.eja.2007.05.002.
Caires, E. F., Joris, H. A. W. and Churka, S. (2011).
Long-term effects of lime and gypsum additions on no-till corn
and soybean yield and soil chemical properties in southern
Brazil. Soil Use and Management, 27, 45-53. http://dx.doi.org/
10.1111/j.1475-2743.2010.00310.x.
Castro Filho, C. and Logan, T. J. (1991). Liming effects on the
stability and erodibility of some Brazilian Oxisols. Soil Science
Society of American Journal, 55, 1407-1413. http://dx.doi.
org/10.2136/sssaj1991.03615995005500050034x.
Ciotta, M. N., Bayer, C., Ernani P. R., Fontoura, S. M. V., Wobeto,
C. and Albuquerque, J. A. (2004). Manejo da calagem e os
componentes da acidez de Latossolo Bruno em plantio direto.
Revista Brasileira de Ciência do Solo, 28, 317-326. http://dx.doi.
org/10.1590/S0100-06832004000200010.
Dane, J. H., Topp, C. G. and Campbell, G. S. (2002). Methods of
soil analysis: Part 4 - Physical methods. Madison: Soil Science
Society of America.
Dontsova, K. M. and Norton, L. D. (2002). Clay dispersion,
infiltration, and erosion as influenced by exchangeable
Ca a n d M g . S o i l S c i e n ce , 67, 184 -193 . h t t p : / /d x .d o i .
org/10.1097/00010694-200203000-00003.
Fernández-Ugalde, O., Virto, I., Bescansa, P., Imaz, M. J.,
Enrique, A. and Karlen, D. L. (2009). No-tillage improvement
of soil physical quality in calcareous, degradation-prone,
semiarid soils. Soil and Tillage Research, 106, 29-35. http://
dx.doi.org/10.1016/j.still.2009.09.012.
Fisher, R. A. (1966). The design of the experiments. Edinburgh:
Gómez-Paccard, C., Hontoria, C., Mariscal-Sancho, I., Pérez,
J., León, P., González, P. and Espejo, R. (2015). Soil-water
relationships in the upper soil layer in a Mediterranean Palexerult
as affected by no-tillage under excess water conditions —
Influence on crop yield. Soil and Tillage Research, 146,
303-312. http://dx.doi.org/10.1016/j.still.2014.09.012.
Haynes, R. J. and Naidu, R. (1998). Influence of lime,
fertilizer and manure applications on soil organic matter
content and soil physical conditions: a review. Nutrient
Cycling in Agroecosystems, 51, 123-137. http://dx.doi.
org/10.1023/A:1009738307837.
Houlbrooke, D. J. and Laurenson, S. (2013). Effect of sheep
and cattle treading damage on soil microporosity and soil
waterholding capacity. Agricultural Water Management, 121,
81-84. http://dx.doi.org/10.1016/j.agwat.2013.01.010.
Instituto Agronômico do Paraná (2009). Cartas climáticas do
Paraná: classificação climática — segundo Köppen. Londrina:
IAPAR. CD-ROM.
Joris, H. A. W., Caires, E. F., Bini, A. R., Scharr, D. A. and Haliski,
A. (2013). Effects of soil acidity and water stress on corn and
soybean performance under a no-till system. Plant and Soil,
365, 409-424. http://dx.doi.org/10.1007/s11104-012-1413-2.
Joris, H. A. W., Caires, E. F., Scharr, D. A., Bini, A. R. and Haliski,
A. (2016). Liming in the conversion from degraded pastureland
to a no-till cropping system in Southern Brazil. Soil and Tillage
Research, 162, 68-77. http://dx.doi.org/10.1016/j.still.2016.04.009.
Kemper, W. D. and Rosenau, R. C. (1984). Soil cohesion as
affected by time and water content. Soil Science Society of
American Journal, 48, 1001-1006. http://dx.doi.org/10.2136/
sssaj1984.03615995004800050009x.
Kjaergaard, C., Jonge L. W., Moldrup, P. and Schjønning, P.
(2004). Water-dispersible colloids: effects of measurement
method, clay content, initial soil matric potential, and wetting
rate. Vadose Zone Journal, 3, 403-412. http://dx.doi.org/10.2136/
vzj2004.0403.
Libardi, P. L. (2012). Dinâmica da água no solo. São Paulo:
EDUSP.
Oliveira, T. S., Costa, L. M. and Schaefer, C. E. (2005).
Water-dispersible clay after wetting and drying cycles in four Brazilian
Oxisols. Soil and Tillage Research, 83, 260-269. http://dx.doi.
org/10.1016/j.still.2004.08.008.
Pearson, K. and Filon, L. N. G. (1898). Mathematical contributions
to the theory of evolution. IV. On the probable errors of
frequency constants and on the influence of random selection
on variation and correlation. Philosophical Transactions of the
Royal Society of London, 191, 229-311.
Pires, L. F., Bacchi, O. O. S. and Reichardt, K. (2005). Gamma
ray computed tomography to evaluate wetting/drying soil
structure changes. Nuclear Instruments and Methods in
Physics Research, 229, 443-456. http://dx.doi.org/10.1016/
j.nimb.2004.12.118.
Pires, L. F., Bacchi, O. O. S. and Reichardt, K. (2007). Assessment
of soil structure repair due to wetting and drying cycles through
2-D tomographic image analysis. Soil and Tillage Research,
94, 537-545. http://dx.doi.org/10.1016/j.still.2006.10.008.
Pires, L. F., Villanueva, F. C. A., Dias, N. M. P., Bacchi, O. O.
S. and Reichardt, K. (2011). Soil chemical migration during
soil water retention curve evaluation. Anais da Academia
Brasileira de Ciências, 83, 1097-1107. http://dx.doi.org/10.1590/
S0001-37652011005000032.
Quaggio, J. A. (2000). Acidez e calagem em solos tropicais.
Campinas: Instituto Agronômico.
R Core Team (2013). R: A language and environment for statistical
computing. Vienna: R Foundation for Statistical Computing.
Rengasamy, P., Greene, R. S. B. and Ford, G. W. (1986). Influence
of magnesium on aggregate stability in sodic Red-Brown earths.
Australian Journal of Soil Research, 24, 229-237. http://dx.doi.
org/10.1071/SR9860229.
Reynolds, W. D., Drury, C. F., Yang, X. M., Fox, C. A., Tan, C.
S. and Zhang, T. Q. (2007). Land management effects on
the near-surface physical quality of a clay loam soil. Soil
and Tillage Reseach, 96, 316-330. http://dx.doi.org/10.1016/
j.still.2007.07.003.
Roth, C. and Pavan, M. (1991). Effects of lime and gypsum on clay
dispersion and infiltration in samples of a Brazilian Oxisol. Geoderma,
48, 351-361. http://dx.doi.org/10.1016/0016-7061(91)90053-V.
Russel, E. W. (1973). Soil conditions and plant growth. London:
Longman.
Santos, H. G., Jacomine, P. K. T., Anjos, L. H. C., Oliveira, V. A.,
Lumbreras, J. F., Coelho, M. R., Almeida, J. A., Cunha, T. J. F.
and Oliveira, J. B. (2013). Sistema brasileiro de classificação
Shapiro, S. S. and Wilk, M. B. (1965). An analysis of variance test
for normality (complete samples). Biometrika, 52, 591-611.
Silva, F. R., Albuquerque, J. A. and Costa, A. (2014).
Crescimento inicial da cultura da soja em Latossolo Bruno
com diferentes graus de compactação. Revista Brasileira
de Ciência do Solo, 38, 1731-1739. http://dx.doi.org/10.1590/
S0100-06832014000600008.
Soil Survey Staff (2013). Simplified guide to soil taxonomy.
Lincoln: USDA-Natural Resources Conservation Service.
Sparks, D. L. (2003). Environmental soil chemistry. San Diego:
Elsevier.
Spera, S. T., Denardin, J. E., Escosteguy, P. A. V., Santos,
H. P. and Figueroa, E. A. (2008). Dispersão de argila em
microagregados de solo incubado com calcário. Revista
Brasileira de Ciência do Solo, 32, 2613-2620. http://dx.doi.
org/10.1590/S0100-06832008000700002.
Tukey, J. W. (1959). A quick, compact, two-sample test to
Duckworth’s specifications. Technometrics, 1, 31-48.
Van Raij, B., Andrade, J. C., Cantarella, H. and Quaggio, J. A.
(2001). Análise química para avaliação da fertilidade de solos
tropicais. Campinas: IAC.
Von Uexküll, H. R. and Mutert, E. (1995). Global extent,
development and economic impact of acid soils. Plant and
Soil, 171:1-15. http://dx.doi.org/10.1007/BF00009558.
Westerhof, R., Buurman, P., van Griethuysen, C., Ayarza, M.,
Vilela, L. and Zech, W. (1999). Aggregation studied by laser
diffraction in relation to plowing and liming in the Cerrado region
in Brazil. Geoderma, 90, 277-290. http://dx.doi.org/10.1016/