http://www.uem.br/acta ISSN printed: 1806-2636 ISSN on-line: 1807-8672
Doi: 10.4025/actascianimsci.v36i3.22912
Tiller dynamics of ryegrass managed under two stocking rates
Sheila Cristina Bosco Stivanin1, Marta Gomes da Rocha2*, Luciana Potter2, Viviane da Silva Hampel1, Marcos Bernardino Alves1 and Paulo Roberto Salvador1
1
Programa de Pós-graduação em Zootecnia, Universidade Federal de Santa Maria, Santa Maria, Rio Grande do Sul, Brazil. 2Departamento de Zootecnia, Centro de Ciências Rurais, Universidade Federal de Santa Maria, Avenida Roraima, 1000, 97105-900, Cidade Universitária, Bairro Camobi, Santa Maria, Rio Grande do Sul, Brazil. *Author for correspondence. E-mail: [email protected]
ABSTRACT. This study investigated the tiller dynamics of Italian ryegrass (Lolium multiflorum Lam) under low and high stocking rates. These rates were determined by heifers exclusively on pasture or grazing and supplemented with oats and corn grain. The experimental design was completely randomized with repeated measurements over time, with two stocking rates, three and six replications of area for low and high stocking rates, respectively. The appearance rate (1.0 tillers tiller-1 m-2), survival rate (0.8 tillers
tiller-1 m-2), population stability index (1.6) and site occupation (0.3) were similar for high and low stocking
rates. The tiller density was similar for different stocking rates. The first generation of tillers was 56% of the tiller population at end of the ryegrass cycle. The increase by 22.5% in the stocking rate derived from the use of supplements for grazing heifers did not alter the tiller dynamics of ryegrass.
Keywords: population stability index, site occupation, tiller survival, tiller appearance rate.
Dinâmica de perfilhamento de azevém manejado sob duas taxas de lotação
RESUMO. Foi avaliada a dinâmica de perfilhamento de azevém (Lolium multiflorum Lam), sob duas taxas de lotação: ‘baixa’ e ‘alta’. Essas taxas foram determinadas por bezerras, exclusivamente, em pastejo ou em pastejo e recebendo grão de milho ou de aveia branca como suplemento. O delineamento experimental foi inteiramente casualizado, com medidas repetidas no tempo, com duas taxas de lotação, três e seis repetições de área para a taxa de lotação ‘baixa’ e ‘alta’, respectivamente. A taxa de aparecimento (1,0 perfilhos perfilho-1 m-2),
sobrevivência de perfilhos (0,8 perfilhos perfilho-1 m-2), o índice de estabilidade da população (1,6) e a
ocupação de sítios (0,3) foram similares nas taxas de lotação ‘alta’ e ‘baixa’. A densidade populacional de perfilhos foi similar nas diferentes taxas de lotação. A primeira geração de perfilhos representa 56% dos perfilhos existentes no final do ciclo do azevém. O aumento de 22,5% na taxa de lotação ocasionado pelo uso de suplementos para bezerras em pastejo não altera a dinâmica de perfilhamento do azevém.
Palavras-chave: índice de estabilidade da população, ocupação de sítios, sobrevivência de perfilhos, taxa de aparecimento de perfilhos.
Introduction
The persistence of forage grasses is related to the ongoing appearance of tillers from axillary buds in the sheath of each leaf blade in older stems. Studies on demographic patterns of tillering have enabled significant improvements in the productivity of grazing systems through fine-tuning of management (MATTHEW et at., 2000).
The manipulation of defoliation by adjustments and combinations of frequency and intensity of grazing can generate different responses in accumulation and nutritive value of forage produced, promoting variations in leaf area from changes in demographic patterns of tillering (DIFANTE et al., 2008). Tillering is a genetically determined trait. Environmental growth factors such as rainfall, temperature, light and nutrient availability combined with the strategies of
defoliation can alter the tiller turnover in the canopy (MATTHEW et al., 2000).
The supplementation of grazing animals allows an increase the stocking rate by 20% (PÖTTER et al., 2010). Changes in stocking rate directly influence the intensity and frequency of defoliation of forages, which may modify the dynamics of tillering, mainly due to changes in the quantity and quality of light that reaches the base of the tiller. Leaf blades near the soil of plants with improved quality of incident solar radiation, activate their dormant buds (ZANINI et al., 2012), positively influencing tillering (ZANINE, 2005).
CONFORTIN et al., 2009; ROSO et al., 2009; ROSA et al., 2013). Tiller dynamics is extensively studied with tropical species (DIFANTE et al., 2008; FIALHO et al., 2012; ZANINE et al., 2013). Unlike, studies of this nature are lacking for Italian ryegrass (BARTH NETO et al., 2013). There is no literature published on the tillering of this species in pastures under higher stocking rate as a function of the use of supplements. In this way, this study aimed to evaluate the tiller dynamics of Italian ryegrass grazed with two stocking rates, low and high, of beef heifers exclusively on pasture or grazing and supplemented with corn grain or oat grain.
Material and methods
This experiment was developed from July to November 2012, in the Department of Animal Sciences, Federal University of Santa Maria, in the Central Depression of Rio Grande do Sul State. The climate is humid subtropical, according to the Köppen classification. The soil is classified as paleudalf (EMBRAPA, 2006). Data of soil chemical analysis of the experimental area were: pH-H2O:
5.8; % clay: 18 m/v; K: 85.6 mg dm-3; % OM: 2.7
m/v; Al: 0.07 cmol dm-3; Ca: 5.3 cmol dm-3; P: 15.8
mg dm-3; Mg: 2.6 cmol dm-3; CEC pH 7: 8.2.
The experimental area was 7.2 hectares divided into nine paddocks. Italian ryegrass (Lolium multiflorum
Lam.) pasture was planted on May 2012. The fertilization consisted of applying 200 kg ha-1 NPK
(05-20-20). As topdressing, urea (56.5 kg nitrogen) was applied in two applications (6/21 and 7/14/2012).
Italian ryegrass tiller dynamics was evaluated with two stocking rates: low – beef heifers exclusively on ryegrass pasture, and high – beef heifers on ryegrass pasture plus 0.93% body weight (BW) of corn grain (9.9% crude protein, CP, 91.4% dry matter, DM, 5.6% mineral matter, MM, and 21.7% neutral detergent fiber, NDF), or oats grain (13.8% CP, 91.5% DM, 9.7% MM and 31.1% NDF) as supplement. Supplements were given from Monday to Saturday, at 14 hours.
Grazing was continuous with variable number of animals for maintaining the forage mass between 1,500 and 2,000 kg DM ha-1. The stocking rate was adjusted
in the beginning of each experimental period, according to Heringer and Carvalho (2002). Evaluation periods comprised the dates from 7/9 to 7/30; 7/31 to 8/28; 8/29 to 9/26 and 9/27 to 10/17. Experimental animals were Angus heifers, with initial age and weight of eight months and 168.6 ± 5 kg, respectively. Three test animals were used for each experimental unit.
Forage mass (kg DM ha-1) was determined by
visual estimation with double sampling. The stocking rate (kg BW ha-1) was calculated by
summing the average weight of test animals, with the average weight of each regulator animal multiplied by the number of days in which it remained in the paddock, divided by the number of days of the experimental period.
In order to evaluate the tiller population dynamics, three PVC rings (10 cm diameter 0.0078 m2) were fixed to the ground of each experimental
unit. The first generation of tillers was marked before starting the first evaluation period (7/2/2012), when all ryegrass tillers in the area were marked with plastic wires of a single color. At the end of the first evaluation period (7/30/2012), living tillers marked in the first generation were counted again and the new generation of tillers was marked with plastic wires of a different color. New generations of tillers were marked until the final period of use of ryegrass, and the tillers belonging to all generations marked were always recounted at each new evaluation. With the sum of the number of tillers belonging to each generation, it was possible to calculate the tiller density (tillers m-2).
The tiller appearance rate (TAR; tillers tiller-1 m-2
or %), in each experimental period was obtained from counting the new tillers developed between two successive evaluations. The survival rate (ST; tillers tiller -1 m-2 or %) of each generation of tillers
was estimated by the difference between the population existing in the period and the population existing in the prior period. The stability index (SI) of the tiller population was calculated by the equation:
SI = ST x (1+TAR)
Occupation of sites (OS) was calculated using the following equation: OS = (TAR/100)/(28 x LAR x
average temperature).
which is considered the base temperature of growth of ryegrass.
The experimental design was completely randomized with repeated measures over time, two stocking rates, with three and six replicates of area for low and high stocking rates, respectively. All variables were normally distributed. To compare stocking rates, the variables were evaluated considering the fixed effect of stocking rate, evaluation periods and their interactions and the random effects of the residue and nested paddocks in stocking rates, using the MIXED procedure of SAS 8.2. The structure selection test was run using the Bayesian information criterion (LITTELL et al., 1998) to determine the model that best fits the data. When differences were detected, the mean values between stocking rates and evaluation periods were compared using the lsmeans procedure. The interaction of stocking rates with evaluation periods was broken down when significant at 5% probability. The variables were also subjected to Pearson correlation analysis.
Results and discussion
Meteorological data for July, September and October showed that the average temperature (17.4°C) is similar to historical averages, while for August, the temperature was 23.9% higher than the historical average (15.3°C). The average rainfall for July and August was 72.4 mm, 1.97 times lower than the historical average for the same period. The months of September and October were the rainiest with 21.4 and 49.3% above historical averages, 139.5 and 114.3 mm, respectively.
In the high stocking rate, the use of corn grain or oats grain as supplement for heifers on ryegrass pasture resulted in a stocking rate of 1434.6 kg BW ha-1, an
increase (p < 0.05) of 22.5% in relation to the low stocking rate obtained exclusively on pasture (1111.8 kg BW ha-1). The increased density of animals increases
the probability of defoliation, reducing the leaf area index, which is the key variable for tiller density. With reduced leaf area index, the lighting condition at the base of the canopy improves and reduces competition for light, which is one of the most influential factors on tillering (SBRISSIA; SILVA, 2008).
The increased stocking rate achieved by using supplements was not enough to change the sward structure. Leaf blades of the Italian ryegrass showed a similar length (p > 0.05) between the different stocking rates (14.3 ± 0.5 cm), as well as the number of green leaf blades (4.2 ± 0.07) and density (6,170 ± 311 tillers m-2). This similar sward structure indicates the
replacement of dry matter intake in the high stocking rate, which occurs when an animal refuses a significant
amount of the pasture available when given supplement. According to Roche et al. (2008), this behavior may occur because in animals receiving supplement, the point of satiety can be signaled by metabolic chemical factors like leptin circulating in the bloodstream, which seems to be associated with the appetite control of ruminants, leading heifers fed supplement to reduce the pasture intake. Rosa et al. (2013) investigated the intake of beef heifers on ryegrass pasture and receiving supplement, and observed that the consumption of pasture of animals fed corn grain as supplement was 10% lower in comparison with animals exclusively on ryegrass pasture. The possible reduction in the pasture intake by heifers under high stocking rate may have compensated the high stocking rate, allowing a similar structure of the sward between low and high stocking rates.
No interaction was found between stocking rate and evaluation periods for the appearance rate, mortality and survival of tillers, population stability index and occupation of sites (p > 0.05). The stocking rate 22.5% higher, resulting from the use of supplements, had not (p > 0.05) influenced the tiller appearance rate (1.0 ± 0.05 tillers tiller-1 m-2),
population stability index (0.8 ± 0.03 tillers tiller-1 m-2),
and occupation of sites (0.3 ± 0.001). The similar structure of canopy in the high and low stocking rates provided a similar light intensity reaching the base of the canopy, keeping unchanged the condition of competition for light, thus justifying the data obtained.
In the last evaluation period, at the reproductive stage of ryegrass, the tiller appearance rate was 0.8 tillers tiller-1 m-2 (Table 1), 28.9% lower (p < 0.05)
than in the other periods (1.1 tillers tiller-1 m-2). This
rate was positively related to the number of green leaf blades (p = 0.0007; r = 0.56). As each leaf blade has a phytomer, which when photostimulated may originate a new tiller (MATTEW et al., 2000), the reduction in the tiller appearance rate is justified by the alteration in the number of green leaf blades, from 4.4 in the three initial periods of pasture use to 3.6 in the fourth period (p < 0.05; Table 1).
Table 1. Tiller dynamics, number of green leaf blades, leaf blade length, leaf appearance rate according to the evaluation periods of ryegrass.
Evaluation periods
Items 7/9 to
7/30 7/31 to
8/28 8/29 to
9/26 9/27 to
10/17 p*
Tiller appearance rate1 1.2a 1.2a 1.0a 0.8b 0.0009 Tiller survival rate1 0.9a 0.9a 0.7b 0.7b 0.0017 Population stability index 1.9a 1.9a 1.5b 1.3b 0.0006 Site occupation 0.4a 0.3b 0.3b 0.3b 0.0037 Number of green leaf blades 4.4a 4.3a 4.4a 3.6b < 0.0001 Leaf blade length2 19.1a 15.0b 12.4c 10.8c < 0.0001 Leaf appearance rate3 0.009a 0.007b 0.008b 0.006c < 0.0001
The tillers showed a survival 22% lower (p < 0.05; Table 1), in the third and fourth evaluation periods, compared with the other periods (0.7 tillers tiller-1
m-2 × 0.9 tillers tiller-1 m-2). The tiller survival rate
was positively related to the length of leaf blades (p = 0.0003; r = 0.58), which averaged 11.6 cm in the third and fourth periods, 39.3% lower (Table 1; p < 0.05) than the first period (19.1 cm) and 22.7% lower (Table 1; p < 0.05) than the second period (15.0 cm). In this case, as the blades were smaller there was an increased probability of removal of the apical meristem by grazing heifers, which explain the results for tiller survival.
The site occupation in the meristematic zones was altered (p < 0.05) by the evaluation periods. In the first period, the occupation was 0.4, 25% higher than in the other periods, whose was 0.3, on average (Table 1). This highest value can be attributed to the higher number of potential buds due to the 22% higher leaf appearance in the first period (Table 1).
Values of the appearance and survival rates combined resulted in significant variations (p < 0.05) in the population stability index of Italian ryegrass plants, which was 1.4, 31.6% lower (p < 0.05) in the last two periods of evaluation, which was 1.9 (Table 1). In these periods, even at the pre-flowering stage of ryegrass, the tiller appearance exceeded mortality, allowing the maintenance of values of the population stability index above one (Table 1), which indicates an upward trend in the tiller population (BAHAMANI et al., 2003). This trend points out that even at the end of the cycle, ryegrass is able to maintain stable the population of tillers. According to Barth Neto et al. (2013), this indicates the appropriate pasture management during the phenological cycle.
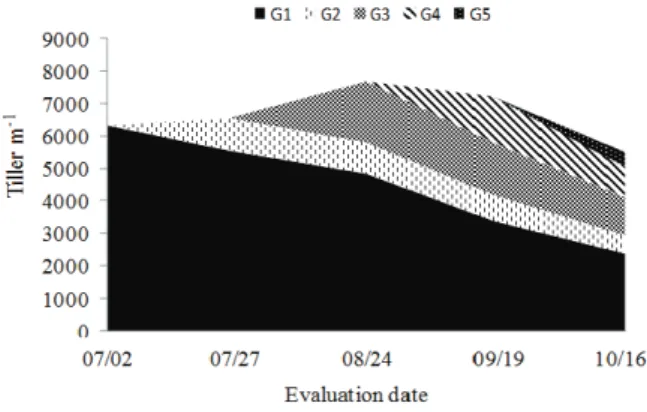
On the basis of the tiller population pattern (Figure 1), the stability was kept by a continuous tillering along the pasture use. This enabled the canopy to support a similar population density (p > 0.05) along the growth stage of ryegrass (6,170 ± 311 tillers m-2). Moreover, the continuous
tillering promotes a high turnover rate of tissues, contributing to the maintenance of young plants in the pasture (SBRISSIA et al., 2010).
Analyzing separately the density for each tiller generation (Figure 1), the first generation has greater longevity (p < 0.05), with 56% of total of tillers in October. In this way, a proper management during the establishment of the pasture is essential for a successful system of animal production on pasture.
Young tillers have a higher photosynthetic capacity, high rates of appearance and expansion of leaf blades, accounting for canopies with a greater number of green leaves, and hence high quality
forage (BARBOSA et al., 2012). Therewith, management strategies to be prioritized should be those allowing the constant appearance of new generations of tillers along the pasture use, even if these generations represent smaller proportions in the total number of tillers (p < 0.005; Figure 1).
Figure 1. Demographic pattern and sum of ryegrass tillers in the period July-October 2012. Generation of tillers and evaluation date: G1 – 7/2/2012; G2 – 7/27/2012; G3 – 8/24/2012; G4 – 9/19/2012 and G5 – 10/16/2012.
Conclusion
The increase of 22.5% in the stocking rate resulting from the supplementation of for grazing heifers has no effect on the tillering dynamics of ryegrass. The tiller appearance rate is lower in the reproductive stage, while the number of sites occupied by tillers is higher at the beginning of their occupation. Tillers survive for a shorter time after approaching the reproductive stage. Proper management allows the stabilization of the ryegrass population throughout its phenological cycle. The first generation of tillers contributes 56% at the end of the cycle, emphasizing the management practices at the beginning of use of this forage.
References
BAHMANI, I.; THOM, E. R.; MATTHEW, C.; HOOPER, R. J.; LEMAIRE, G. Tiller dynamics of perennial ryegrass cultivars derived from different New Zealand ecotypes: effects of cultivar, season, nitrogen fertilizer, and irrigation. Australian Journal of Agricultural Research, v. 54, n. 8, p. 803‑817, 2003. BARBOSA, R. A.; NASCIMENTO JR., D.; VILELA, H. H.; SOUSA, B. M. L.; SILVA, S. C.; EUCLIDES, V. P. B.; SILVEIRA, M. C. T. Morphogenetic and structural characteristics of guinea grass tillers at different ages under intermittent stocking. Revista Brasileira de Zootecnia, v. 41, n. 7, p. 1583-1588, 2012.
de azevém em sucessão a soja ou milho, sob diferentes métodos e intensidades de pastejo. Pesquisa Agropecuária Brasileira, v. 48, n. 3, p. 329-338, 2013. CONFORTIN, A. C. C.; QUADROS, F. L. F.; ROCHA, M. G.; KUINCHTNER, B. C.; GLIENKE, C. L.; CAMARGO, D. G.; MACHADO, J. M. Fluxo de tecido foliar em azevém anual manejado sob três intensidades de pastejo. Ciência Rural, v. 39, n. 4, p. 1193-1199, 2009.
DIFANTE, J. S.; NASCIMENTO JR., D.; SILVA, S. C.; EUCLIDES, V. P. B.; ZANINE, A. M.; ADESE, B. Dinâmica do perfilhamento do capim-marandu cultivado em duas alturas e três intervalos de corte. Revista Brasileira de Zootecnia, v. 37, n. 2, p. 189-196, 2008. EMBRAPA-Empresa Brasileira de Pesquisa Agropecuária. Centro Nacional e Pesquisa em Solos. Sistema Brasileiro de Classificação de Solos. Brasília: Embrapa SPI; Rio de Janeiro: Embrapa Solos, 2006.
FIALHO, C. A.; SILVA, S. C.; GIMENES, F. M. A.; GOMES, M. B.; BERNDT, A.; GERDES, L. Tiller population density and tillering dynamics in marandu palisade grass subjected to strategies of rotational stocking management and nitrogen fertilization. Acta Scientiarum. Animal Sciences, v. 34, n. 3, p. 245-251, 2012.
HERINGER, I.; CARVALHO, P. C. F. Ajuste da carga animal em experimentos de pastejo: uma nova proposta.
Ciência Rural, v. 32, n. 4, p. 675-679, 2002.
LITTELL, R. C.; HENRY, P. R.; AMMERMAN, C. B. Statistical analysis of repeated measures data using SAS procedures. Journal of Animal Science, v. 76, n. 4, p. 1216-1231, 1998.
MATTHEW, C.; ASSUERO, S. G.; BLACK, C. K. Tiller dynamics of grazed 7 swards. In: LEMAIRE, G.; HODGSON, J.; MORAES, A.; CARVALHO, P. C. F.; NABINGER, C. (Ed.). Grassland ecophysiology and grazing ecology. Wallingford: CABI publishing, 2000. Chap. 7, p. 127-150.
POTTER, L.; ROCHA, M. G.; ROSO, D.; COSTA, V. G.; GLIENKE, C. L.; ROSA, A. N. Suplementação com concentrado para novilhas de corte mantidas em pastagens cultivadas de estação fria. Revista Brasileira de Zootecnia, v. 39, n. 5, p. 992-1001, 2010.
ROCHE, J. R.; BLACHE, D.; KAY, J. K.; MILLER, D. R.; SHEAHAN, A. J.; MILLER, D. W. Neuroendocrine and physiological regulation of intake with particular reference to domesticated ruminant animals. Nutrition Research Reviews, v. 21, n. 2, p. 207-234, 2008.
ROMAN, J.; ROCHA, M. G.; PIRES, C. C.; ELEJALDE, D. A. G.; KLOSS, M. G.; OLIVEIRA NETO, R. A. Comportamento ingestivo e desempenho de ovinos em pastagem de azevém anual (Lolium multiflorum Lam.) com diferentes massas de forragem. Revista Brasileira de Zootecnia, v. 36, n. 4, p. 780-788, 2007.
ROSA, A. T. N.; ROCHA, M. G.; POTTER, L.; KOSLOSKI, G. V.; ROSO, D.; OLIVEIRA NETO, R. A. Consumo de forragem e desempenho de novilhas de corte recebendo suplementos em pastagem de azevém. Ciência Rural, v. 43, n. 1, p. 126-131, 2013.
ROSO, D.; ROCHA, M. G.; POTTER, L.; GLIENKE, C. L.; COSTA, V. G.; ILHA, G. F. Recria de bezerras de corte em alternativas de uso da pastagem de azevém. Revista Brasileira de Zootecnia, v. 38, n. 2, p. 240-248, 2009. SBRISSIA, A. F.; SILVA, S. C. Compensação tamanho/densidade populacional de perfilhos em pastos de capim-marandu. Revista Brasileira de Zootecnia, v. 37, n. 1, p. 35-47, 2008.
SBRISSIA, A. F.; SILVA, S. C.; SARMENTO, D. O. L.; MOLAN, L. K.; ANDRADE, F. M. E.; GONÇALVES, A. C.; LUPINACCI, A. V. Tillering dynamics in palisadegrass swards continuously stocked by cattle. Plant Ecology, v. 206, n. 2, p. 349-359, 2010.
ZANINE, A. M. Resposta morfofisiológica em pasto sob pastejo. Colloquium Agrariae, v. 1, n. 2, p. 50-59, 2005. ZANINE, A. M.; NASCIMENTO JR., D.; SOUSA, B. M. L.; SILVEIRA, M. C. T.; SILVA, W. L.; SANTOS, M. E. R. Tillering dynamics in Guinea grass pastures subjected to management strategies under rotational grazing. Revista Brasileira de Zootecnia, v. 42, n. 3, p. 155-161, 2013.
ZANINI, G. D; SANTOS-TREVISAN, G. S.; SBRISSIA, A. F. Frequencies and intensities of defoliation in Aruana guineagrass swards: morphogenetic and structural characteristics. Revista Brasileira de Zootecnia, v. 41, n. 8, p. 1848-1857, 2012.
Received on February 1, 2014. Accepted on March 25, 2014.