http://www.uem.br/acta ISSN printed: 1806-2636 ISSN on-line: 1807-8672
Doi: 10.4025/actascianimsci.v35i1.11801
Signal grass structure at different sites of the same pasture under
three grazing intensities
Manoel Eduardo Rozalino Santos1*, Dilermando Miranda da Fonseca2, Virgilio Mesquita Gomes2,
Roberson Machado Pimentel2, Ronan Lopes Albino2 and Simone Pedro da Silva2
1
Colegiado de Zootecnia, Universidade Federal do Vale do São Francisco, Rod. BR-407, km 12, Lote 543, Projeto de Irrigação Senador Nilo Coelho, s/n., 56300-300, Petrolina, Pernambuco, Brazil. 2Departamento de Zootecnia, Universidade Federal de Viçosa, Viçosa, Minas Gerais, Brazil. *Author for correspondence. E-mail: manoel.rozalino@univasf.edu.br
ABSTRACT. The experiment was conducted to evaluate Brachiaria decumbens cv. Basilisk at different sites of the
same pasture featuring varying grazing intensities (under grazed, properly grazed and overgrazed). The pasture was managed under continuous stocking using 200-kg cattle and grass height kept at about 25 cm. The randomized block design was used, with three replications. Sward height (38.0 cm) and extended plant height (85.2 cm) were greater at the under grazed site. The falling index was lower at the properly grazed site (1.28). At the under grazed site, the masses of green leaf blade (3442 kg ha-1 DM), green stem (8370 kg ha-1 DM), green
forage (11812 kg ha-1 DM) and total forage (14137 kg ha-1 DM) were higher when compared to the overgrazed
and properly grazed sites. Dead material mass was higher at the properly grazed (3422 kg ha-1 DM) and under
grazed (2324 kg ha-1 DM) sites. At the under grazed sites, there was a higher occurrence of tillers taller than
40 cm. Tillers with sizes between 10 and 30 cm predominated in properly grazed sites. In overgrazed site there was a higher share of tillers with sizes smaller than 20 cm. There is spatial variability of vegetation in the same pasture of Brachiaria decumbens cv. Basilisk due to uneven grazing by cattle.
Keywords: Brachiaria decumbens, morphological composition, falling index, continuous stocking, tiller size.
Estrutura do capim-braquiária
em locais de um mesmo pasto com três intensidades de pastejo
RESUMO. Objetivou-se avaliar a estrutura da Brachiaria decumbens cv. Basilisk em locais do mesmo pasto com intensidades de pastejo variáveis (subpastejado, pastejo adequado e sobrepastejado). Os pastos foram manejados com bovinos de 200 kg sob lotação contínua e taxa de lotação variável para manter sua altura em 25 cm. O delineamento em blocos ao acaso, com três repetições, foi utilizado. As alturas do pasto (38,0 cm) e da planta estendida (85,2 cm) foram maiores no local subpastejado. O índice de tombamento foi menor no local com pastejo adequado (1,28). No local subpastejado, as massas de lâmina foliar verde (3442 kg ha-1 de MS), colmo
verde (8370 kg ha-1 de MS), forragem verde (11812 kg ha-1 de MS) e forragem total (14137 kg ha-1 de MS) foram
maiores quando comparada aos locais sobrepastejado e com pastejo adequado. A massa de material morto foi maior nos locais com pastejo adequado (3422 kg ha-1 de MS) e com subpastejo (2324 kg ha-1 de MS). Nos locais
com subpastejo houve maior ocorrência de perfilhos com mais de 40 cm. Nos locais com pastejo adequado predominaram perfilhos de 10 a 30 cm. No local sobrepastejado, houve maior participação de perfilhos com menos de 20 cm. Existe variabilidade espacial da vegetação no pasto de B. decumbens cv. Basilisk devido à desuniformidade de pastejo exercida pelos bovinos.
Palavras-chave:Brachiaria decumbens, composição morfológica, índice de tombamento, lotação contínua, tamanho do perfilho.
Introduction
Sward structure is the distribution and spatial arrangement of the aerial part components of plants within a community and can be characterized by the mass and volumetric density of forage, sward height and tiller size. This structure conditions the response of plants and animals under grazing, and has thus been characterized and used to guide grazing management using tropical forage grasses (CARNEVALLI et al., 2006).
Nevertheless, characterizing sward structure accurately and in detail is a complex task, due to natural variability caused by selective defoliation from animals, as well as the varying supply conditions of trophic resources in the horizontal sward plane of pasture, such as soil fertility and water availability.
evolutionary adaptations of cattle that give them advantages in nature (McNAUGHTON, 1984), but which result in under-and/or overgrazed sites in the same sward.
The inherent spatial variation of vegetation in the horizontal plane of pasture is known as horizontal sward structure, and has been little evaluated in experiments with grazing animals (SANTOS et al., 2011a and b). In most research studies the quantification of the descriptive characteristics of sward structure has taken place only at sward sites that represent average conditions. Therefore, locations in the same sward with any factor causing heterogeneity – such as unevenness in cattle grazing – are discarded from the studies, which in turn makes it so sward structural characteristics at those sites are not evaluated and therefore remain unknown.
The objective of this work was to quantify the structural characteristics of Brachiaria decumbens cv. Basilisk, managed under continuous stocking with cattle, at sites of the same sward under different grazing intensities.
Material and methods
The experiment was carried out October 2008 and January 2009, in the Forage Sector of the Animal Science Department of the Federal University of Viçosa, Minas Gerais State, Brazil, at an area of Brachiaria decumbens cv. Basilisk (Stapf.) pasture established in 1997. The experimental area consisted of three paddocks (replications) with approximately 0.30 ha each, in addition to a spare area. The soil in the experimental area is a clayish Red-Yellow Latosol. Chemical analysis of the soil, performed 0-20 cm deep at the start of the experimental period, showed the following results: pH in H2O: 4.79; P: 1.5 (Mehlich-1) and K: 86 mg
dm-3; Ca2+: 1.46; Mg2+: 0.32 and Al3+: 0.19 cmol c
dm-3 (KCl 1 mol L-1). The entire experimental area
was fertilized on November 11 and December 15, 2008, with two 50 kg ha-1 applications of N and K
2O
using formula 20-5-20.
During the evaluation period, climate data were recorded at a weather station located 500 m from the experimental area (Table 1).
Table 1. Monthly averages for mean daily temperature, sunshine, total rainfall and total evaporation between October 2008 and January 2009.
Month Average air temperature (°C)
Sunshine (hours day-1
)
Rainfall (mm)
Evaporation (mm)
October 21.6 5.6 41.4 89.0
November 22.0 3.7 223.8 65.8
December 21.3 11.1 626.0 270.8
January 22.5 13.2 250.7 137.0
Starting in October 2008, the paddocks were managed under continuous stocking with cattle, with varying stocking rates in order to maintain mean sward height around 25 cm. To that end, sward height was monitored twice a week and crossbred growing bulls were used in the experiment, averaging 200 kg.
Between November 2008 and January 2009, the study evaluated the characteristics of signal grass at sites of the same sward with different grazing intensities. The treatments consisted of three sites in the same signal grass sward, evaluated using a randomized blocks design with three replications. The evaluated locations in the sward were:
Under grazed: site in which the sward was at least twice as tall as average height, indicating the occurrence of lenient grazing;
Adequate: site in which the sward averaged 25 cm in height, as recommended by Santos et al. (2011a).
Overgrazed: sward site in which grass measured less than 50% of average height, indicating the occurrence of severe grazing.
In each paddock, sward height, extended plant height and falling index of plants were measured at all three evaluated sites (under grazed, adequate and overgrazed). To that end, a graduated ruler was used according to the methodology proposed by Santos et al. (2009b), choosing five points for measurement at each sward site.
The mass of total forage and its morphological components were estimated by cut harvesting, close to the ground, of all tillers within a 0.16 m2 square,
at three points representative of each sward site (under grazed, adequate and overgrazed) per paddock. Each sample was placed in a labeled plastic bag, then weighed and divided into two parts in the laboratory. One of the subsamples was weighed, stored in a paper bag and placed in a forced-air oven at 65oC for 72 hours, after which it was weighed
again. The other subsample was divided into green leaf blade (GLB), green stem (GS) and dead material (DM). The inflorescence and green leaf sheath were included in the GS fraction. The part of the leaf blade with no signs of senescence was included in the GLB fraction. Senescent and dead parts of the stem and leaf blade were included in the DM fraction. After separation, the signal grass plant components were weighed and dried in a forced-air oven at 65oC for 72 hours. The sum of the masses of
green leaf blade and green stem represented the mass of green forage.
paddock, with two samples from each site evaluated in the same sward. All tillers within a square measuring 0.25 m on each side were harvested at ground level. These tillers were stored in plastic bags and then taken to the laboratory, where they were classified and quantified. Live tillers (vegetative or reproductive) were separated and grouped according to size: 0-10; 10-20; 20-30; 30-40; 40-50; 50-60; and over 60 cm. Later, all tiller categories were counted, with the results expressed as percentages.
Experimental data were analyzed using SAEG software, version 8.1 (UFV, 2003). Analysis of variance was carried out, and the different sites within the same sward were later compared using the Dms test at 5% probability of a type I error. The simple correlation coefficients between certain variables were estimated and the values were tested using the t-test at up to 10% probability.
Results and discussion
The signal grass sward was tallest (p < 0.05) at the under grazed pasture site. Conversely, height was lowest (p < 0.05) at the overgrazed location. Sites on the same sward with adequate grazing showed intermediate height (Table 2). This response pattern was also observed for extended plant height; values were obtained in decreasing order at under grazed, adequately grazed and overgrazed sites (Table 2).
Table 2. Sward height, extended plant height and falling index of signal grass managed under continuous stocking with cattle.
Characteristic Sward site Sward height
(cm)
Extended plant
height (cm) Falling index Under grazed 38a 85.2a 2.25a
Adequate 25b 32.1b 1.28b
Overgrazed 6.2c 12.6c 2.04a
Means followed by the same letter in a column do not differ according to the Dms test (p < 0.05).
Overgrazing results in more frequent and/or intense defoliation of forage plants, which causes reversible morphological changes in plants - a process known as phenotypic plasticity (SANTOS et al., 2011b). This modification in the morphology of overgrazed plants reduces the likelihood of future defoliation and may guarantee perenniality in pasture. One of the mechanisms of phenotypic plasticity of forage plants consists in reducing tiller size while increasing the number of tillers under more intense grazing situations (SBRISSIA; DA SILVA, 2008). Therefore, it is natural that overgrazed sites show shorter sward and extended plant height (Table 2).
Contrariwise, in under grazed locations defoliation is more lenient, resulting in
uninterrupted growth for several tillers, which grow taller and consequently result in greater sward and extended plant height (Table 2). In fact, under grazed tillers develop from the vegetative to reproductive stage; the typical lengthening of the stem occurs during that process (SANTOS et al., 2009a), which contributes to increased sward and extended plant height.
With regard to the falling index, its highest values occurred (p < 0.05) at under grazed and overgrazed sites, while locations with adequate defoliation had lower (p < 0.05) falling index (Table 2). The high falling index at under grazed sites was expected, and was due to the increased growth of signal grass tillers, which predispose those plants to fall, given their thin and flexible stem. The same response pattern was also observed in pastures of
B. decumbens under long periods of deferment
(SANTOS et al., 2009b). Nevertheless, the increased falling index at the overgrazed sites in the same sward had another cause. Under that condition, more intense/frequent defoliation resulted in greater incidence of light at the base of plants; without competition for light, signal grass tillers altered their morphology, showing prostrate growth more parallel to ground level, evidencing the plastic ability of signal grass to change its morphology as a result of changes in environmental conditions. Thus, when prostrate tillers were extended, extended plant height became about twice as tall as sward height, resulting in higher falling index at that sward site.
It should therefore be highlighted that tillers did not fall at the overgrazed site, as an increase in falling index normally indicates. What happened was a change in sward development pattern. In that regard, it is inferred that the falling index, in addition to being used to characterize fallen tillers in pastures at greater development stages, can also be used to characterize and quantify sward growth pattern. To that effect, a higher falling index reflects a more horizontal or prostrate growth of pasture, whereas a decrease to a value near a unit indicates that the sward is growing vertically.
The falling index was lowest at pasture sites in which the sward was about 25 cm tall, which indicates that grazing was adequate there, as forage loss from fallen tillers was avoided - a common phenomenon at under grazed sites. Moreover, adequate conditions were also guaranteed for the growth of forage species, thus avoiding possible future degradation as occurs at constantly overgrazed sites.
blade mass at the under grazed site was greater (p < 0.05) when compared to overgrazed and adequately grazed sites. Also, a similar response pattern was observed for the masses of green stem, green forage and total forage (Table 3). At under grazed sites of the signal grass sward, the frequency and/or intensity of defoliation was probably lower, which resulted in greater pasture development and larger green forage and total forage mass.
Table 3. Mass of forage and its morphological components at sites of the signal grass sward managed under continuous stocking with cattle.
Forage mass (kg ha-1 of dry matter)
Sward site Green leaf blade
Green stem
Dead material
Green forage
Total forage Under grazed 3.442a 8.370a 2.324ab 11.812a 14.137a Adequate 1.414b 2.626b 3.422a 4.039b 7.461b Overgrazed 744c 912c 1.379b 1.656c 3.035c
Means followed by the same letter in a column do not differ according to the Dms test (p < 0.05).
With the more developed pasture at the under grazed site, it is also likely that there was greater competition for light among tillers; as a morphological response, tiller stems were lengthened (CARNEVALLI et al., 2006). Additionally, it is possible that several tillers located in the under grazed sites of the sward developed up to the reproductive stage, in which lengthening of the pseudostem is common. These phenomena explain the increased green stem mass at the under grazed site of the same sward as opposed to the adequately grazed and overgrazed locations.
Moreover, tillers with more developed stems provide a longer lengthening period and greater distance to be traveled by the leaf blade from the point of connection with the meristem to the extremity of the pseudostem (SKINNER; NELSON, 1995), which likely resulted in longer leaf blades. This may explain the large green leaf mass in the under grazed pasture site (Table 3). Conversely, the lower (p < 0.05) green leaf blade mass in the overgrazed sward site indicates leaf area was smaller at that site, and therefore signal grass plants were intercepting less light. As such, it can be presumed that the photosynthesis ability of the canopy and the growth rate of the sward were being hindered, as the interception of light by leaf blades is a basic premise for forage production.
The lower mass of the morphological components of pasture at the overgrazed site further make it possible to infer that there less soil cover at that sward site. Therefore, it is possible that the soil was more susceptible to erosion at that site, and that the sward was more prone to weed infestation.
Dead material mass was greater (p < 0.05) at the site of the same sward with adequate grazing and
under grazing compared to the overgrazed site (Table 3). This result was expected, as in shaded conditions - common at the under grazed site - younger and smaller tillers die due to competition against larger tillers (SANTOS et al., 2010), which increases dead material mass at that sward site. The lower dead material mass at the overgrazed and adequate grazing sites is consistent with the condition of larger amount and better quality of the light shining on that sward site, which stimulates tiller renovation (DEREGIBUS et al., 1983). Additionally, harvesting forage by grazing animals at the overgrazed site is efficient due to the high intensities and frequencies of plant tissue removal. Therefore, forage losses from senescence are reduced.
The larger masses of green stem and dead material in the under grazed condition make it possible to characterize the sward at that site as inadequately structured for animal intake and featuring limited feeding value. Indeed, green stem and senescent tissues have inferior nutritional value compared to dead leaf blade (SANTOS et al., 2008).
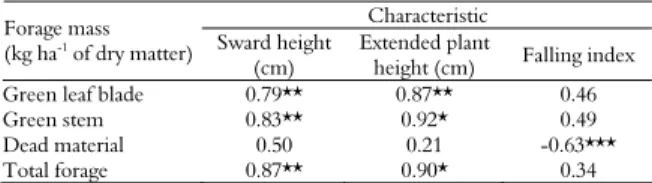
In the association study, strong linear correlations were observed between forage and morphological component mass and sward height, extended plant height and falling index of signal grass (Table 4). Sward height showed (p < 0.05) positive correlations with the masses of green leaf, green stem and total forage (Table 4). These results are due to the fact that, at the sites of the same signal grass sward with overgrazing, low forage mass was observed, including leaf blade and green stems (Table 3), as a result of the higher frequency and intensity of grazing by cattle. This also resulted in reduced sward height at those sites (Table 2). An opposite response pattern occurred at the pasture sites with under grazing.
Table 4. Linear correlations between forage and morphological component mass and sward height, extended plant height and falling index at sites of the same signal grass sward managed under continuous stocking with cattle.
Characteristic Forage mass
(kg ha-1
of dry matter) Sward height (cm)
Extended plant
height (cm) Falling index Green leaf blade 0.79** 0.87** 0.46 Green stem 0.83** 0.92* 0.49 Dead material 0.50 0.21 -0.63*** Total forage 0.87** 0.90* 0.34
*Significant according to t-test (p < 0.01); **Significant according to t-test (p < 0.05); ***Significant according to t-test (p < 0.01).
these variables, when evaluated at the different sites of the same signal grass sward. In fact, the masses of leaf blades, green stems and total forage (Table 3), as well as extended plant height (Table 2) were highest at under grazed pasture sites and lowest at locations with overgrazing.
With regard to the falling index, its correlation was negative (p < 0.01) only with dead material mass in the signal grass sward (Table 4). This result was unexpected, because at under grazed sites - which are likely to have more dead forage mass given the increased probability of forage loss by senescence - fallen signal grass tillers are common as a result of their thin stem, which would characterize a positive relation between these variables. However, this negative correlation between falling index and dead material mass can be understood when the results are put in context. Indeed, dead material mass was lower at the overgrazed sward site (Table 3), but the falling index was high due to morphological adaptations in the form of signal grass growth, in a more prostrate manner (Table 2). This likely caused the relationship between falling index and dead material mass to be negative (Table 4).
By quantifying the relative participation of tiller size categories at the different sites of the same signal grass sward, it was detected that in general there were higher rates (p < 0.05) of tillers larger than 40 cm at under grazed sites (Table 5). This result is plausible in the sense that, as previously discussed, at under grazed sites most tillers did not see growth interrupted by cattle grazing, and therefore reached greater heights. A lower (p < 0.05) relative participation of signal grass tillers shorter than 10 cm at the under grazed sward site was also observed (Table 5), which is likely due to more intense shading of younger and shorter tillers at that sward site. Under this situation of fierce competition for light, smaller and younger tillers were at a disadvantage against larger tillers, resulting in greater mortality of the former (SANTOS et al., 2010).
Table 5. Relative values (%) of population density for tillers of different sizes at sites of the same signal grass sward managed under continuous stocking with cattle.
Sward site Tiller size (cm)
Under grazed Adequate Overgrazed 0 to 10 6.09 b 11.20 b 64.41 a 10 to 20 10.21 b 37.19 a 30.83 a 20 to 30 4.89 b 34.72 a 2.74 b 30 to 40 8.15 a 8.85 a 1.65 b 40 to 50 18.96 a 3.97 b 0.00 b 50 to 60 16.79 a 2.51 b 0.00 b Over 60 34.91 a 1.56 b 0.00 b
Means followed by the same letter in a row do not differ according to the Dms test (p < 0.05).
At the sites with adequate grazing in the same sward, there was a predominance (p < 0.05) of tillers between 10 and 30 cm, which represented approximately 72% of the total number of tillers at that sward site (Table 5). The predominance of tillers in that size range (10 to 30 cm) is due to the mean height of plants at that sward site, which at the time of samplings was around 25 cm.
With regard to the overgrazed site, the highest (p < 0.05) relative participation was from tillers shorter than 20 cm, especially those shorter than 10 cm (Table 5). In reality, there were few tillers taller than 20 cm at the overgrazed site (4.4% of total tillers); additionally, there were no tillers taller than 40 cm (Table 5). This response pattern is also consistent with the condition of greater defoliation frequency and/or intensity at that sward site, which caused a reduction in the size of signal grass tillers as one of the forms of morphological adaptation of plants to overgrazing.
With regard to the diversity in tiller size observed in the signal grass sward, it was lower at the overgrazed site compared to the other evaluated locations. There were only four tiller size categories at the overgrazed site, whereas at the locations with adequate grazing and under grazing all eight tiller size categories made up the total tiller population (Table 5).
If we consider that the diversity of tillers in the same sward tends to benefit the sustainability of pasture, the overgrazed site would be in an inadequate or compromised situation due to the poor diversity in tiller size. In effect, tillers with different structural characteristics - and therefore with specific physiologies - have different capabilities of occupying separate ecological niches, which would result in more complete and optimized use of environmental resources (SPEHN et al., 2005).
The results of the descriptive characteristics of sward structure presented in this work (Tables 2, 3 and 5) evidence the spatial variability of vegetation in the same sward as a function of the level of cattle grazing. It was precisely this heterogeneity of plants in the same sward that allowed the comparison of the averages between treatments in this work.
efficiency, which causes a higher falling index in plants (Table 2), as well as high forage loss from senescence, resulting in larger dead material mass at that sward site (Table 3). Moreover, the conversion stage can be limited by the inferior nutritional value at the under grazed site, because the sward at that location features higher mass of green stem and dead material (Table 3) - components with inferior nutritional value.
As such, one way to avoid under- and overgrazing in pastures managed under continuous stocking is by subdividing them using fences, especially when the sward comprises areas with different vegetation and topography. It should also be highlighted that in large pastures, sites with inadequate grazing (under- and/or overgrazing) can become larger, magnifying the problems resulting from inadequate grazing at those locations.
Conclusion
In the same sward of Brachiaria decumbens GS. Basilisk under continuous stocking, there is spatial variability of vegetation due to uneven cattle grazing. The higher falling index at the overgrazed site results from the prostrate growth of B. decumbens. The overgrazed site of the same B. decumbens sward has low leaf blade mass, which can compromise sward perenniality if that condition persists over a long period of time. The under grazed site in the same sward of B. decumbens with under grazing features unfavorable structure for efficient forage harvesting by animals.
References
CARNEVALLI, R. A.; DA SILVA, S. C.; BUENO, A. A. O.; UEBELE, M. C.; BUENO, F. O.; SILVA, G. N.; MORAES, J. P. Herbage production and grazing losses in Panicum maximum cv. Mombaça under four grazing managements.
Tropical Grasslands, v. 40, n. 3, p. 165-176, 2006.
DEREGIBUS, V. A.; SANCHEZ, R. A.; CASAL, J. J. Effects of light quality on tiller production in Lolium spp.
Plant Phisiology, v. 27, n. 3, p.900-912, 1983.
McNAUGHTON, S. J. Grazing lawns: animal in herds, plant forms and coevolution. The American Naturalist, v. 124, n. 6, p. 863-886, 1984.
SANTOS, M. E. R.; FONSECA, D. M.; EUCLIDES, V. P. B.; RIBEIRO JUNIOR, J. I.; BALBINO, E. M.; CASAGRANDE, D. R. Valor nutritivo da forragem e de seus componentes morfológicos em pastagens de
Brachiaria decumbens diferida. Boletim da Indústria Animal, v. 65, n. 4, p. 303-311, 2008.
SANTOS, M. E. R.; FONSECA, D. M.; BALBINO, E. M.; MONNERAT, J. P. I.; SILVA, S. P. Caracterização de perfilhos em pastos de capim-braquiária diferidos e
adubados com nitrogênio. Revista Brasileira de Zootecnia, v. 38, n. 4, p. 643-649. 2009a.
SANTOS, M. E. R.; FONSECA, D. M.; EUCLIDES, V. P. B.; NASCIMENTO JUNIOR, D.; QUEIROZ, A. C.; RIBEIRO JUNIOR, J. I. Características estruturais e índice de tombamento de Brachiaria decumbens cv. Basilisk em pastagens diferidas. Revista Brasileira de Zootecnia, v. 38, n. 4, p. 626-634, 2009b.
SANTOS, M. E. R.; FONSECA, D. M.; GOMES, V. M.; BALBINO, E. M.; MAGALHÃES, M. A. Estrutura do capim-braquiária durante o diferimento da pastagem. Acta Scientiarum. Animal Sciences, v. 32, n. 2, p. 139-145, 2010.
SANTOS, M. E. R.; FONSECA, D. M.; GOMES, V. M.; CASTRO, M. R. S.; CARVALHO, V. V. Desfolhação de perfilhos em pasto de capim-braquiária sob lotação contínua.
Ciência Animal Brasileira, v. 12, n. 2, p. 241-249, 2011a. SANTOS, M. E. R.; FONSECA, D. M.; GOMES, V. M.; PIMENTEL, R. M.; SILVA, G. P.; SILVA, S. P. Caracterização de perfilhos de capim-braquiária em locais com três intensidades de pastejo. Revista Brasileira de Saúde e Produção Animal, v. 11, n. 4, p. 961-975, 2011b.
SBRISSIA, A. F.; DA SILVA, S. C. Compensação tamanho/densidade populacional de perfilhos em pastos de capim-marandu. Revista Brasileira de Zootecnia, v. 37, n. 1, p. 35-47, 2008.
SKINNER, R. H.; NELSON, C. J. Elongation of the grass leaf and its relationship phillochron. Crop Science, v. 35, n. 1, p. 4-10, 1995.
SPEHN, E. M.; HECTOR, A.; JOSHI, J.; SCHERER-LORENZEN, M.; SCHMID, B.; BAZELEY-WHITE, E.; BEIERKUHNLEIN, C.; CALDEIRA, M. C.; DIEMER, M.; DIMITRAKOPOULOS, P. G.; FINN, J. A.; FREITAS, H.; GILLER, P. S.; GOOD, J.; HARRIS, R.; HÖGBERG, P.; HUSS-DANELL, K.; JUMPPONEN, A.; KORICHEVA, J.; LEADLEY, P. W.; LOREAU, M.; MINNS, A.; MULDER, C. P. H.; O'DONOVAN, G.; OTWAY, S. J.; PALMBORG, C.; PEREIRA, J. S.; PFISTERER, A. B.; PRINZ, A.; READ, D. J.; SCHULZE, E.-D.; SIAMANTZIOURAS, A.-S. D.; TERRY, A. C.; TROUMBIS, A. Y.; WOODWARD, F. I.; YACHI, S.; LAWTON, J. H. Ecosystem effects of biodiversity manipulations in European grasslands.
Ecological Monographs, v. 75, n. 1, p. 37-63, 2005. UFV-Universidade Federal de Viçosa. SAEG – Sistema de análises estatísticas e genéticas. Versão 8.1. Viçosa: UFV, 2003.
Received on November 26, 2010. Accepted on July 28, 2011.