Relationship between fruit traits and contents
of ascorbic acid and carotenoids in peach
Rosana Gonçalves Pires Matias
1, Danielle Fabíola Pereira da
Silva
1, Priscila Maria Dias Miranda
1, João Alison Alves Oliveira
1*, Leonardo Duarte Pimentel
1and Cláudio Horst Bruckner
1Abstract: This study aimed to evaluate the relationship between fruit traits
and their direct and indirect effects on the content of ascorbic acid and ca
-rotenoids in peaches and nectarines. The traits fruit mass (FM); equatorial diameter (ED); suture diameter (SD); polar diameter (PD); pulp firmness (FIR); soluble solids (SS); titratable acidity (TA); SS/TA ratio; contents of ascorbic acid (AA) and carotenoids (CT); and skin and pulp color were evaluated in 28 peach cultivars, and two nectarine cultivars. The phenotypic correlation coefficients were estimated (rf), and after multicollinearity diagnosis, unfolding was carried out in direct and indirect effects of the explanatory variables in the response variable by using path analysis. The strongest correlations were found between FM, SD, ED, and PD, and between carotenoid content and °h pulp. The traits considered in the path diagrams are not the main determinants of the ascorbic acid content. The yellow color of the pulp has the potential for indirect selection for carotenoid content.
Key words: Prunus persica, indirect selection, fruit quality.
Crop Breeding and Applied Biotechnology 16: 348-354, 2016 Brazilian Society of Plant Breeding. Printed in Brazil
http://dx.doi.org/10.1590/1984-70332016v16n4n51
NOTE
*Corresponding author: E-mail: [email protected]
Received: 02 May 2016 Accepted: 11 July 2016
1 Universidade Federal de Viçosa (UFV),
De-partamento de Fitotecnia, Avenida P.H. Rolfs, 36.570-900, Viçosa, MG, Brazil
INTRODUCTION
Correlated responses are common in breeding programs for selection of variables which are difficult to be measured, or when the measurements are expensive. Therefore, understanding the relationship between variables is crucial, since obtaining genetic gains and choosing the best genotypes often rely on a set of agronomic and commercial variables. The knowledge of these relationships allows obtaining a main variable of low heritability, and/or of difficult measurement to be selected based on another (s) variable (s), providing the breeder a more rapid progress than that used for direct selection.
Although it is important, the simple correlation coefficient may create misconceptions regarding the relationship between two variables, and may not be a true cause and effect measurement. Thus, a high or low coefficient of correlation between two variables may result from the effect of a third variable or group of variables, without giving the exact relative importance of the direct and indirect effects of these factors (Cruz et al. 2012).
relationship between variables. Moreover, the split correlation is dependent on the set of variables studied, which is usually determined from prior knowledge of their importance for research, and possible inter-relationships expressed in path diagrams (Cruz et al. 2012, Oliveira et al. 2010).
The consumption of fruits and vegetables has always been valued due to the health benefits of the large amount of vitamins, minerals and fibers they have, contributing to the prevention or delay of the onset of cardiovascular diseases and cancer (Bowen-Forbes et al. 2010, Tsantili et al. 2010). This protective effect has been attributed to the presence of antioxidant phytochemicals. Vitamins C and E, carotenoids, and flavonoids are among the non-enzymatic antioxidants that have received more attention for their possible body beneficial effect (Silva et al. 2010, Wolfe et al. 2008).
Vitamin C stability in foods is affected by heat, light, oxygen, and pH. Furthermore, high-risk handling reagents, such as sulfuric acid, are used in the quantification and, or in determination of ascorbic acid content (Spinola et al. 2013, Tarrago-Trani et al. 2012).
The need for reliable information on food carotenoids is widely recognized in several fields of study. The factors that make this analysis difficult include the large number of naturally occurring carotenoids, the quantitative and qualitative variation of carotenoids in foods, the small amount of pro-vitamin A carotenoids, their varied biopotency, and the fact that carotenoids are highly unsaturated molecules, which can cause isomerization, oxidation and degradation during analysis (Rivera and Canela-Garayoa 2012, Rodriguez-Amaya 2010).
The objective of this study was to evaluate the relationship between traits of peach and nectarine, and their direct and indirect effects on the content of ascorbic acid and carotenoids, using path analysis, aiming to assist selection in breeding programs.
MATERIAL AND METHODS
The plant material evaluated in this work is part of the collection of 56 peach cultivars and 3 nectarine cultivars located in the orchard of the Department of Plant Science, Federal University of Viçosa, Viçosa (lat 20° 45’ S, long 42° 51’ W, alt 649 m asl), Minas Gerais State, Brazil. However, only 30 cultivars were evaluated due to fruit availability (Table 1).
The orchard was established in the container growing system, in October 2008, spaced 5.0 m between rows, and 3.5 m between plants, with three plants of each cultivar arranged side by side, in an area of about half a hectare. The plant cultivars canopy was obtained by grafting, using the cultivar ‘Okinawa’ as rootstock. It was carried out cultural practices usually recommended for the culture.
Evaluations were carried out in the years of 2011, 2012 and 2013. Thirty fruits were randomly collected from three trees of each cultivar. Fruits were harvested when the green background color changed to light yellow or white cream, according to the fruit flesh color, and 14 physical and chemical traits were evaluated: fruit mass (FM), in grams (g), was measured to the nearest 0.1 kg with a digital scale; suture diameter (SD) (maximum transversal distance from the suture to the opposite face), equatorial diameter (ED) (maximum transversal distance perpendicular to the suture), and polar diameter (PD) (distance from the apex to the stalk cavity) were measured (mm) using a digital caliper; pulp firmness (FIR) was measured on the equatorial region of one of the faces of each fruit after skin removal, using a 8 mm diameter plunger tip digital penetrometer (TF-011), and was expressed in Newtons (N); soluble solids (SS) was analyzed in the hand squeezed juice from one equatorial face of each fruit, using an ATAGO digital refractometer (Palette PR-101), and was expressed in ºBrix; titratable acidity (TA) was obtained by titrating 5 g ground pulp plus 95 ml distilled water with NaOH 0.1 N solution, and was expressed as percentage of malic acid; soluble solids and titratable acidity (SS/TA) ratio was calculated by dividing values of the soluble solids by the values of titratable acidity; ascorbic acid content in the pulp (AA) was determined by titration, using the Tillman’s reagent [2,6dichlorophenolindophenol (sodium salt) 0.1%], according to AOAC (1997), and was expressed in mg of ascorbic acid per 100 g pulp; carotenoid content (CT) was extracted with 80% acetone of about 2g pulp, according to the methodology proposed by Lichtenthaler (1987), and was expressed in mg 100 g-1 pulp; skin color (measured in the equatorial region of opposite fruit sides), and pulp color (measured in the
central region of one of the pulp faces of the fruit), given by the coordinate b* and the hue angle h°, were determined by reflectometry, using a Minolta reflectometer (Color Reader CR-10), which provides readings of L*, a*, b*, C and °h. The coordinate b* ranges from blue (-60) to yellow (+60), and the hue angle °h [h = arctg(b
the color red, 90° for yellow, 180° for green, and 270° for blue (Mcguirre 1992).
Estimates of phenotypic correlation coefficients were calculated by the Pearson’s method (Steel and Torrie 1960), and tested at 1 and 5% probability by the t test, with n-2 degrees of freedom. Phenotypic correlation coefficients were
determined for all combinations of traits to provide information on the nature and intensity of the relationship between them. Afterwards, the multicollinearity diagnostics was carried out, and the phenotypic correlation was decomposed into direct and indirect effects using path analysis, according to Cruz et al. (2012).
The multicolinearity test was carried out according to the criteria proposed by Montgomery and Peck (1981), which are based on the determinants of the correlation matrix and on the condition number (CN = ratio between the largest and smallest eigenvalue) of these matrices. According to these authors, as the determinant of the correlation matrix between traits approaches zero, multicollinearity becomes more severe. Besides, if NC <100, multicollinearity is not a serious problem (weak multicolinearity). If 100<CN<1000, multicollinearity is moderate to strong, and when CN>1000, there is evidence of severe multicollinearity. Analysis of the elements of the eigenvectors associated with eigenvalues, as described by Belsley et al. (1980), was performed to detect the traits that contributed to the presence of multicollinearity.
To estimate the path coefficients, it was first used a flow diagram to show the cause-effect relationships using the association between the response variable ascorbic acid content (AA) and the explanatory variables, and then it was used another causal diagram to show the interrelationship between the response variable carotenoid content (CT) and
Table 1. List of the cultivars, pedigree, origin, pulp color, and botanical variety of cultivars evaluated for fruit quality
Code Cultivar Pedigree Origin1 Pulp Bot. v2
1 Aldrighi Rio Grande do Sul Selection ECT A P
2 Argel - - A P
3 Aurora 2 Open pollinationOuromel-4 IAC A P
4 Baronesa (Hawaiia x Southland)F3 ECT A P
5 Biuti Halford-2 x Rubi IAC A P
6 Campinas-1 Autof. De Lake City IAC A P
7 Capdebosq Lake City x S56-87 ECT A P
8 Cerrito (Lake City x S56-32) F2 ECT A P
9 Colibri Self pollination of Cristal IAC B P
10 Coral Delicioso x Interlúdio ECT B P
11 Cristal Suber x Pérola de Itaquera IAC B P
12 Delicioso Precoce Supermel x Rubrosol IAC B P
13 Diamante Convênio x Pelota 77 ECT A P
14 Elberta - ECT A P
15 Flordaprince Fla 2-7 x Maravilha Flórida A P
16 Jóia4 Catita x Rubrosol IAC B P
17 Josefina Open pollination (Ouromel x Rubrosol) IAC B N
18 Lake City - ECT A P
19 Maciel Conserva 171 x Conserva 334 ECT A P
20 Marli (Delicioso x Interlúdio) F2 ECT B P
21 Minasul - - A P
22 Olímpia Bolinha x 7-28 ECT A P
23 Pérola de Itaquera - - B P
24 Real Lake City x Rei da Conserva IAC A P
25 Rei da Conserva Discovered in Itaquera (SP) - A P
26 Rubimel Chimarrita x Flordaprince ECT A P
27 Rubrosol Open pollination (Southland x Hawaiia)F2 Flórida A N
28 Talismã Rei da Conserva x Jewel IAC B P
29 Tropical Open pollination of IAC 371-2 IAC B P
30 Tropic Beauty - Flórida A P
1 IAC (Instituto Agronômico de Campinas); ECT (Embrapa Clima Temperado); Flórida (Peach Improvement Program - United States)
the explanatory variables. All analyses were carried out using the GENES software (Cruz 2013), with means of three years of evaluation.
RESULTS AND DISCUSSION
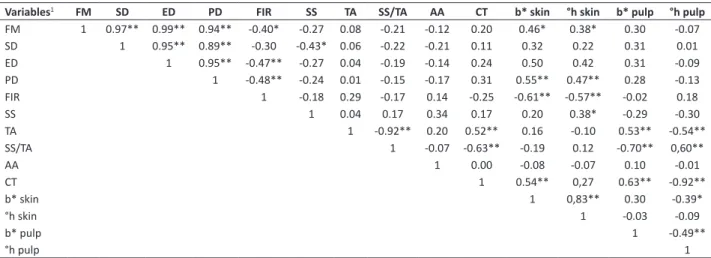
Table 2 shows the phenotypic correlations between the variables. The strongest positive correlations were observed between FM, SD, ED and PD (above 0.87). Albuquerque et al. (2004) also observed that the phenotypic correlation between fruit mass, equatorial diameter and polar diameter was strong and positive (above 0.83) in two years of evaluation. In the same way, Saran (2007) studied the association between peach traits, and found strong positive correlations between fruit mass, length (PD) and diameter (ED) (above 0.96). Albuquerque et al. (2004) discussed that the improvement of fruit physical traits can be based on selection for fruit diameter and low length (PD)/diameter (ED) ratio. Negreiros et al. (2007) suggested that these correlations indicate that the selection of plants with heavy fruit can be based on the equatorial fruit diameter, in the field, without weighing them, which can greatly facilitate selection in passion fruit.
All low correlations were observed between ascorbic acid content (AA) and the other variables (Table 2), such as the correlation between TA and AA (0.20). It can be inferred that the environment influences the relationship between the studied variables. Similarly, Silva et al. (2013) found weak correlation between TA and AA (0.07) in peaches. However, in acerola, Nunes et al. (2004) reported that the association between TA and AA was strong (0.77).
Using path analysis significant direct association with the carotenoid content of the pulp (°h) (0.92) (Table 2), indicating that fruits with more intense yellow pulp, with lower values of (°h) have higher carotenoid contents. This also evidences the direct influence of the variable carotenoid content on the color of the pulp, regardless of other traits under study. Costa et al. (2010) concluded that total carotenoid content characterizes the yellow color of red mombin pulp (Spondias purpurea), by using colorimetric analysis. Meléndez-Martínez et al. (2010) and Meléndez-Martínez et al. (2007) proposed that the variation in the pulp color observed among orange varieties is due to variations in the amount of different carotenoids.
The path analysis constitutes an expansion of multiple regression, when they are involved in complex interrelationships and, or, several causal diagrams, the reliability of the path coefficients may be affected by the effects of existing multicollinearity between the traits that make up the causal diagram due to high variance associated with their estimators (Souza et al. 2014). When multicollinearity increases, the ability to define any effects of variables decreases. It should be noted that some estimators reach very high values, indicating an unreliable estimate (Hair 1998). A recommended solution is to remove one or more independent variables which are highly correlated. A way to remove these variables
Table 2. Phenotypic correlations between 14 traits in 28 peach cultivars and two nectarine cultivars, in 2011, 2012 and 2013
Variables1 FM SD ED PD FIR SS TA SS/TA AA CT b* skin °h skin b* pulp °h pulp
FM 1 0.97** 0.99** 0.94** -0.40* -0.27 0.08 -0.21 -0.12 0.20 0.46* 0.38* 0.30 -0.07
SD 1 0.95** 0.89** -0.30 -0.43* 0.06 -0.22 -0.21 0.11 0.32 0.22 0.31 0.01
ED 1 0.95** -0.47** -0.27 0.04 -0.19 -0.14 0.24 0.50 0.42 0.31 -0.09
PD 1 -0.48** -0.24 0.01 -0.15 -0.17 0.31 0.55** 0.47** 0.28 -0.13
FIR 1 -0.18 0.29 -0.17 0.14 -0.25 -0.61** -0.57** -0.02 0.18
SS 1 0.04 0.17 0.34 0.17 0.20 0.38* -0.29 -0.30
TA 1 -0.92** 0.20 0.52** 0.16 -0.10 0.53** -0.54**
SS/TA 1 -0.07 -0.63** -0.19 0.12 -0.70** 0,60**
AA 1 0.00 -0.08 -0.07 0.10 -0.01
CT 1 0.54** 0,27 0.63** -0.92**
b* skin 1 0,83** 0.30 -0.39*
°h skin 1 -0.03 -0.09
b* pulp 1 -0.49**
°h pulp 1
1 FM: fruit mass (g); SD: suture diameter (mm); ED: equatorial diameter (mm); PD: polar diameter (mm); FIR: pulp firmness (N); SS: soluble solids (° Brix); TA: titratable
acidity (% malic acid 100 g-1 pulp); SS/TA: soluble solids and titratable acidity ratio; AA: ascorbic acid; CT: carotenoid content (mg 100 g-1 pulp); skin b*, skin °h, pulp b*,
is by using the principal component regression through the main components corresponding to the eigenvalues. Thus, it was noted that the diagnosis of multicollinearity between the explanatory variables of the ascorbic acid content (AA) indicated high collinearity, and variables MF, SS/TA, CT, and DS were redundant. The diagnosis of multicollinearity found for the explanatory variables of the carotenoid content (CT) presented high collinearity, and the variables MF, DE and SS/TA were removed from the path analysis (Tables 3 and 4).
The first causal diagram (Table 3) showed high direct effect of SS on the ascorbic acid content (AA); however, the correlation between SS and AA was weak. Moreover, the path analysis showed that the explanatory variables (ED, PD, FIR, SS, TA, skin b*, skin °h , pulp b*, and pulp °h) considered in this model are not the main determinants of the ascorbic acid content (AA), since the coefficient of determination of the model was of low magnitude (R2 = 0.35) and
of high residual effect (0.81). The high instability of vitamins and pro-vitamins increasing local and climate change may result in significant changes in qualitative and quantitative composition of these nutrients. According to Silva et al. (2016), peaches can lose nutrients due to different crop harvesting, and ascorbic acid content has been reported as the most spoilage reaction that occurs between harvests. Ascorbic acid is a synergistic antioxidant and oxygen scavenger. It acts directly with oxygen, forming ascorbic dehydroacetic acid and eliminating the supply of oxygen available for auto-oxidation reactions (Daiuto et al. 2011). Hojo et al. (2011) stated that, during senescence, ascorbic acid of the fruit is
Table 4. Path analysis of the main dependent variable (carotenoid content) and independent variables, in 28 peach cultivars and two
nectarine cultivars, with decomposition of phenotypic correlations into components of direct (main diagonal in bold) and indirect (off-diagonal) effects
Variables1 SD PD FIR SS TA AA b* skin °h skin b* pulp °h pulp Total
SD -0.34 0.30 -0.01 0.08 0.00 0.00 -0.06 0.08 0.07 -0.01 0.11 PD -0.30 0.33 -0.01 0.04 0.00 0.00 -0.10 0.17 0.06 0.11 0.31
FIR 0.10 -0.16 0.02 0.03 0.01 0.00 0.11 -0.20 0.00 -0.15 -0.25
SS 0.15 -0.09 0.00 -0.19 0.00 0.01 -0.03 0.14 -0.07 0.25 0.17
TA -0.02 0.00 0.01 -0.01 0.03 0.00 -0.03 -0.03 0.12 0.45 0.52**
AA 0.07 -0.05 0.00 -0.06 0.01 0.02 0.01 -0.03 0.02 0.01 0.00
b* skin -0.11 0.18 -0.01 -0.04 0.01 0.00 -0.18 0.30 0.07 0.33 0.54**
°h skin -0.07 0.15 -0.01 -0.07 0.00 0.00 -0.15 0.36 -0.01 0.07 0.27
b* pulp -0.10 0.09 0.00 0.05 0.02 0.00 -0.05 -0.01 0.23 0.41 0.63**
°h pulp 0.00 -0.04 0.00 0.06 -0.02 0.00 0.07 -0.03 -0.11 -0.84 -0.92**
R2 0.96
Residual effect 0.21
1 SD: suture diameter (mm); PD: polar diameter (mm); FIR: pulp firmness (N); SS: soluble solids (° Brix); TA: titratable acidity (% malic acid 100 g-1 pulp); AA: ascorbic acid
content (mg 100 g-1 pulp); skin b*, skin °h, pulp b*, and pulp h°: coordinates referring to skin and pulp colors
*, ** Significant at 5 and 1% probability by the t test, respectively
Table 3. Path analysis of the main dependent variable (ascorbic acid content) and independent variables, in 28 peach cultivars and
two nectarine cultivars, with decomposition of phenotypic correlations into components of direct (main diagonal in bold) and indirect (off-diagonal) effects
Variables1 ED PD FIR SS TA b* skin °hskin b* pulp °hpulp Total
ED 0.08 0.05 -0.03 -0.22 0.00 0.11 -0.22 0.13 -0.05 -0.14
PD 0.07 0.05 -0.03 -0.20 0.00 0.12 -0.24 0.12 -0.07 -0.17
FIR -0.04 -0.03 0.06 -0.14 0.04 -0.14 0.30 -0.01 0.10 0.14
SS -0.02 -0.01 -0.01 0.83 0.01 0.05 -0.20 -0.13 -0.17 0.34
TA 0.00 0.00 0.02 0.04 0.13 0.04 0.05 0.22 -0.30 0.20
b* skin 0.03 0.02 -0.03 0.18 0.02 0.22 -0.43 0.13 -0.22 -0.08
°hskin 0.03 0.02 -0.03 0.32 -0.01 0.19 -0.52 -0.01 -0.05 -0.07
b* pulp 0.02 0.01 0.00 -0.24 0.07 0.07 0.02 0.43 -0.27 0.10
°hpulp -0.01 -0.01 0.01 -0.25 -0.07 -0.09 0.05 -0.21 0.56 -0.01
R2 0.35
Residual effect 0.81
1 ED: equatorial diameter (mm); PD: polar diameter (mm); FIR: pulp firmness (N); SS: soluble solids (° Brix); TA: titratable acidity (% malic acid 100 g-1 pulp); skin b*, skin°h,
used in oxidative reactions, which are activated by cellular stresses experienced by the membranes during this period, contributing to the reduction in the ascorbic acid content. Nunes et al. (2004), working with red mombin, found that the variable TA was the main determinant of the ascorbic acid content, which is opposed to reports by Gomes et al. (2000), who recommended the selection based on SS for gains in vitamin C in acerola.
The second causal diagram showed that the coefficient of determination was high (R2= 0.96±0.011), with low residual effect (0.21), meaning that the explanatory variables (SD, PD, FIR, SS, TA, AA, skin b*, skin °h, pulp b*, and pulp h°) used in this model are the main determinants of the response variable carotenoid content (Table 4).
Among the variables in the path diagram, pulp °h presents coefficient of correlation of -0.92, and direct effect of -0.84 (Table 4). These results indicate that the selection based on the variable yellow hue results in gain for carotenoid content. This fact is of great importance for breeding programs, since the evaluation of the yellow hue (pulp °h) with a colorimeter is cheaper and easier. The spectrophotometric methods described in the literature for the determination of carotenoids are very accurate, although they are laborious for the evaluation of large progenies; they require large amount of reagents, and are time consuming (Carvalho et al. 2005). In tomato, studies on the intensity of the correlation between chromaticity and pigment concentrations have shown good correlation between fruit color and lycopene content, a predominant carotenoid in tomatoes (George et al. 2011, Meléndez-Martínez et al. 2007).
The other explanatory variables had, in general, significant correlations with carotenoid content; however, they were associated with direct effects of low magnitude, and the largest indirect effects observed were through °h of pulp, as for TA, skin b*, and pulp b*.
The highest correlation coefficients were found between the traits FM, SD, ED, PD, and between carotenoid content and °h of pulp. The yellow hue of the pulp is associated with the carotenoid content of peaches and nectarines. The physical and chemical traits considered in the path diagrams (ED, PD, FIR, SS, TA, skin b*, skin °h, pulp b*, pulp °h) are not the main determinants of ascorbic acid content. The yellow hue of the pulp (pulp °h) has potential to be used as indirect selection for carotenoid content.
AKNOWLEDGEMENTS
The authors thank CNPq, CAPES and FAPEMIG for the financial support to this research.
REFERENCES
Albuquerque AS, Bruckner CH, Cruz CD, Salomão LCC and Neves JCL (2004) Repeatability and correlations among peach physical traits.
Crop Breeding and AppliedBiotechnology4: 441-445.
AOAC (1997) Official methods of analysis of the Association of the
Official Analytical Chemists International. 16th edn, Patricia Cunniff,
Washinghton, 1683p.
Belsley DA, Kuh E and Welch RE (1980) Regression diagnostics: identifying data and sources of collinearity. John Wiley, New York, 588p. Bowen-Forbes CS, Zhang Y and Nair MG (2010) Anthocyanin content,
antioxidant, anti-inflammatory and anticancer properties of blackberry and raspberry fruits. Journal of Food Composition and
Analysis23: 554-560.
Carvalho W, Fonseca MEN, Silva HR, Boiteux LS and Giordano LB (2005) Estimativa indireta de teores de licopeno em frutos de genótipos de tomateiro via análise colorimétrica. Horticultura Brasileira 23:
819-825.
Costa MGP, Figueiredo FJ, Silva QJ and Lima VLAG (2010) Carotenoides totais e caracterização cromática de polpas de frutos de genótipos de cirigueleiras cultivadas no banco de germoplasma do IPA. In X
Jornada de Ensino, Pesquisa e Extensão. UFRPE, Recife, p. 114-119.
Cruz CD (2013) GENES – a software package for analysis in experimental statistics and quantitative genetics. Acta Scientiarum. Agronomy
35: 271-276.
Cruz CD, Regazzi AJ and Carneiro PCS (2012) Modelos biométricos
aplicados ao melhoramento genético. 4th edn, Editora UFV, Viçosa,
514p.
Daiuto ER, Vieites RL and Carvalho LR (2011) Avaliação sensorial do guacamole com adição de á-tocoferol e ácido ascórbico conservado pelo frio. Revista Ceres58: 140-148.
George S, Tourniaire F, Gautier H, Goupy P, Rock E and Caris-Veyrat C (2011) Changes in the contents of carotenoids, phenolic compounds and vitamin C during technical processing and lyophilisation of red and yellow tomatoes.Food Chemistry124: 1603-1611.
Gomes JG, Perecin D, Martins ABG and Almeida EJ (2000) Variabilidade fenotípica em genótipos de acerola. Pesquisa Agropecuária Brasileira 35: 2205-2211.
Lichtenthaler HK (1987) Chlorophylls and carotenoids: Pigments of photosynthetic biomembranes. Methods in Enzymology148:
Hair JF (1998) Multivariate data analysis. 5th edn, Prentice-Hall, New Jersey, 730p.
Hojo ETD, Durigan JF and Hojo RH (2011) Uso de tratamento hidrotérmico e ácido clorídrico na qualidade de lichia ‘Bengal’. Revista Brasileira
de Fruticultura 33: 386-393.
Meléndez-Martínez AJ, Escudero-Gilete ML, Vicario IM and Heredia FJ (2010) Effect of increased acidity on the carotenoid pattern and colour of orange juice. European Food Research and Technology 230: 527-532.
Meléndez-Martínez AJ, Britton G, Vicario IM and Heredia FJ (2007) Relationship between the colour and the chemical structure of carotenoid pigments. Food Chemistry101: 1145-1150.
Meléndez-Martínez AJ, Vicario IM and Heredia FJ (2007) Review: Analysis of carotenoids in orange juice. Journal of Food Composition and
Analysis20: 638-649.
Mcguire RG (1992) Reporting of objective color measurements.
HortScience27: 1254-1260.
Montgomery DC and Peck EA (1981) Introduction to linear regression
analysis. John Wiley, New York, 1012p.
Negreiros JRS, Álvares VS, Bruckner CH, Morgado MADO and Cruz CD (2007) Relação entre características físicas e o rendimento de polpa de maracujá-amarelo. Revista Brasileira de Fruticultura 29: 546-549.
Nunes ES, Carneiro PCS, Couto FAA and Braz VB (2004) Importância das características físicas e químicas na determinação do teor de vitamina C em frutos de aceroleira. Revista Ceres51: 657-662.
Oliveira EJ, Lima DS, Lucena RS, Motta TBN and Dantas JLL (2010) Correlações genéticas e análise de trilha para número de frutos comerciais por planta em mamoeiro. Pesquisa Agropecuária Brasileira 45: 855-862.
Rivera SM and Canela-Garayoa R (2012) Analytical tools for the analysis of carotenoids in diverse materials. Journal of Chromatography A
1224: 1-10.
Rodriguez-Amaya DB (2010) Quantitative analysis, in vitro assessment of bioavailability and antioxidant activity of food carotenoids - A review.
Journal of Food Composition and Analysis 23: 726-740.
Saran PL (2007) Association analysis in peach (Prunus persica L.) genotypes. Progressive Horticulture 39: 49-53.
Silva MLC, Costa RS, Santana AS and Koblitz MGB (2010) Compostos fenólicos, carotenoides e atividade antioxidante em produtos vegetais. Semina31: 669-681.
Silva DFP, Matias RGP, Silva JOC and Bruckner CH (2016) Characterization of white-fleshed peach cultivars grown in the Zona da Mata area of Minas Gerais State, Brazil. Comunicata Scientiae 7: 149-153.
Silva DFP, Silva JOC, Matias RGP, Ribeiro MR and Bruckner CH (2013) Correlação entre características quantitativas e qualitativas de frutos de pessegueiros na geração F2 cultivados em região subtropical.
Revista Ceres 60: 053-058.
Spinola V, Berta B, Câmara JS and Castilho PC (2013) Effect of time and temperature on vitamin c stability in horticultural extracts. UHPLC-PDA vs. iodometric titration as analytical methods. LWT - Food
Science and Technology50: 489-495.
Souza TV, Silveira SC and Scalon JD (2014) Análise de trilha na relação entre características morfológicas do milho e sua produtividade de grãos. Revista da Estatística da Universidade Federal de Ouro
Preto3: 124-128.
Steel RGD and Torrie JH (1960) Principles and procedures of statistics. McGraw-Hill, New York, 640p.
Tarrago-Trani MT, Phillips KM and Cotty M (2012) Matrix specific method validation for quantitative analysis of vitamin c in diverse foods.
Journal of Food Composition and Analysis 26: 12-25.
Tsantili E, Shin Y, Nock JF and Watkins CB (2010) Antioxidant concentrations during chilling injury development in peaches. Postharvest Biology
and Technology57: 27-34.
Wolfe KL, Kang X, He X, Dong M, Zhang Q and Liu RH (2008) Celular antioxidant activity of common fruits. Journal of Agricultural and
Food Chemistry56: 8418-8426.
Wright S (1921) Correlation and causation. Journal of Agricultural