Genetic molecular diversity, production and resistance to witches’
broom in cacao clones
Eline Matos Lima1, Norma Eliane Pereira1, José Luis Pires2, Antônia Marlene Magalhães Barbosa1 and Ronan Xavier Corrêa3*
Received 16 December 2011 Accepted 18 October 2012
Abstract – The 32 cacao clones selected as being resistant following the witches’ broom epidemic and for having distinct productivity were characterized according to their genetic diversity and were submitted to a new selection. These plants were assessed for eight years at the Oceania Farm (FO) in Itagibá, Bahia, Brazil. The 13 microsatellite primers generated an average of 11.7 amplicons per locus, and based on them it was demonstrated that the 32 clones distribute themselves in groups apart from the nine clones used as controls. The 32 materials displayed significant differences in relation to the characters assessed in the field. Two criteria were formed from the classification of the most productive and resistant plants, and then used to select plants within the clusters. The selected plants displayed potential for the cacao improvement program, that they have a high production and high resistance to witches’ broom.
Keywords: Theobroma cacao, SSR, Moniliophthora perniciosa, selection at farms, genetic improvement.
1 Universidade Estadual de Santa Cruz (UESC), Departamento de Ciências Agrárias e Ambientais, Rodovia Jorge Amado, km 16, 45.662-900, Ilhéus, BA, Brazil
2 Centro de Pesquisas do Cacau, Rodovia Ilhéus-Itabuna, km 22, 45.600-970, Itabuna, BA, Brazil
3 UESC, Departamento de Ciências Biológicas. *E-mail: ronanxc@uesc.br INTRODUCTION
Cacao (Theobroma cacao L.) is an important source of income in the Brazilian states of Rondônia, Amazonas, Pará, Mato Grosso, Espírito Santo and Bahia, the latter being its main producer. In 2001, Brazilian cacao exports arrived at their lowest level in decades due to a productivity drop caused by the occurrence of witches’ broom disease in the Bahia cacao production region (ICCO 2009).
Among the diseases affecting cacao production, witches’ broom is the second highest cause of loss of global cacao
production (the first is black pod, caused by Phytophthora spp, found in all productive regions), causing 60% losses in cacao production in south Bahia in the 1990s (Ploetz 2007). Its causing agent is the fungus Moniliophthora (Sin.: Crinipelllis) perniciosa (Stahel), according to Aime and Phillips-Mora (2005). In 1942, when searching for materi-als resistant to witches’ broom, Pound collected seeds from two plants in the Peruvian Amazon Valley, which he called “Scavina 6 (Sca6) and Sca12”. These plants stood out for not displaying symptoms of the disease (Pound 1982). The Center for Cacao Research developed and distributed the
Theobahia (Sca6 x ICS1) seminal variety to producers in
1995 and five clonal varieties (TSH516, TSH565, TSH1188,
CEPEC42 and EET397) in 1997. All the varieties have Sca6 as their main source of resistance to witches’ broom (Pinto and Pires 1998).
Genetic mapping proved that Sca6 has a gene or gene block with a main effect (major genes), which is responsible for conferring Sca descendant clones resistance to the dis-ease (Queiroz et al. 2003, Faleiro et al. 2006). Although it is a widely used source of resistance, Sca derived varieties have been displaying symptoms in some regions of Brazil (Faleiro et al. 2004). Therefore, a number of studies about the genetic diversity of clones resistant to witches’ broom found in farms are being carried out in order to offer new sources of resistance to the disease.
In the 2000s, various cacao genotypes resistant to witches’ broom were offered as part of the cacao plantation recovery program, of which the main source of resistance was still Sca6. A large group of new sources of resistance has been
identified including the following clones: Cruzeiro do Sul
and RB series, from Acre; MA, from Amazonas; CCN clones, Crop Breeding and Applied Biotechnology 13: 127-135, 2013
Brazilian Society of Plant Breeding. Printed in Brazil
from Ecuador; and CAB, from the Brazilian Amazon (Paim et al. 2006). The characterization of the materials selected in the Bahia cacao production region is vital for the
identi-fication of genotypes with different resistance-linked genes,
with the purpose of obtaining more durable and resistant varieties (Faleiro et al. 2004).
The first genetic molecular diversity studies carried out
with materials from the Bahia cacao production region offered evidence that resistant materials displayed a high genetic similarity with Sca6 (Faleiro et al. 2004, Yamada et al. 2009). Upon analysis of a larger sample from the region’s farms,
it was verified that there are materials with agronomic and
disease-resistant characteristics that are genetically distant from Sca6 (Leal et al. 2008). This demonstrated that clonal varieties selected in commercial areas for their resistance remain unknown when it comes to their genetic diversity and productive potential, for the purpose of being used in genetic improvement, revealing the need for further studies involving materials from different areas of the Bahia cacao productive region.
The objective of this work was analyze the genetic diver-sity of 32 Theobroma cacao plants selected at the Oceania Farm in Itagibá, BA, based on microsatellite markers, and to characterize them as to their production and resistance to witches’ broom.
MATERIAL AND METHODS
The plants used were pre-selected because of their high production and resistance to witches’ broom. These plants constitute cacao genotypes with potential for use in
genetic improvement. The field evaluation of the plants was
carried out by the technical personnel of Oceania Farm in Itagibá, Bahia, in the period between 1996 and 2004. In 2000, the 32 cacao plants used in the present study (named here under code FO) were selected from a list of 120 plants pre-selected at the farm itself for expressing low incidence of witches’ broom in the period from 1996 to 1999, even though they grew in conditions of high incidence of disease. We collected the 24 most productive plants with the lowest number of total brooms; four of the most productive plants, with no consideration to the symptoms of the disease; four of the most resistant plants with no consideration to their production. The cocoa trees in the sampled plantation had an average age of 25 years and were planted with 3 x 3m spacing. Average precipitation was 1,242 millimeters and humidity was around 80% in Ituberá, Bahia, during the years in which the data was collected. During this period, inoculants were available in the plantation (over 90% of the plants were infected and producing basidiocarps).
Of a total of 41 plants analyzed based on microsatellite markers, 32 individuals were selected from the Oceania Farm and nine clones were collected from CEPEC’s germplasm bank as illustrative of international germplasms widely used in Brazil (controls). The clones illustrative of interna-tional germplasm include the following types: three hybrid
clones (TSH1188, CCN51 and EET397); and six foreign
clones (high Amazonian Sca6, IMC67, PA30, PA300, and low Amazonian SIC328 and SIC329) (Iwaro et al. 2003). Therefore, these clones allow a comparative dimensioning of the diversity of the plants selected at Oceania farm with different cacao genetic groups.
DNA samples of each plant were extracted from healthy leaves in intermediate stage of maturation using the CTAB
method (Doyle and Doyle 1990) with modifications (Cor -rêa et al. 1999, Faleiro et al. 2001, Queiróz et al. 2003). The integrity and purity analysis of the DNA samples was carried out by electrophoresis in agarose gel at 1%, dyed with ethidium bromide 1 ng/mL, and compared with known
concentration patterns (lambda phage DNA, λ). The purity
and quantities were determined through spectrophotometry at 260 and 280 nm, with purity taken to be adequate when the relation of absorbance (A) in both wavelengths (A260/ A280) was 1.6 and 2.0. The samples had their concentrations adjusted to 10 ng mL-1 DNA and were preserved at -20 °C.
For DNA amplification, samples were submitted to PCR
(Polymerase Chain Reaction) reactions with the use of 13
specific primers for microsatellite loci (Y16983, Y16987,
AJ271945, Y16 883, Y16984, AJ271827, AJ271944, AJ271946, AJ271953, Y16980, AJ271956, Y16981, Y16978). The primers were pre-developed (Lanaud et al. 1999, Rister-ucci et al. 2000) and used to amplify the samples individually and according to a previously described protocol (Santos et
al. 2007). The amplification products were separated by gel
electrophoresis in denaturing polyacrylamide at 5% in an ABI 377 automatic sequencer (Bertolde et al. 2009). GeneScan and Genotyper programs were used to characterize the
mic-rosatellites, which were amplified from primers marked with fluorochromes and analyzed by means of the fluorescence
detection system in DNA sequencer ABI 377. The size of
each amplified fragment was calculated in number of pairs of
heterozygosis, defined as the relation between the number of
loci in heterozygosis and the total number of loci analyzed. From this distances matrix, the multidimensional space was reduced to a tridimensional space using the Multidimensional Scaling – MDS method, which was graphically represented using SAS G3D (SAS 1988).
Cluster analyses were carried out using the centroid
method, the number of clusters being defined by peaks of
pseudo F, combined with low values of pseudo t2, followed by high t2, to the fusion of the following cluster (SAS 1988). With the purpose of selecting 25% (eight out of 32) of the plants studied at Oceania Farm, a selection rank was cre-ated by adding relative ranks to the total number of brooms and production (Cruz and Regazzi 1997), considering the clusters formed based on molecular markers (selection within the cluster).
The phenotypic analyses of 32 cacao plants from Oceania Farm were carried out in agricultural years 1996 to 2001, 2003 and 2004, according to the following procedures: the
total number of healthy fruits (TNHF) and the weight of dry
seeds produced (YIELD) were determined for each plant; the incidence of witches’ broom was measured by the quantity of total brooms (TB), vegetative brooms (VB), broom in cushions (BC) and percentage of brooms in the fruit (PBF), per plant. Since the production was taken in a reduced number of repetitions, a new production variable was generated by multiplying the number of healthy fruits by the average weight of the fruit, obtained from the relation between the production of dry seeds and the number of fruits. The number of brooms was counted at the tops of four plants located around each plant studied. With these numbers, the average number of brooms per plant was determined for the plants around each of the 32 plants selected for this study. This procedure was carried out to assure the presence of inoculants of the causal agent of witches’ broom where the plants studied were located.
A Tukey test at 5% was used to compare adjusted averages
for the year effect, and the minimum significant deviation
was obtained from the harmonic means of the number of repetitions (year) from which the results were collected, because there was no data collection for some characteris-tics in all years, and a minimum of three observations per characteristic was considered. The materials were submitted to analysis in the year and clone they were considered as
being of fixed effect GLM - SAS (SAS 1988).
Two selection methods were used to select eight plants of highest agronomical value (selection intensity of 25%)
from the 32 plants analyzed. In the first method, all plants were classified by the corrected decreasing order of produc -tion (most productive to least productive) and total number
of brooms in increasing order (least number of brooms to most number of brooms) The rank results were added and
the plants were re-classified into increasing order by adding ranks and, according to the new classification, eight plants
were selected for displaying highest productivity with the least incidence of brooms. In the second selection method, the plants from each cluster formed in the genetic molecular diversity analysis were submitted to the selection procedure
described in the first method, combining with the criterion of
selecting from different clusters. This strategy is supposed to allow a higher genetic diversity of plants studied in the selected group of plants.
RESULTS AND DISCUSSION
The 41 plants displayed a high number of alleles (ampli-cons) per locus, with an amplitude from 4 (locus Y16984) to 22 (locus Y16981), and average of 11.69 (Table 1). This general average is superior to what was observed in most studies using different microsatellite markers in cacao. For example, Risterucci et al. (2001) obtained an average of 5.6
alleles per locus in 20 amplified microsatellite loci from 28
cacao accessions; Motamayor et al. (2002) found an average of 9.4 alleles per locus in 16 loci in 114 cacao accessions. According to Risterucci et al. (2001), the use of eight
mic-rosatellite loci would be sufficient for the characterization
of cacao accessions, however, a minimum of 15 loci must be used for genetic diversity studies. In the present work,
the high number of alleles identified per locus probably
owes to the diversity of the material studied.
The heterozygosis observed varied from 11% in plant
FO21-05 to 67% in plants FO61-10 and TSH1188 (Figure
1). Sca6 clones, the main source of resistance to witches’ broom used to produce hybrids distributed in the Bahia cacao producing region in the 1970s, displayed a heterozygosis of 30%, below which are 18 of the 32 plants collected at the Oceania Farm. Clones CCN 51 and PA 300 displayed 33% heterozygosis, below which are 22 of the 32 plants collected at the Oceania Farm. The level of heterozygosis observed among the individuals from Oceania Farm was considered low (at least for 2/3 of the clones) when compared to the Sca6 clone and the witnesses (clones illustrative of inter-national germplasm types). The low heterozygosis value
of Sca6 and the high heterozygosis value of TSH1188 and
EET397 are in keeping with the genealogy of these materi-als. On the other hand, the high heterozygosis value of SIC clones (resulting from local selections) is an unexpected
finding for these clones because they are selected from
Table 1. Amplification pattern for DNA samples of the 41 cacao clones by microsatellite primer (locus), their respective annealing temperatures (T °C), number of alleles (amplicons) and size of alleles in number of pairs of bases (pb)
Locus* T °C No Alleles Size of alleles (pb)
Y16983 51 10 275, 277, 279, 281, 283, 285,287, 289, 293, 295
Y16987 46 07 253, 255, 257, 259, 261, 263, 265
AJ271945 46 15 156, 204, 206, 208, 210, 214, 216, 218, 220, 222, 226, 230, 232, 234, 236
Y16 883 51 15 127, 129, 133, 139, 141, 143, 159, 161, 165, 169, 171, 173, 175, 181, 199
Y16984 46 04 205, 207, 209, 211
AJ271827 46 12 224, 228, 230, 232, 234, 236, 240, 258, 260, 262, 264, 270
AJ271944 46 15 193, 197, 201, 203, 205, 213, 225, 227, 229, 231, 233, 235, 237, 239, 265
AJ271946 51 05 175, 177, 183, 185, 187
AJ271953 46 13 140, 142, 144, 150, 152, 154, 156, 158, 162, 164, 166, 170, 188
Y16980 46 09 219, 221, 225, 227, 229, 231,233, 235, 239
AJ271956 46 13 200, 228, 232, 242, 244, 248, 250, 252, 254, 256, 258, 288, 294
Y16981 51 22 127, 129, 131, 141, 145, 155, 157, 159, 161, 163, 171, 175, 181, 185, 189, 191, 193, 195, 199, 201, 203, 205
Y16978 51 12 242, 244, 256, 258, 260, 262, 274, 278, 290, 292, 294, 296
Total 152
Média 11.69
* The characteristics of each microsatellite locus are described in www.ncbi.nlm.nih.gov
Clone TSH1188 is a hybrid that displays the highest
heterozygosity among the various genotypes cultivated, good production characteristics, resistance to disease and adaptation to the Bahia cacao production region. Motamayor et al. (2002) evaluated cacao accessions from a number of origins and verified that the high Amazonian foreigners had higher observed heterozygosis
(Ho = 4 8 % ) a n d a h i g h e r n u m b e r o f p o l y m o r-p h i c l o c i t h a n t h e l o w e r A m a z o n i a n f o r e i g n e r s
(Ho = 10%). Sereno et al. (2006), while studying the genetic diversity of the Amazonian cacao based on microsatellite markers, also observed a higher heterozygosity in high
Amazonian materials (Ho = 44,5%). However, it must be
considered that TSH1188 is a hybrid involving six different
clones in its genealogy (Santos et al. 2007), which helps to
explain its elevated Ho, and a few FO clones in relation to clones collected in natural populations.
The genetic distance matrix generated with the SSR marker displayed values in the amplitude 0.25 to 1.00. The materials selected at Oceania Farm showed a higher distance average than those observed for the witnesses, which demonstrates the increased diversity of these plants.
As to the graphic dispersion of genotypes from the genetic distance matrix based on SSR, it was observed that Oceania Farm plants were allocated in groups apart from the control plants (Figure 2). The material from Oceania Farm displayed not only higher variability (higher distance average) than the witness clones but also an expressive dis-tinction from them, and these witnesses are representative of a great part of the variability of the species (high and low
Amazonian, and hybrids), as well as being important sources of resistance (Sca and CCN). The selections from the Farm and the international reference germplasm used displayed an average genetic diversity of 0.91. This number is higher than the average genetic diversity among Oceania Farm clones (0.73) or among the isolated reference clones (0.59). This wide variability and the great distance in relation to witness resistance sources evidence the possibility that resistance genes can occur separate from those characterized in controls.
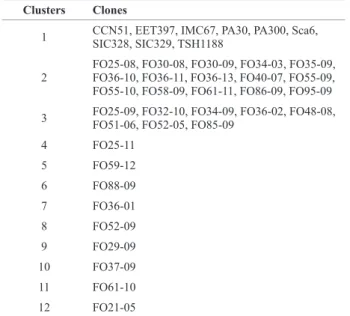
It was possible to subdivide the group formed by materials from Oceania Farm into 11 new groups, among which two were large groups and nine were individual groups (Table 2 and Figure 2). The material that displayed the least genetic distance from FO85-09 among the witnesses was IMC 67 from Peru, a medium productivity clone with good fruit and seed characteristics, in spite of not displaying the same resistance patterns as the Sca6 clone (Pinto and Pires 1998).
The 32 materials analyzed displayed significant differ -ences in treatment for the following phenotypic characters: number of fruits, production, total brooms, vegetative brooms and brooms in cushions, with probability (P) under 0.01; whereas for character percentage of brooms in fruits, the P value was 0.0699. The plant that displayed the highest adjusted average for the quantity of fruits collected per
plant was FO85-09 with 222 fruits, not fiffering statistically
from 11 materials (Table 3). The plants that displayed the best average number of fruits per plant were: FO32-10, FO36-11, FO25-08, FO37-09, FO52-05, FO36-10, FO48-08, FO55-09, FO30-FO48-08, FO52-09, FO51-06, FO85-09. The material that displayed the lowest average was FO25-11
with 35 fruits plant-1. With regard to production, the mate-rial with the highest adjusted average for production was FO25-08, with 9465 g plant-1, and the one with the lowest performance was FO59-12 with 1132 g plant-1. For the production and number of fruit characters, the average for the years in which the assessments were carried out was 4.3 years of observation (higher than the average for all characters, which was 3.89 years).
The vegetative brooms average varied from 5.25 (FO30-08) to no broom in over half of the plants. The general average of quantity of vegetative brooms in the 32 FO plants selected as resistant was 1.05. Counting the number
of brooms verified in the plants neighboring the selected
material revealed an average of 24.84 brooms per plant top. This value is much higher than that observed for the annual average of the 32 plants selected at Oceania Farm. This proves that the plants selected from the farm display a high level of resistance to witches’ broom.
Although widely resistant as a group, these plants show
significant differences among themselves as to the number
of brooms. We highlight that in the study this information aims only at illustrating that there are reasons to consider this character for selection, in view of the limitations related to pre-requisites for variance analysis: deviations from normal distribution, given by the high frequency of zero values; and the non-homogeneity of variables for the plants selected.
Brooms in floral cushions varied from an average of five
brooms in plant FO36-01 to no brooms in plants FO34-03,
FO29-09, FO30-09, FO37-09, FO25-08, FO25-09, FO51-06, FO52-05, FO52-09, FO55-09, FO55-10, FO58-09, FO59-12, FO48-08, FO61-11, FO85-09, 10, FO36-11, FO95-09. Dantas Neto et al. (2005), while studying an F1 progeny of 67 plants originated from crossbreeding clones SIC-864 (Catongo) and CCN-51, found a higher susceptibility to the incidence of vegetative brooms than
of flower cushion brooms, in spite of displaying very close variation coefficients.
The percentage of brooms in fruits varied from zero (plants FO58-09 and FO59-12) to 56.08 (FO95-09) (Table 3). No brooms occurred in the fruits of these two plants during three years of assessment. Plant FO85-09 displayed the highest average number of total fruits and, as already observed, an absence of cushion brooms and vegetative
brooms was verified during the period analyzed, but an average of five brooms in the fruit was displayed, indicat -ing that resistance to cushion and vegetative brooms does not guarantee that the fruit will be free from the disease.
Using a combination of field and molecular results,
eight out of the 32 Oceania Farm plants were selected
(Figure 2). In the first method, since only field data (pro -duction and resistance to witches’ broom) was considered
without verification of the position within the groups, the
most promising plants were FO37-09, FO36-11, FO85-09, FO32-10, FO36-10, FO35-09, FO51-06, and FO29-09.
The average genetic distance verified among them was
0.777. On the other hand, in the second selection method, a ranking within the clusters, it was observed that in cluster two, plants FO36-11 and FO36-10 were more promising
in the field. In cluster three, the best performing plants
were FO32-10 and FO85-09, and in individual clusters plants FO88-09, FO52-09, FO29-09 and FO37-09 were
selected. The average genetic distance verified among
them was 0.789, whereas the average genetic distance of the 32 plants was 0.731.
Six plants are common to both selection types: FO37-09, FO36-11, FO85-FO37-09, FO32-10, FO36-10 and FO29-09;
plants FO35-09 and FO51-06 occur only in the first selec -tion method and FO88-09 and FO52-09 only in the second method.
We therefore verified that the average distances of the
selections according to the two methods are similar, resulting in the inexistence of a trend of clusters with higher kinship for those that are more resistant and productive. So, although consideration to distances is recommended to better represent the original genetic diversity, for the situation in question this procedure is not necessary. Therefore, both methods allowed us to establish a set of plants with great potential Table 2. Cluster formation by the centroid method of 41 cacao accessions
(32 plants from the Oceania Farm - FO’s, and 9 control plants) based on microsatellite markers
Clusters Clones
1 CCN51, EET397, IMC67, PA30, PA300, Sca6, SIC328, SIC329, TSH1188
2
FO25-08, FO30-08, FO30-09, FO34-03, FO35-09, FO36-10, FO36-11, FO36-13, FO40-07, FO55-09, FO55-10, FO58-09, FO61-11, FO86-09, FO95-09
3 FO25-09, FO32-10, FO34-09, FO36-02, FO48-08, FO51-06, FO52-05, FO85-09
4 FO25-11
5 FO59-12
6 FO88-09
7 FO36-01
8 FO52-09
9 FO29-09
10 FO37-09
11 FO61-10
for use in genetic improvement programs due to the ample genetic diversity preserved, large distance in relation to the traditional source of resistance (Sca6), higher production,
and strong resistance to witches’ broom. However, the procedure of choosing based on the classification of the
most productive and resistant plants in each cluster formed based on genetic diversity must be adopted when the type of selection population provides for the formation of selection materials with lower genetic diversity than that in existence in the analyzed population.
Table 3. Average and number of plant assessments for number of fruits (TNHF), production (YIELD), total number of brooms (TB), total number of cushion brooms (BC), number of vegetative brooms (VB) and percentage of brooms in fruit (PBF). N is the number of years of observations
Traits
Clones AverageTNHF N
YIELD Average N
TB
Average N
BC Average N
VB Average N
PBF Average N
FO21-05 91.25 4 4708 4 3.00 4 1.50 4 1.50 4 13.08 4
FO25-08 159.00 4 9465 4 4.75 4 4.75 4 0.00 4 27.72 4
FO25-09 84.60 5 3499 5 0.00 4 0.00 4 0.00 4 1.63 4
FO25-11 35.00 5 1831 5 0.50 4 0.25 4 0.25 4 13.16 4
FO29-09 91.33 3 3866 3 0,00 3 0,00 3 0,00 3 2,42 3
FO30-08 100.25 4 4088 4 6.50 4 5.25 4 1.25 4 0.27 4
FO30-09 46.50 6 2483 6 0.00 4 0.00 4 0.00 4 2.31 4
FO32-10 189.17 6 6300 6 1.80 4 0.25 4 1.50 4 16.19 4
FO34-03 70.00 4 3258 4 4.00 4 4.00 4 0.00 4 6.47 4
FO34-09 84.50 4 3455 4 2.50 4 2.00 4 0.50 4 29.42 4
FO35-09 96.75 4 4812 4 0.25 4 0.00 4 0.25 4 3.63 4
FO36-01 63.25 4 3404 4 7.50 4 2.50 4 5,00 4 0.71 4
FO36-02 60.00 4 3397 4 1.75 4 1.25 4 0.50 4 4.96 4
FO36-10 145.60 5 4200 5 0.00 3 0.00 3 0.00 3 2.51 3
FO36-11 172.50 6 2950 6 0.00 4 0.00 4 0.00 4 0.20 4
FO36-13 57.75 4 3283 4 6.30 3 1.66 3 4.66 3 11.99 3
FO37-09 150.00 4 6682 4 0.00 4 0.00 4 0.00 4 5.57 4
FO40-07 38.50 4 1962 4 4.75 4 4.00 4 0.75 4 1.24 4
FO48-08 121.00 4 5280 4 1.50 4 1.5 4 0.00 4 4.43 4
FO51-06 97.40 5 3638 5 0.00 3 0.00 3 0.00 3 1.77 3
FO52-05 145.75 4 5237 4 1.00 4 1.00 4 0.00 4 6.48 4
FO52-09 100.25 4 3861 4 0.00 4 0.00 4 0.00 4 1.08 4
FO55-09 106.75 4 3725 4 0.00 3 0.00 3 0.00 3 2.62 3
FO55-10 91.50 4 3286 4 0.00 4 0.00 4 0.00 4 0.98 4
FO58-09 44.50 4 1941 4 0.00 3 0.00 3 0.00 3 0.00 3
FO59-12 42.25 4 1132 4 0.00 3 0.00 3 0.00 3 0.00 3
FO61-10 54.33 3 2432 3 2.67 3 1.33 3 1.33 3 2.52 3
FO61-11 60.67 3 2607 3 0.00 3 0.00 3 0.00 3 28.25 3
FO85-09 222.00 6 5438 6 0.00 4 0.00 4 0.00 4 1.77 4
FO86-09 50.25 4 3590 4 0.25 4 0.00 4 0.25 4 4.96 4
FO88-09 96.75 4 3459 4 1.00 3 0.33 3 0.66 3 7.36 3
FO95-09 59.25 4 2098 4 0.00 3 0.00 3 0.00 3 56.00 3
MSD 124.82 5104 7.89 6.53 4.00 55.08
CV (%) 46.74 47.68 103.26 125.42 173.42 71.93
ACKNOWLEDGEMENTS
We thank the owner of the Oceania Farm, José Men-donça, for allowing us to collect data, and the farm em-ployees, especially Francisco Barbosa, for support during
fieldwork. We thank José Olímpio Júnior, for taking part
in choosing the studied population. We thank Agronomy Engineer Frank Lima Pires and Biologist Jeiza Botelho Leal for their collaboration in carrying out this work and for the exchange of experiences. We thank FAPESB and CAPES
for financing the laboratorial experiments and scholarship of first researcher.
Diversidade genética molecular, produção e resistência à vassoura-de-bruxa em
clones de cacau
Resumo – 32 clones de cacau selecionados como resistentes após a epidemia da vassoura-de-bruxa e com destacada produtividade foram caracterizados quanto à diversidade genética e submetidos a nova seleção. Essas plantas foram avaliadas por oito anos na Fazenda Oceania (FO), em Itagibá, BA, Brazil. Os 13 primers microssatélites geraram em média 11,7 alelos (amplicons) por loco, com base nos quais se demonstrou que os 32 clones distribuem-se em grupos distintos dos nove clones utilizados como testemunhas. Os 32 materiais apresentaram diferenças significativas para os caracteres analisados em campo. Dois critérios foram formados pela classificação das plantas mais produtivas e resistentes e utilizados para selecionar plantas dentro dos agrupamentos. Essas plantas selecionadas apresentam potencial para o programa de melhoramento do cacau, possuem elevada produção e alta resistência à vassoura-de-bruxa.
Palavras-chave: Theobroma cacao, SSR, Moniliophthora perniciosa, seleção em fazendas, melhoramento genético.
REFERENCES
Aime MC and Phillips-Mora W (2005) The causal agents of witches’ broom and frosty pod rot of cacao (chocolate, Theobroma cacao) form a new lineage of Marasmiaceae.Mycologia 97: 1012-1022.
Bertolde FZ, Almeida AAF, Corrêa RX, Loquercio LL, Gomes FP, Gaioto FA and Baligar V C (2009) Molecular, physiological and morphological analysis of waterlogging tolerance in clonal genotypes
of Theobroma cacao L. Tree Physiology 30: 56-67.
Corrêa RX, Abdelnoor RV, Faleiro FG, Cruz CD, Moreira MA and Barros EG (1999) Genetic distances in soybean based on RAPD markers. Bragantia 58: 15-22.
Cruz CD and Regazzi AJ (1997) Modelos biométricos aplicados ao melhoramento genético. Editora UFV, Viçosa, 394p.
Dantas Neto A, Corrêa RX, Monteiro WR, Luz EDMN, Gramacho KP and Lopes UV (2005) Caracterização de uma população de cacaueiro para mapeamento de genes de resistência à vassoura-de-bruxa e podridão-parda. Fitopatologia Brasileira 30: 380-386.
Doyle JJ and Doyle JL (1990) Isolation of plant DNA from fresh tissue. Focus12: 13-15.
Faleiro FG, Queiroz VT, Lopes UV, Guimarães CT, Pires JL, Yamada
MM, Araújo IS, Pereira MG, Souza Filho GA, Brown JS, Schnell
R, Ferreira CF, Barros EG and Moreira MA (2006) Mapping QTLs for witches’broom (Crinipellis perniciosa) resistance in cacao
(Theobroma cacao L.). Euphytica 149: 227-235.
Faleiro FG, Lopes UV, Yamada MM, Pires JL, Bahia RCS, Santos RC,
Gomes LMC, Araújo IS, Faleiro ASG, Gramacho KP, Melo GRP,
Monteiro WR and Valle RR (2001) Caracterização de variedades clonais de Theobroma caaco L. com base em marcadores RAPD, AFLP e microssatélites. Agrotrópica 13: 79-86.
Faleiro ASG, Faleiro FG, Lopes UV, Melo GRP, Monteiro WR, Yamada MM, Bahia RC and Corrêa RX (2004) Diversidade genética de acessos de Theobroma cacao L. selecionados por produtores para a resistência à vassoura-de-bruxa com base em marcadores microssatélites. Crop Breeding and Applied Biotechnology 4: 290-297.
ICCO – International Cocoa Organization (2009) Annual forecasts of production and consumption and estimates of production levels to achieve equilibrium in the world cocoa market. Available at <http:// www.icco.org/statistics/production.aspx>. Acessed on May 27, 2009.
Iwaro AD, Bekele FL and Butler DR (2003) Evaluation and utilisation of cacao (Theobroma cacao L.) germplasm at the International Cocoa Genebank, Trinidad. Euphytica 130: 207-221.
Lanaud C, Risterucci M, Pieretti I, Falque M, Bouet A and Lagoda PJL (1999) Isolation and characterization of microsatellites in Theobroma
cacao L. Molecular Ecology 8: 2141-2152.
Leal JB, Santos LM, Santos CAP, Pires JL, Ahnert D and Corrêa RX (2008) Diversidade genética entre acessos de cacau de fazendas e de banco de germoplasma na Bahia. Pesquisa Agropecuária Brasileira 43: 851-858.
Motamayor JC, Risterucci AM, Lopez PA, Ortiz CF, Moreno A and Lanaud C (2002) Cacao domestication I: The origin of the cacao cultivated by the Mayas. Heredity 89: 380-386.
Paim VRLM, Luz EDMN, Pires JL, Silva SDVM, Souza JT, Albuquerque PSB and Santos Filho LP (2006) Fontes de resistência a Crinipellis
perniciosa em progênies de cacaueiros coletados na Amazônia
brasileira. Scientia Agricola 63: 572-578.
Ploetz RC (2007) Cacao diseases: important threats to chocolate production worldwide. Phytopathology 97: 1634-1639.
Pound FJ (1982) A note about the cocoa population on South America. Archives of Cocoa Research 1: 93-97.
Queiroz VT, Guimarães CT, Ahnert D, Schuster I, Daher RT, Pereira MG, Miranda VRM, Loguercio LL, Barros EG and Moreira MA (2003)
Identification of a major QTL in cocoa (Theobroma cacao L.) associated with resistance to witches’ broom disease. Plant Breeding 122: 268-272.
Risterucci AM, Eskes AB, Fargeasm D, Motamayor JC and Lanaud C (2001) Use of microsatellite markers for germplasm identity analysis in cocoa. In Bekele F, End M and Eskes A (eds) Proceedings of the international workshop on new technologies in cocoa breeding, INGENIC, Kota, p. 25-33.
Risterucci AM, Grivet L, N’Goran JAK, Pieretti I, Flament MH and
Lanaud C (2000) A high-density linkage map of Theobroma cacao
L. Theoretical and Applied Genetics 101: 948-955.
SAS (1988) SAS/STAT User’s Guide. Release 6.03, SAS Institute Inc, Cary.
Santos RMF, Lopes UV, Bahia RC, Machado RCR, Ahnert D and Corrêa RX (2007) Marcadores microssatélites relacionados com a resistência à vassoura-de-bruxa do cacaueiro. Pesquisa Agropecuária Brasileira 42: 1137-1142.
Sereno ML, Albuquerque RV and Figueira A (2006) Genetic diversity and natural population structure of cacao (Theobroma cacao L.) from the Brazilian Amazon evaluated by microsatellites markers. Conservation Genetics 7: 13-24.