The introduction of dengue follows
transportation infrastructure changes in the
state of Acre, Brazil: A network-based analysis
Raquel Martins Lana1,2☯*, Marcelo Ferreira da Costa Gomes2☯, Tiago Franc¸a Melo de Lima3, Nildimar Alves Hono´rio4,5, Cla´udia Torres Codec¸o2
1Fiocruz, Po´s-Graduac¸ão em Epidemiologia em Sau´de Pu´blica, Escola Nacional de Sau´de Pu´blica Se´rgio Arouca (ENSP), Rio de Janeiro, RJ, Brazil,2Fiocruz, Programa de Computac¸ão Cientı´fica (PROCC), Rio de Janeiro, RJ, Brazil,3Laborato´rio de Engenharia e Desenvolvimento de Sistemas (LEDS), Departamento de Computac¸ão e Sistemas (DECSI), Instituto de Ciências Exatas e Aplicadas (ICEA), Universidade Federal de Ouro Preto (UFOP), João Monlevade, MG, Brazil,4Fiocruz, Instituto Oswaldo Cruz (IOC), Laborato´rio de Mosquitos Transmissores de Hematozoa´rios, Rio de Janeiro, RJ, Brazil,5Fiocruz, Nu´cleo Operacional Sentinela de Mosquitos Vetores (Nosmove), Rio de Janeiro, RJ, Brazil
☯These authors contributed equally to this work. *[email protected]
Abstract
Human mobility, presence and passive transportation ofAedes aegyptimosquito, and envi-ronmental characteristics are a group of factors which contribute to the success of dengue spread and establishment. To understand this process, we assess data from dengue national and municipal basins regarding population and demographics, transportation net-work, human mobility, andAe. aegyptimonitoring for the Brazilian state of Acre since the first recorded dengue case in the year 2000 to the year 2015. During this period, several changes in Acre’s transport infrastructure and urbanization have been started. To recon-struct the process of dengue introduction in Acre, we propose an analytic framework based on concepts used in malaria literature, namely vulnerability and receptivity, to inform risk assessments in dengue-free regions as well as network theory concepts for disease inva-sion and propagation. We calculate the probability of dengue importation to Acre from other Brazilian states, the evolution of dengue spread between Acrean municipalities and dengue establishment in the state. Our findings suggest that the landscape changes associated with human mobility have created favorable conditions for the establishment of dengue virus transmission in Acre. The revitalization of its major roads, as well as the increased accessi-bility by air to and within the state, have increased dengue vulneraaccessi-bility. Unplanned urbani-zation and population growth, as observed in Acre during the period of study, contribute to ideal conditions forAe. aegyptimosquito establishment, increase the difficulty in mosquito control and consequently its local receptivity.
a1111111111 a1111111111 a1111111111 a1111111111 a1111111111 OPEN ACCESS
Citation:Lana RM, Gomes MFdC, Lima TFMd, Hono´rio NA, Codec¸o CT (2017) The introduction of dengue follows transportation infrastructure changes in the state of Acre, Brazil: A network-based analysis. PLoS Negl Trop Dis 11(11): e0006070.https://doi.org/10.1371/journal. pntd.0006070
Editor:Roberto Barrera, Centers for Disease Control and Prevention, Puerto Rico, UNITED STATES
Received:July 4, 2017
Accepted:October 25, 2017
Published:November 17, 2017
Copyright:©2017 Lana et al. This is an open access article distributed under the terms of the Creative Commons Attribution License, which permits unrestricted use, distribution, and reproduction in any medium, provided the original author and source are credited.
Author summary
The present ecological study is aimed at characterizing introduction and spread of dengue in the state of Acre, located in Brazil’s north region. We use sociodemographic and ento-mological data from the year 2000, when the first case was registered in Acre, up to 2015, when it was already endemic in most of the state. We use a methodological framework based on well-established concepts in malaria literature, namely vulnerability and recep-tivity, to assess dengue introduction and propagation in the study area. We make use of effective reproduction number as an empirical indicator of dengue outbreak spatiotempo-ral patterns, as well as complex network theory concepts applied to human mobility and transport infrastructure changes to address dengue importation probability from other Brazilian states and its circulation within Acrean municipalities. On the one hand, we show that the increase of airline passengers, coupled with observed dengue incidence in Brazil, has steadily increased Acre’s vulnerability to dengue introduction, while transport infrastructure development has facilitated its spread within the state. On the other hand, socio-demographic changes aimed at urbanization and economic development have increased receptivity to its main vector, theAedes aegyptimosquito. The combination of those two factors ultimately leads to the establishment of the virus in Acre.
Introduction
The worldwide spread of dengue fever has been attributed to human mobility [1] as well as the passive transportation of its vectorAedes aegypti, a mosquito with autonomous flying capacity [2,3]. According to the literature, the global spread of dengue from Africa to Asia and the Americas was historically caused by the periodic human voyages across the oceans [4,5]. God-ding [6] further described outbreaks of dengue aboard ships. More recently, in a local survey in Iquitos, Peru, Stoddard et al. [1] showed that the movement of humans to places where con-tact with mosquitoes was probable was determinant for the transmission of dengue, regardless of the distance between people’s place of residence. On a collective scale, spatial patterns of dengue distribution are determined by the social networks, since an individual’s routine move-ments are similar to those of their contacts [1].
More recently, increased air transportation also contributed to dengue spread, carrying both infected humans and mosquitoes to distant places. There are reports of catchingAe. aegyptiwithin aircraft that landed in cities where there were no records of dengue cases [7]. Several studies of disease dispersion have used airline database and human mobility networks coupled with epidemiological models to provide mathematical frameworks for the study of spatiotemporal dispersion [8,9], risk assessment of case importation during outbreaks [10] and estimation of potential invasion routes [11,12]. Such frameworks have been applied to a variety of illnesses such as the 1968-69 Hong Kong [8] and the 2009 H1N1 influenza pandem-ics [13], the 2013 MERS-CoV epidemic [14], the 2014 Ebola outbreak in West Africa [15–17], and the 2016 Zika outbreak in the Americas [18], for instance.
In Brazil, reports of diseases compatible with dengue date back to the 19thcentury [19,20], but its circulation was interrupted in conjunction with the urban yellow fever after the intense Ae. aegyptieradication campaigns in the early 20thcentury. After the re-invasion of the mos-quito in the 1970s, the reintroduction of dengue viruses was laboratory confirmed in 1982 in the state of Roraima. In 1986, after four years without records of dengue cases, a DENV-1 epi-demic settled in Rio de Janeiro with fatal cases confirmed in the laboratory [21,22]. Since Funding:This work was funded by grants #E-26/
102.287/2013 from Fundac¸ão de Amparoà Pesquisa do Estado do Rio de Janeiro – FAPERJ (www.faperj.br), Conselho Nacional de Desenvolvimento Cientı´fico e Tecnolo´gico - CNPq (www.cnpq.br) #305553/2014-3, #454665/2014-8. MFCG was supported by fellowship #BJT 314164/2014-6 from Conselho Nacional de Desenvolvimento Cientı´fico e Tecnolo´gico. RML was supported by PhD fellowship from Brasil Sem Mise´ria Program of Coordenac¸ão de
Aperfeic¸oamento de Pessoal de Nı´vel Superior (www.capes.gov.br). The funders had no role in study design, data collection and analysis, decision to publish, or preparation of the manuscript.
then, dengue became endemic in Brazil, with the circulation of all four serotypes, and mostly concentrated in the southeast region.
Among the Brazilian states, the northwesternmost state of Acre, in the Amazon region, was the last to register dengue cases. The Amazon region is one of the last frontiers of development in Brazil. At its western extreme, Acre occupies a strategic, but underdeveloped, place of inte-gration in South America due to its geographical position in relation to the Pacific Ocean and its triple border with Peru and Bolivia. In the last 15 years, Acre has been the target of diverse and intensive government programs aimed at boosting its development. Examples of such pro-grams are agrarian reform with the creation of several settlements; paving of roadways and expansion of airports [23,24]; the stimulus to new economic activities; and strengthening the exchange of commodities between Brazil and the Pacific countries by means of the Pacific road, completed in 2010. In response to these investments, the population of some municipali-ties doubled from the year 2000 to 2010, and the percentage of urbanization increased in 20 of its 22 municipalities [25]. It was during this period that the introduction and spread of the den-gue virus in the state was observed, almost 20 years after its introduction and establishment in the country [21].
We hypothesize that the rate and pattern of dengue introduction and establishment in the 22 municipalities of Acre were directly affected by the fast changes in infrastructure and urbanization. In this paper, we reconstruct the history of dengue introduction and establish-ment in Acre, linking the epidemiological events to the evolution of human mobility within the state, and between the state and the rest of the country. In this process, we propose an analytical framework to inform (to be used in) risk assessments in other dengue-free regions under similar development pressure.
The goal of this study was to assess how the risk of dengue establishment varied from 2000 to 2015 in the 22 cities of Acre, as the region changed in response to significant investments in infrastructure and migration. For this purpose, we: 1) assessed how vulnerability (defined in the next section) to dengue importation from outside the state changed during the study period and identified the most likely sources of dengue to Acre; 2) assessed the relationship between vulnerability to dengue within Acre, measured by rate of establishment, and munici-palities’ centrality in terms of human mobility; 3) assessed available evidence on Acre’s recep-tivity to dengue (defined in the next section) and how it changed during the study period.
Conceptual framework
The successful invasion of a parasite into a new place is the result of the interaction between two players: the invading species and the invaded community. In the context of dengue, the invaded community is composed of two main species: human hosts and mosquitoes of the spe-ciesAe. aegyptiwhose interaction is further affected by environmental factors (climate, urbani-zation, human behavior). The invading species under consideration, dengue viruses, cannot establish itself in new areas unless the receiving community presents certain conditions to sus-tain autochthonous virus transmission. More formally, the emergence of dengue fever in a new region depends on the occurrence of two major events: (i) the arrival of at least one infected individual in the city and (ii) the subsequent positive growth of autochthonous den-gue cases (i.e., disease establishment) [26].
as the expected number of secondary human cases that would result from the arrival of a single infected individual in a susceptible population. A reproductive number greater than one sug-gests epidemic growth.
The larger the influx of imported cases the higher the probability of establishment given the necessary environmental conditions. In the malaria literature, this exposure to imported cases is referred to as “Vulnerability” defined as “either proximity to endemic areas or. . .the frequent
influx of infected individuals or groups and/or infective anopheles” [28]. The same concept can be applied to dengue epidemiology. Dengue influx might be measured directly from the num-ber of cases that can be traced to outside areas (imported cases). In situations where the origin of the cases is difficult to ascertain, one can estimate the number of imported cases from statis-tics of transportation and prevalence in passengers’ origins [26].
Materials and methods
Study area
The state of Acre (AC) is located in the north region of Brazil, bordering the countries of Peru and Bolivia, and the Amazonas and Rondoˆnia states in Brazil (seeFig 1for geographical refer-ence). The total area is 164,122 km2with a population of 733,559 inhabitants and a population density of 4.47 hab/km2[25]. The state has 22 municipalities, the most populous being the cap-ital Rio Branco and Cruzeiro do Sul, with 336,038 and 78,507 inhabitants according to 2010 Census [25], respectively. The Acrean climate is warm and humid equatorial, which is charac-terized by high temperatures with small annual fluctuations, high pluviometric precipitation indices and high relative humidity. The temperature is approximately uniform throughout the state, with an annual average around 24,5˚C, and maximum around 32˚C [24].
Data
Dengue national data. Monthly counts of reported cases of dengue per Brazilian state, from 2001 to 2012, were obtained fromDepartamento de Informática do Sistema Único de Saúde(DataSUS, Department of Informatics of Universal Health System,http://datasus.saude. gov.br/). The accumulated number of cases in each state during the period of study is shown inFig 1.
Dengue municipal data. Weekly counts of reported cases of dengue per Acrean munici-pality, from 2000 to 2015, were provided by the Brazilian Ministry of Health. Dengue reporting is mandatory in Brazil, but most cases are defined using clinical-epidemiological criteria only.
Definition of dengue epidemiological year. Since dengue reaches higher activity levels during the summer (Dec to March), it is more convenient to define the epidemiological year as the period between July of a year and June of the next year, as opposed to the standard calen-dar year.
Aedes aegyptidata. Available data regarding the presence ofAe. aegyptiin the 22 munici-palities of Acre was obtained from the Ministry of Health (MH) and internet bulletins. Although MH has implemented the household larval survey (LI) and the Rapid Assessment of Infestation byAe. aegypti(LIRAa) since 1996, not all municipalities adhered to the protocol at the same time. We searched the available information to identify the year in which the pres-ence of the mosquito was confirmed for the first time in each municipality. It is important to note, however, that this information can be incomplete for some cities, and the first detection does not necessarily imply that the mosquito was not present before.
municipality in Acre, in 2000 and 2010, as well as information on the proportion of households with access to public services and other demographic variables were obtained from [25].
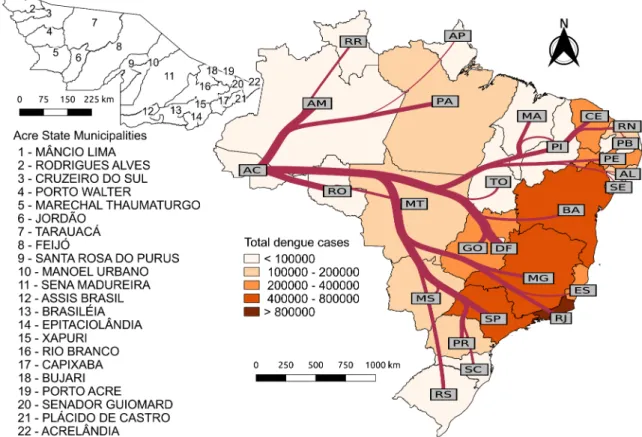
Transportation network. To describe the Acrean transportation system, data regarding the availability and status of roads, waterways, and airways was obtained from the Ministry of Transport (http://www.transportes.gov.br),Agência Nacional de Aviação Civil(ANAC, National Civil Aviation Agency,http://www.anac.gov.br) andAssociação dos Municípios do Acreanos(AMAC, Association of Acrean Municipalities,http://www.amac-acre.com.br). Description of road status was obtained by request to theDepartamento de Estradas e Rodagens do Acre(DERACRE, Department of Roads and Roadways of Acre) and by consulting the website of thePrograma de Aceleração do Crescimento(PAC, Growth Acceleration Program, http://www.pac.gov.br/). The connections between municipalities—i.e., the network edges— were classified according to the presence and status of roads, waterways, and airways. In the cases where municipalities were connected by more than one modal, this was taken into account by including all corresponding edges. Road status was tentatively classified year by year. However, since not all information was recorded every year, it is only an approximation. The combination of modal type and road condition resulted in the following categories: (1) unpaved road, (2) paved road and (3) road under maintenance; (4) waterway; and (5) airway. Fig 1. Dengue cases in Brazilian states and airline flow to the state of Acre.The map is colored according to the total number of reported dengue cases in each state during the period of this study (from dengue epidemiological year 2001/2002 to 2011/2012). The left panel shows the municipalities of the state of Acre. The network over the country map on the right panel represents the flow of airline passengers to Acre from each state. Edges widths are proportional to the logarithm of the total number of passengers from 2001/2002 to 2011/2012. The underlying shapefiles with political boundaries of Brazilian states and municipalities used to build this figure are publicly available and free to use atInstituto Brasileiro de Geografia e
Estatı´stica(IBGE, Brazilian Institute of Geography and Statistics) websitehttp://downloads.ibge.gov.br/downloads_
geociencias.htm.
The third category encompassed roads under restoration, under construction and mixed conditions.
Flight data. To describe the flow of individuals to Acre, airline data from 2001 to 2012 was provided by ANAC. This dataset contains information on the origin-destination for pas-sengers on direct flights (with or without stoppage). For those on connecting flights, ANAC provides the number of travelersin transitper airport pair. We developed a methodology to combine the data regarding direct flights and passengers in transit to estimate the total number of passengers that travel between all possible airport pairs (seeS1 Appendix). The total number of passengers to Acre by state of origin during the period of study is depicted inFig 1.
Commutation data (Mobility). To obtain an estimate of the flow of individuals between municipalities in Acre, we used data from the 2010 Brazilian Census [30]. In this dataset, respondents were asked to provide the country, state, and municipality of work/study. A frac-tion of them did not provide full informafrac-tion, that is, they menfrac-tioned working outside their municipality of residence, but with no further specification of state or municipality; some only provided destination state, but no specification of the municipality. To compensate for that, for each city of residence we aggregated all entries with the same level of information, (i) dis-placement only, (ii) destination state only, and (iii) complete information. With that, we pro-portionally assigned a destination municipality based on the distribution for the particular subset of the entries with full information.
Themobility networkis built from the combination of commutation and flight data. In this network, each municipality is represented by a node while edges represent the average daily flow of individuals between pairs. To estimate this quantity, we summed the estimated daily number of residents moving from one municipality to another for work and/or study over the year, given by the commutation data, with the average daily number of flight passengers in 2010.
Assessing how Acre’s vulnerability to dengue importation changed from
2001 to 2012
Within our conceptual framework, vulnerability was defined in terms of the exposure of the focal population to imported dengue cases. Here, we measured vulnerability as the expected probability of dengue importation from other Brazilian states into Acre, by air transportation.
The usage of national airline passengers database is of great interest for the study of human interaction dynamics within a country, particularly for the study of potential disease transmis-sion routes. The flow of individuals between different regions allows agents that became infected in one area to carry the pathogen to another area within his/her path [8,11,17,18,26, 31]. This mechanism serves as a driver for the (re-)introduction of pathogens throughout the national territory. In this context, we analyzed Brazilian airline grid to estimate passenger flow between Brazilian states and how this potential risk for the spreading of dengue to Acre varied since the year 2000.
From the Brazilian airline database collected from 2001 to 2012, we estimated the daily probability of an individual from stateitraveling to statejfor each monthm,πij,m(seeS1 Appendix). Coupling this probability with the reported number of dengue cases in each state in the corresponding time window, we estimated the risk of each one state being the source of an imported dengue case to any other in the Brazilian territory. This framework allows us to estimate the most probable routes of case importation in each year to Acre.
infected individual boarding a flight during his infectious period. Combining this information, the monthly case importation probabilitypij,mcan be estimated as
pij;m ¼1 ð1 pij;mÞ
Pki;m
k¼1
tk
: ð1Þ
Following the same rationale, the yearly probability of dengue importation,Pij,s, at dengue epi-demiological years, can be estimated by aggregating over all months of the corresponding epi-demiological year, that is
Pij;s ¼1
Y
m
ð1 p
ij;mÞ: ð2Þ
This construction allows us to provide a ranking of states by their probability of exporting a dengue-infected individual to Acre, that is, the most probable sources of case importation at any given epidemiological year. It also allows us to estimate the source-independent yearly dengue importation probability, that is, the probability of at least one importation to Acre in a given year regardless of its state of origin, which can be written as:
Pj;s ¼1
Y
i
ð1 P
ij;sÞ ð3Þ
This quantity describes the temporal dynamics of the Acre’s overall exposure to dengue-infected individuals. To take into account the uncertainty regarding the length of the infectious period, the results shown correspond to the average over 1000 simulations of this process using a gamma distribution with mean of 4.5 and 95% confidence interval of [1.9–7.9] for the infectious period of each reported case.
Establishment of dengue transmission in the Acrean cities
The earliest evidence of the onset of disease establishment is the occurrence of autochthonous cases, which are ascertained based on investigations of the travel history of the patients. Sec-ondly, the presence of clusters or transmission chains is indicative of further transmission. Thirdly, if the transmission is sustained, the incidence curve will increase at an exponential (or subexponential) rate, characterizing an epidemic [33]. The available dengue notification data do not have information on travel history or clustering of the reported cases. Here, evidence of transmission is indirectly obtained from the notification data via the calculation of the effective reproductive number,Rt. This index is interpreted as the average number of secondary cases generated by a primary case at timet[34], calculated as the ratio of secondary to primary cases. A value ofRt>1 indicates a sustained growth of incidence. Since no information is available on who infected whom, the primary cases are inferred from the generation interval of dengue, that is, primary cases are those that could be the source of transmission for the current cases given the time between the onset of their disease symptoms. This approach formally described by Wallinga & Lipsitch [34] results in the following expression forRt:
Rt ¼P1 bðtÞ a¼0bðt aÞgðaÞ
; ð4Þ
The effective reproductive numberRtwas calculated weekly for each city, from 2000 to 2015. For each city, an epidemiological year was classified as epidemic ifRt>1 for at least three consecutive weeks. A period of 3 weeks was chosen because it represents one generation of dengue transmission. We further definedT3as the time in weeks from July 2000 to the first observation of three consecutive weeks withRt>1 in that city.
Assessing how vulnerability to dengue importation changed from 2000 to
2015 at the Acrean municipalities in response to changes in the
transportation network
In 2001, Acre witnessed its first dengue epidemic, in Rio Branco. Since then, dengue cases have been recorded almost continuously and with great intensity in this municipality. Here we investigate if the spread of dengue from Rio Branco to other municipalities in Acre was associ-ated with the transportation network. First, we investigate if more central cities were invaded earlier than peripheral ones, where centrality is defined as a property of the transportation net-work (defined below). Secondly, we assessed whether cities closer to Rio Branco were invaded before distant ones.
A structural transportation network was constructed as a graph with 22 nodes representing the municipalities and 29 edges representing the connections between them by (paved, unpaved or under maintenance) roads, waterways or airways, as described in the data subsec-tion. In this network, the edges were considered as unweighted for most of the centrality met-rics defined below. The only exception made was for the distance in kilometers from Rio Branco, in which case each edge received a weight equal to the corresponding distance between the connected nodes. We also constructed a mobility network with the same 22 nodes but with a total of 87 edges. As described in the mobility data subsection, in this network the edges are given weights equal to the sum of residents moving from one municipality to another for work and/or study in both directions.
There are several measures of node centrality, the literature being rich with proposals for both weighted and unweighted networks [36]. Each of those proposals focuses on a different aspect of information flow and node properties, therefore producing potentially different node ranks for each measure [37,38]. Here, we considered the following centrality measures that provide different interpretations in relation to dengue exposure:
• Betweenness centrality(BandBw): in both unweighted and weighted networks, a node with high betweenness centrality is expected to have a stronger role in the dissemination of information in the network, acting as a bridge between different nodes that are not directly connected. Therefore, they should have higher exposure to infectious diseases and likely contribute to its dissemination in the network. This centrality measure is usually more relevant in large, sparse networks, where those nodes act as bridges between differ-ent regions of the network. As defined in [39], betweenness cdiffer-entrality measures the rele-vance of a node regarding how many shortest paths in the network include that node.
We computed an unweighted betweenness measurement (B) for each node based on the
of nodei,B(i), is given by:
BðiÞ ¼X m;l
sm;lðiÞ
sm;l
: ð5Þ
We also computed a weighted betweenness centrality (Bw) using the concept ofeffective distance[11] to calculate the shortest path between pairs of nodes in the mobility network. Using this definition, the shortest path between any pair is related to the conditional prob-ability of individuals moving through a particular path between that pair. As defined in [11], the effective distance between any pair of nodes can be obtained through the follow-ing steps:
First of all, for each connected pair of nodesiandj, with number of travelers fromitoj given bywij, define the conditional probability of moving fromitoj, given that a person moves fromi, as
pi;j¼
wij
P
mwim
: ð6Þ
From that probability, we define the effective distance between connected nodesiandjas
deffði;jÞ ¼ ð1 logðpijÞÞ: ð7Þ
From this definition of distance, the length of an ordered path,Lk0;k1;...;kn, between any pair of nodesk0=mandkn=l, comprised ofnedges, is the sum of the effective distance over each connected pairi,jon that path:
Lk0;k1;...;kn ¼n log
Yn 1
i¼0
pkiki
þ1: ð8Þ
The shortest path in effective distance between nodesmandlis then defined as that with the shortest lengthΛm,. . .,l. That is,
seff;m;l ¼minðLm;...;lÞ: ð9Þ
Finally, the weighted betweenness centralityBw(i) is computed in the same way as inEq 5, where the shortest path is obtained from the effective distance definition as inEq 9.
• Closeness centrality (C and Cw): measures how fast information can flow from a node to all other nodes in the network [37,38,40]. In our context, it translates into how fast the patho-gen can reach all nodes from a single source based on human mobility. In the case of the unweighted transportation network, for each nodei,C(i) was calculated as the inverse of the sum over the unweighted shortest path distance between nodeiand all other nodes in the network. The unweighted shortest path distanced(i,j) from nodeitojis simply the mini-mum number of edges forming a path along connected nodes betweeniandj.
The closeness centralityC(i) is given by
CðiÞ ¼P 1 jdði;jÞ
: ð10Þ
nodes. Therefore, the higher the number of travelers in a given edge, the shorter the distance between them. The weighted shortest path distance,dw(i,j), is then the connected path with the lowest sum over the weighted distance between each pair on that path. Finally, the weighted centrality of nodei,Cw(i) is the inverse of the sum overdw(i,j) fromito every other node in the network, analogous toEq 10. Therefore, the higher the number of passen-gers in the shortest paths from a node, the higher its closeness centrality.
• Strength centrality (Sw): this measure is the weighted analog of degree centrality, which is simply the node degree. For weighted networks, strength centrality measures the intensity of the connections of a node, not only their number [41]. Here,Swwas calculated as the total number of people regularly commuting to a given city for work or study. The higher a node’s strength, the more it shares individuals with neighboring nodes, potentially increas-ing its exposure to infected agents present in its network vicinity.
• Eigenvector centrality (Ew): as defined by Bonacich [42], the centrality of a node is defined by the centrality of its neighbors. Therefore, the centrality of a node can be measured by the combination of its connectivity and that of its neighbors. In this sense, the more connections a node have with highly connected nodes, the more likely it is to be exposed to infected agents from a random source. In the case of weighted networks, a node will have high eigen-vector centrality (Ew) if it has strong connections with highly connected nodes taking into account the weight of those edges. The weight used for this centrality measure is the number of travelers between nodes.
From the weighted adjacency matrixW, the eigenvector centralityEw(i) of each nodeiis given by theithentry of the eigenvector corresponding to the largest eigenvalue of matrixW.
• Network Distance from Rio Branco (D, Dw): Rio Branco is the municipality with the strongest communication with the rest of the country. The closest (farthest) a node is to Rio Branco, the faster (slower) should be for infection from outside the state of Acre to reach this node once it is introduced in Rio Branco [43]. From structural transportation network, we com-puted thedistance in degrees from Rio Branco (D)to a given nodeias the unweighted shortest path distance from Rio Branco to that municipality. For the mobility network, we computed theeffective distance from Rio Branco, Dwto each nodei, which relates distance with the probability of individuals flowing from Rio Branco to the target node in 2010. For the calcu-lations ofD, two edges were disregarded: the waterway connections between RB-Xpr (Rio Branco-Xapuri) and Xpr-Brl (Xapuri-Brasile´ia), because they have weak traffic [44] in com-parison to the roadway route.
• Distance in kilometers from Rio Branco (Dk): this measure is calculated as the sum of kilometers in each of the edges in the shortest path from Rio Branco to each target node in the structural transportation network. In the case of connections where both terrestrial and pluvial routes were available between a pair of nodes, we used the former since it is the most frequently used.
dengue in the state occurred first in the nearest municipalities in terms of distance and with better road structure.
The analysis were performed in software R 3.3.2 (R Core Team, 2016, cran.r-project.org/) and in Python 3.5 (Python Software Foundation,www.python.org) using the libraries Net-workx [45], Pandas [46], Numpy [47], and igraph [48].
Receptivity of the Acrean cities to dengue transmission
Receptivity depends on the presence, abundance and vectorial capacity of the local population ofAe. aegypti. Moreover, dengue receptivity has been linked to unplanned urbanization, fast population growth, poor infrastructure as lack of urban services and effective mosquito con-trol, and globalization [49]. Here, we review the available information on these topics in order to provide the best description possible for the evolution of dengue receptivity in the study period. First, we investigated the available records ofAe. aegyptipresence in the region using LI/LIRAa. From this data, we computed the year whenAe. aegyptiwas first recorded in each municipality.
Secondly, we computed how much each municipality changed from 2000 to 2010, in terms of population growth, urbanization, garbage collection, water supply and sanitary sewage.
We also reviewed the scientific literature searching any biological information regarding the vector populations found in Acre. The literature is scarce, and a single study was found on the competence of AcreanAe. aegyptito DENV-2 [50].
Results
Vulnerability to dengue importation to Acre
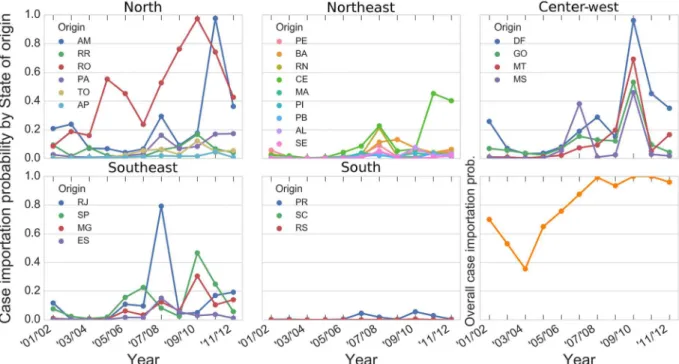
From 2001 to 2012, the overall flow of passengers to Acre increased from about 50,000 to more than 150,000 passengers per year. During this period, the main states of origin for travelers to Acre were Distrito Federal (DF), Rondoˆnia (RO), Amazonas (AM) and São Paulo (SP) (Fig 1). Meanwhile, the states of Rio de Janeiro (RJ), São Paulo, Minas Gerais (MG) and Bahia (BA) had the highest dengue cases recorded. As discussed in the methods section, the probability of case importation to Acre is a combination of both the number of travelers and dengue activity. Fig 2shows the probability of dengue case importation into Acre from 2001/2002 to 2011/ 2012. It reached ca. 70% in 2001/2002, reducing to its lowest level (38%) in 2003/2004, steadily increasing to ca. 100% from 2004/2005 to 2007/2008, remaining so until the end of the study period. The north region was found as the main source of dengue cases to Acre, in particular, the neighboring state of Rondoˆnia (RO), followed by the center-west (Distrito Federal-DF and Mato Grosso-MT), southeast (Rio de Janeiro-RJ and São Paulo-SP), and northeast (Ceara´-CE). The contribution of Rondoˆnia, Distrito Federal and Mato Grosso to the exportation of dengue to Acre was mainly associated with the flow intensity between these states while that of Rio de Janeiro and São Paulo was a result of the combination of moderate flow intensity and high rates of dengue activity. Others states such as Tocantins (TO), Roraima (RR) and Amapa´ (AP) in the north, Maranhão (MA), Piauı´ (PI), Paraı´ba (PB) and Alagoas (AL) in the east and all states in the south region were unlikely exporters of dengue cases to Acre due to the combi-nation of low flow and low dengue activity.
Dengue establishment in the Acrean municipalities
there was a significant increase in dengue incidence in Acre when it tripled to an alarming level of 2,800 cases per 100,000. In 2010, dengue incidence was even higher: 4,793.3 cases per 100,000 [51]. According to the Ministry of Health, in 2011, Acre was among the states classi-fied as at moderate risk, and within the state, the capital Rio Branco was classiclassi-fied as at the highest risk [52]. On the other hand, the Alto Jurua´ region, in the northwest of Acre, which until 2014 had not yet registered autochthonous cases of dengue, witnessed its first dengue epi-demic in Cruzeiro do Sul. In 2014, Cruzeiro do Sul was among the municipalities with the highest number of dengue cases between the epidemiological weeks 01 and 47 of 2014. Com-pared to 2013, the number of cases jumped from 30 cases to 23,130 [53,54].
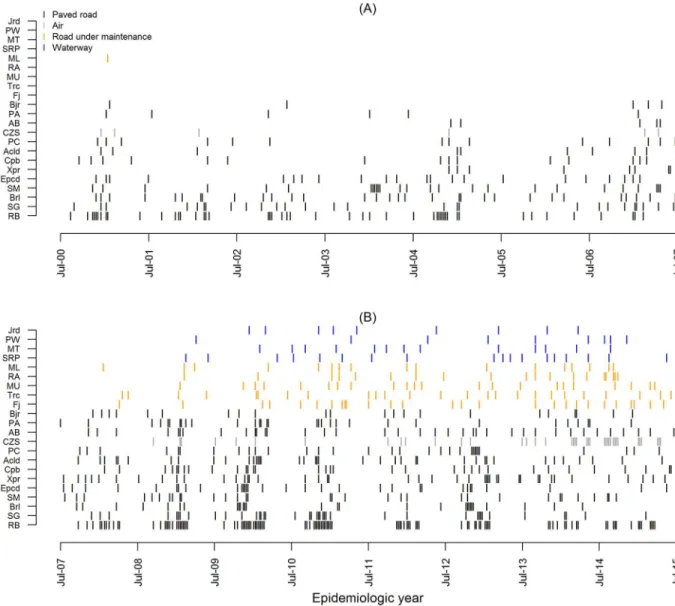
InFig 3we show the weeks withRt>1, from 2000 to 2015 at each Acrean municipality. A sequence of weeks withRt>1 is an indication of epidemic growth. All municipalities pre-sented this event at least once during the study period. The municipalities that prepre-sented the lowest percentages of weeks withRt>1 were Porto Walter (PW) and Jordão (Jrd) (1.15% for both) throughout the study period. These are the two most peripheral in the state, and whose access includes a stretch traveled by river. The ones with the highest percentages of “epidemic weeks” were Rio Branco (RB, 9.32%), Senador Guiomard (SG, 6.39%), Epitaciolaˆndia (Epcd), and Brasile´ia (Brl) (6.00% for both).
InFig 3, colors indicate the main type of access to each city. There are two main types of access, those cities in which access is by road (black and orange) and those in which the final access is by waterway (blue). Before 2008/2009, only cities in which access is by road registered Rt>1. However, these records were mostly intermittent, as can be seen for example in Bujari (Bjr), Capixaba (Cpb), Assis Brasil (AB), Porto Acre (PA), Acrelaˆndia (Acld), Pla´cido de Cas-tro (PC) and Xapuri (Xpr). Cruzeiro do Sul (CZS) in gray, which is the only city served by an airline to Rio Branco, also registered few weeks withRt>1 before 2008. After this year,
Fig 2. Probability of at least one dengue-infected individual traveling to Acre by state of origin during his/her infectious period, per year.Each panel refers to states within each Brazilian geopolitical Region. The panel on the bottom right shows the overall probability of at least one case importation, regardless of state of origin, as inEq 3.
when several paving works and road maintenance were concluded, the frequency increased eventually becoming more intense culminating with CZS recording the first sustained epi-demic in 2014. The time frame of infrastructural changes and its potential impact on dengue cases notification is discussed in more detail in the section Dengue spread in Acre. The munic-ipalities in orange, Maˆncio Lima (ML), Rodrigues Alves (RA), Tarauaca´ (Trc) and Manoel Urbano (MU), also have access by road, but part of the final access was under construction or maintenance during all or almost all the period of study. In these municipalities, as well as in those with final access by waterway, the first records ofRt>1 occurred in the beginning of 2008, in a slow way, while in those cities with access by waterway, the records were even rarer than those accessible by roads.
Fig 3. Weeks withRt>1 from July 2000 to July 2015.(A) Weeks withRt>1 from July 1st, 2000, to June 30th, 2007. (B) Weeks with
Rt>1 from July 1st, 2007, to June 30th, 2015. Each line on the vertical axis corresponds to a municipality in the state of Acre. Black: municipalities accessible by paved roads during all or almost all the time of the study. Gray: city (CZS) served by airline from Rio Branco. Orange: municipalities partially or totally accessible via unpaved or under maintenance roads. Blue: municipalities whose access necessarily include waterways. Refer toTable 2for municipalities’ name.
Vulnerability to dengue importation within Acre
Public investments since 2000 in the development of the Acrean transportation infrastructure, including the construction of the Pacific Highway and the pavement of intermunicipal roads, have brought more connectivity between the municipalities, in particular within southeast Acre, composed by Rio Branco, Senador Guiomard, Capixaba, Xapuri, Epitaciolaˆndia, Pla´cido de Castro, Brasile´ia, and Acrelaˆndia. In contrast, transportation and mobility between the southeast and other regions of Acre (Alto Jurua´) is still very difficult due to road conditions, although improvements have occurred during this period. The accessibility to the northwest area of Acre began to improve after the year 2008, when paving of the highway BR-364 in the region of Manuel Urbano (MU) and Feijo´ (Fj), in the central area of Acre. Highway BR-364 is the only one that crosses the state from Acrelaˆndia (Acl, in the southeast) to Maˆncio Lima (ML, in the northwest) and connects Acre to the rest of Brazil via Rondoˆnia state.
Highway BR-364 has been under construction since the beginning of the last decade. In southeast Acre the paving and restoration of this highway were completed quickly, and only the stretch from Acrelaˆndia to Rio Branco was still under construction until 2007/2008. The stretch from the capital to Cruzeiro do Sul, at the northwest part of the state, passes through very unstable soil, making it difficult to maintain during the monsoon season. Only in 2012/ 2013, this stretch was completely paved, but in the following years repairment works were needed. Besides this highway, an extremely important link between the southeast and north-west Acre is the daily flight between Rio Branco and Cruzeiro do Sul, which increased by 18% from 2001 to 2012. The most remote municipalities are Santa Rosa do Purus, Jordão, Marechal Thaumaturgo and Porto Walter with very limited access and only by river, most of them only by small and medium-sized vessels depending on the time of year. On the other hand, air travel alone was responsible for an average of 134 passengers to Acre per day during the epide-miological year 2001/2002, steadily increasing to almost 500 per day in 2013/2014, most of them to Rio Branco, responsible for approximately 90% of all air travel to Acre from other Bra-zilian states. To illustrate the impact of interstate airflow in this population, the 2010 Census registered 3.6 thousand commuters to Rio Branco, so that the average daily out-of-state air passengers corresponded to almost 4% of daily commuters in 2001/2002, up to almost 14% in that of 2013/2014. This data contrasts with the common misconception regarding air travel to Acre and its impact to information inflow, which is believed to be negligible due to its rela-tively low volume with respect to the rest of the Country.
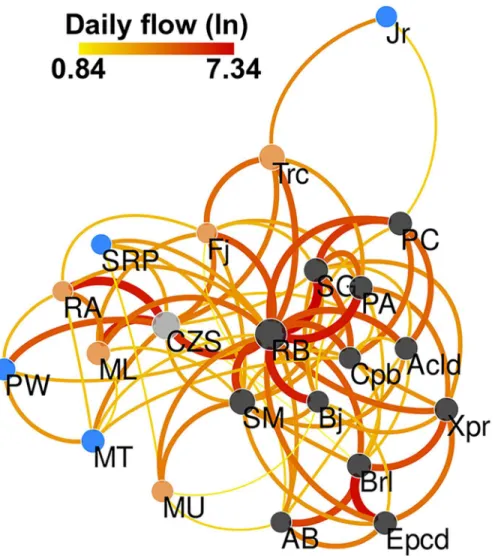
mobility network, suggesting an intuitive relationship between ease of access (transportation network) and the number of travelers (mobility network). Municipalities accessed by paved roads are more densely connected with each other, while the strong connection between Rio Branco and Cruzeiro do Sul, which are connected by airports, considerably shortens the effec-tive distance between east and west side of the state. Another example of this relationship is the fact that municipalities which are mainly accessed via waterways are peripheral in the mobility network. In fact, Marechal Thaumaturgo (MT), Jordão (Jrd) and Santa Rosa dos Purus (SRP) have the lowestEw,CwandSwcentralities, with Porto Walter (PW) also among the five municipalities with lowest values for those centralities.
travelers (Sw). Therefore, it is both the most vulnerable to exposure from a pathogen present in the state at a random municipality, as well as the node which poses the highest impact in other municipalities’ vulnerability once infected. Porto Acre, Bujari and Senador Guiomard, all with geographical borders with Rio Branco, also present high centrality measures, therefore sharing similar relevance to disease transmission. All of those cities are located on the east side of the state, and all of them can be accessed via paved federal highway.
Another municipality with high centrality for most indicators is Cruzeiro do Sul (CZS), on the west side of Acre. Although geographically distant from Rio Branco, this municipality shares an airport connection with the capital, drawing a significant amount of travelers and therefore shortening its network distance with respect to individual flow. Being the second most populous municipality, it also shares strong connectivity with its geographical neighbors. In fact, it has the third highest strength centrality, that is, the third municipality with highest number of travelers. Due to its connectivity to Rio Branco and its role as western hub, Cruzeiro do Sul acts as an important bridge between the capital and the western region.
Dengue spread in Acre
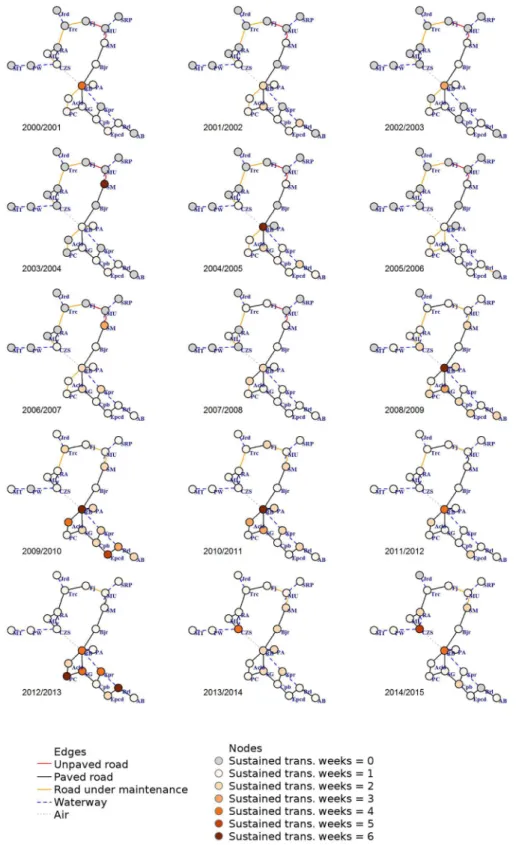
InFig 5we can observe a sequence of panels showing how dengue invaded and established itself in Acre, following the transportation network. The nodes represent the cities, colored according to the number of consecutive weeks withRt>1 per year. In this study, we consider “at least three consecutive weeks withRt>1” as a marker of (at least temporary) disease estab-lishment. Of the 22 Acre counties, nine were positive for this marker at least once during the study period despite the fact that all of them registered at least one case of dengue during this time. Until 2008/2009, only Rio Branco e Sena Madureira had evidence of disease establish-ment according to this criterion. The two cities are well connected in terms of human mobility, close regarding geographical distance, and have paved roads connecting them. At the end of the study period, other seven cities presented at least three consecutive weeks withRt>1. Of those, six are in southeast Acre, in the most connected and best-accessed region. The other city is Cruzeiro do Sul, one of the most distant cities in kilometers from Rio Branco, but populous and with an air connection to the capital.
Fig 5. Structural networks time series in epidemiologic years.Nodes (circles) are the 22 municipalities of the state of Acre in which gray nodes are municipalities withRt<1. Colored nodes are the representations of
Rt>1 by the number of consecutive weeks per year, varying in shades of orange for at least one week (lighter) to six consecutive weeks (darker), with gray color for years with no such event in any week. Edges (lines) are the direct connections between municipalities by modal type category: roads (unpaved in red, paved in black, under maintenance or construction in orange), waterway in dark blue dashed line and air in dotted gray line. This figure is provided in higher resolution in supplementary informationS1 Fig.
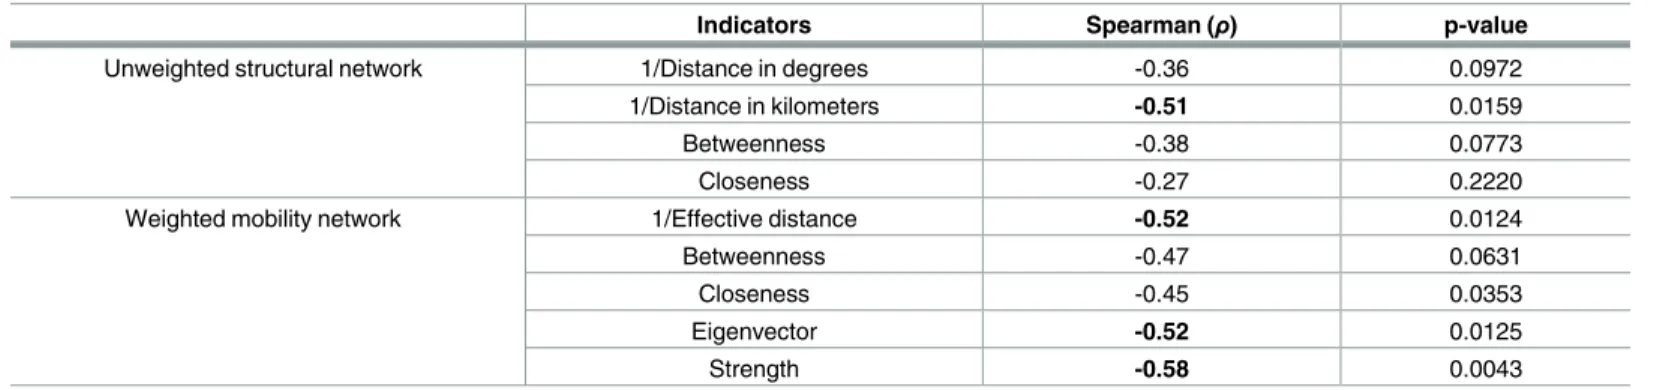
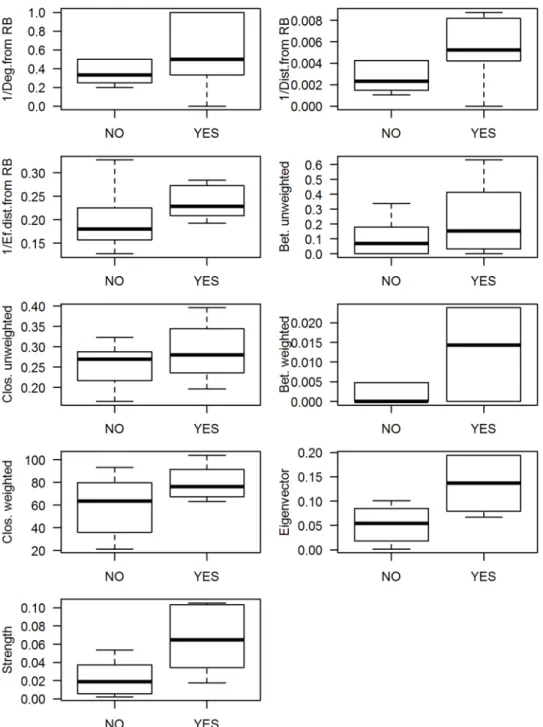
establishment during the study period and those which did not. This comparison allows for the evaluation of whether municipalities grouped by occurrence (YES/NO) are also charac-terized by significantly distinct network properties. It is possible to identify that the descrip-tors most correlated toT3were also those that differed the most between municipalities with and without dengue establishment, which are the geographical and effective distance to Rio Branco, Eigenvector and Strength centralities.
Receptivity of the Acrean municipalities to dengue transmission
The first record ofAe. aegyptiin Acre occurred in 1995 in Rio Branco [57] (Table 2). Gradually the nearest municipalities in the southeast of the state also started recording it, and in 2001, eight municipalities had confirmed the presence ofAe. aegypti. These municipalities are the same municipalities whereRt>1 was detected earlier in time, being municipalities along BR-317 (SG, Cpb, Xpr, Epcd and Brl) or with a direct connection to RB (PA) and two with good access to BR-364 since the beginning of the study (SM and Acld). From 2002 to 2006, another three municipalities reported the presence ofAe. aegypti: Pla´cido de Castro, Bujari and Assis Brasil. Bujari is the nearest neighbor of Rio Branco, butAe. aegyptipresence was not confirmed until 2006. It is difficult to ascertain the specific causes for this. On the one hand, this was a predominantly rural municipality in the early 2000’s. On the other hand, there was not a well-structured vector surveillance program implemented in small towns such as Bujari until later. Pla´cido de Castro and Assis Brasil are frontier municipalities, the former at the border with Rondoˆnia state, receiving a considerable traffic of vehicles from the highly dengue endemic neighbor state. It is reasonable to infer thatAe. aegypticould be present there previously but unnoticed. However, dengue only established itself in Pla´cido de Castro in 2012/2013, despite the consistent detection of cases since 2001. Assis Brasil is a small town at the triple frontier Brasil-Peru-Bolivia. In 2000, it had a considerably small population, which may have contrib-uted to the delayed invasion ofAe. aegypti.
Between 2007 and 2013 no other city reported the presence ofAe. aegypti. The only excep-tion being Cruzeiro do Sul, in 2008. This invasion was interrupted, however, and the mosquito was detected again only in 2013 [58]. From the municipalities to the north of Sena Madureira along the BR-364 highway, four confirmed the presence ofAe. aegyptiin 2015: Feijo´, Tarauaca´, Maˆncio Lima and Porto Walter. The first three, together with Cruzeiro do Sul, are located along the BR-364 and are important stopping points for those traveling. For the same reason, it is not possible to affirm that the mosquito was actually absent before that, since monitoring was not implemented. Five municipalities remainedAe. aegyptifree as of 2015, according to Table 1. Spearman correlation between time to dengue establishment (T3) and centrality indicators.
Indicators Spearman (ρ) p-value
Unweighted structural network 1/Distance in degrees -0.36 0.0972
1/Distance in kilometers -0.51 0.0159
Betweenness -0.38 0.0773
Closeness -0.27 0.2220
Weighted mobility network 1/Effective distance -0.52 0.0124
Betweenness -0.47 0.0631
Closeness -0.45 0.0353
Eigenvector -0.52 0.0125
Strength -0.58 0.0043
the LI/LIRAa dataset (Table 2). These are the most peripheral municipalities of Acre, and also the most rural.
Structural characteristics of Acrean municipalities can be part of the explanation for the slow invasion and establishment ofAe. aegyptiin the state. According to IBGE’s urban/rural classification, Acre is mostly a rural state, but the population of all municipalities and the per-centage of urbanization increased from 2000 to 2010. The exceptions are two, Rodrigues Alves and Assis Brasil, where total population increased as well but the urban population decreased Fig 6. Centrality measures and dengue establishment.Boxplots comparing the network descriptors of municipalities that witnessed dengue establishment during the study period and those which did not (Yes/No). Values for each Municipality are available inS2 Appendix.
[25]. Both municipalities presented an increase in the number of rural settlements [59]. Popu-lation growth, coupled with the increase in urbanization without improving the coverage of general services—such as garbage collection, water supply and sanitary sewage (Table 2) –, contribute to the fact that, even in a more rural state, the ideal conditions for establishing the mosquito are guaranteed. Those characteristics increase the difficulty in controllingAe. aegypti [50] and consequently the local receptivity.
Discussion
In the process of describing the introduction of dengue in Acre, we assessed the contribution of network metrics and reproductive numbers as indicators of vulnerability, disease establishment Table 2. Population size and urban/rural ratio in 2000 and 2010, municipalities withRt>1 for 3 consecutive weeks for epidemiological years and
first year ofAedespresence confirmed by LI/LIRAafor 22 Acrean municipalities. Municipalities Abbrev. Population
2000 Population 2010 (% increase 2000-2010) Urban/ Rural ratio 2000 Urban/ Rural ratio 2010 Garbage collec. 2010 (%) Water sup. 2010 (%) Sanitary sewage 2010 (%) Epidemiological years withT3
First year of
Ae. aegypti
confirmed by LI/LIRAa
Rio Branco RB 252885 336038
(32.88)
8.45 11.22 93 53 58 Almost every year 1996
Senador Guiomard
SG 19766 20179 (2.09) 0.78 1.70 64.2 34 24.1 2008/2009, 2010/
2011, 2012/2013
2000
Brasile´ia Brl 17013 21398 (25.77) 1.13 2.00 67.9 55.8 29.6 2009/2010, 2012/
2013
2000
Sena Madureira
SM 29412 38029 (29.30) 1.22 1.94 63.3 38.6 13.3 2003/2004, 2006/
2007
2001
Epitaciolaˆndia Epcd 11019 15100 (37.04) 2.04 2.37 68.6 60.4 21.2 2009/2010 1999
Xapuri Xpr 11952 16091 (34.63) 1.00 1.79 64.2 51.4 29.3 2012/2013 2000
Capixaba Cpb 5206 8798 (69.00) 0.41 0.81 44.2 39.1 34 - 2001
Acrelaˆndia Acld 7934 12538 (58.03) 0.79 0.89 48.8 29 11.7 2009/2010, 2010/
2011
-Pla´cido de Castro
PC 15161 17209 (13.51) 0.85 1.52 55.4 34.5 14.6 2012/2013 2003
Cruzeiro do Sul CZS 67371 78507 (16.53) 1.37 2.39 68.3 54.1 13.9 2013/2014, 2014/ 2015
2008
Assis Brasil AB 3493 6072 (73.83) 1.61 1.56 61.4 49.7 24.8 - 2005
Porto Acre PA 11403 14880 (30.49) 0.13 0.15 51.1 24.5 12 - 2001
Bujari Bjr 5829 8471 (45.33) 0.39 0.77 47 40.1 19.4 - 2006
Feijo´ Fj 26733 32412 (21.24) 0.73 1.05 51.3 13.5 10.3 - 2014
Tarauaca´ Trc 26022 35590 (36.77) 1.15 1.19 49.2 42.2 10.9 - 2015
Manoel Urbano MU 6370 7981 (25.29) 1.06 1.95 53 58.1 12.9 -
-Rodrigues Alves
RA 8097 14389 (77.71) 0.48 0.43 38.5 43.1 9.2 -
-Maˆncio Lima ML 11074 15206 (37.31) 1.09 1.36 50.9 54 6.7 - 2015
Santa Rosa do Purus
SRP 2247 4691 (108.77) 0.30 0.68 47.2 47.8 4.8 -
-Marechal Thaumaturgo
MT 8294 14227 (71.53) 0.13 0.39 32.6 23.9 8.4 -
-Porto Walter PW 5486 9176 (67.26) 0.36 0.57 20.6 38.5 0.7 - 2015
Jordão Jrd 4459 6577 (47.50) 0.24 0.53 38.3 36.1 5.3 -
-LI/LIRAastands for household larval survey (LI) and Rapid Assessment of Infestation byAedes aegypti(LIRAa);T3refers to the occurrence of at least three consecutive weeks withRt>1; Epidemiological year for dengue in Brazil was defined as the period from July of base year to June of the next.
and receptivity in the study of disease emergence. In the landscape epidemiology of infectious diseases, the description of the temporal dynamics of the populations of hosts, vectors, and pathogens, all spatially interacting in a favorable environment, contributes to the understand-ing of what characteristics and factors favor disease transmission an establishment [60]. Even small differences in landscape composition, which are often unapparent, can alter the micro-habitats of the vector and thus the conditions that allow the amplification of a pathogen [60]. In addition, the dispersion of pathogens and vectors is directly linked to the development of transportation networks and increased globalization [49]. In this context, human population expansion has significantly affected the epidemiology of vector-borne diseases, creating a large urban continuum, altering the landscape structure and providing rapid mechanisms for hosts and pathogens to disperse [60].
The results of this study suggest that the landscape changes that occurred in the last decade have created favorable conditions for the establishment of dengue virus transmission, bringing together all the fundamental factors for its occurrence: the man, the virus, the vector, and espe-cially the environmental, political, economic, social and cultural conditions favorable for the establishment of the transmission chain [61]. In Acre, the revitalization of its major roads, as well as the increased accessibility by air both to and within the state, have increased dengue vulnerability. Notice that the increase in the flow of people and importation of dengue cases to Acre coincides with when disease dispersion becomes more pronounced within the state, sug-gesting a synergy between increasing vulnerability of the state at a global scale and increasing local vulnerability among municipalities, fueling viral spread in the region. Human mobility is responsible for viral spreading, as both asymptomatic humans or those with very mild symp-toms continue to carry out their tasks and take the virus to other regions. Humans are also responsible for possibly transporting the mosquito itself (which can be infected or not) by air, road, and waterway [2,7,62].
Some network descriptors used in this study were useful for characterizing the level of cen-trality/periphery of the Acrean municipalities and its relationship with dengue importation. The mobility network that connects the Acrean counties is small and dense—22 nodes and density 0.38 –, so centrality measures such as betweenness (BandBw) and closeness (Cand Cw) were not as relevant as they would be in larger and sparser networks. However, the strength (S) was the most relevant of the descriptors, because, in a small network, the relation-ship between local and global characteristics are stronger. Rio Branco is the main attractor of the state, with highest and strongest connectivity within Acre, since most of the routes con-necting municipalities in the northwest to the southeast region pass by the capital. Also, it is a reference center for the entire state. A node with high connectivity, that is, a node to which many others connect to and where there are many outputs, is an essential node for the propa-gation of infectious diseases [63]. Therefore, investing in dengue control and prevention in a systematic manner in Rio Branco has potentially a strong impact throughout the state, not only because of its connectivity within Acre but also because this city is the main port-of-entry from other Brazilian states.
connections by road between both municipalities. This last result highlights the importance of the airline connection between them for dengue case importation.
The mobility data used in the present work is from the 2010 Census [30] when the struc-tural network around Cruzeiro do Sul and Rio Branco was already stabilized regarding paving and maintenance, as shown inFig 5. Since dengue epidemiological year of 2009/2010, all roadways directly connected to those two hubs had their maintenance concluded. Also, the unpaved connections to and from Manoel Urbano, which is structurally in between the two Acrean hubs, had also improved by that time. Most of its paving work was concluded by the end of 2010, although maintenance works continued for the rest of the study period. Despite the unavailability of detailed movement for performing a rigorous analysis, it is to be expected that during the period with unpaved and with major maintenance works in the roadways the flow of individuals was lower than when those structural bottlenecks were resolved. Therefore, we expect that the 2010 mobility flux data is more representative of the work/study-related movement from 2009 onwards. Before that, we conjecture that this particular type of human mobility was more concentrated over those connections with paved roads and without major maintenance work.
The structural network status evolution depicted inFig 5allows us to identify a few key fac-tors regarding the temporal evolution of ease of access and dengue case notification. Up until epidemiological year 2009/2010, when paved roads (black edges in that network) were mainly present in the vicinity of Rio Branco, the occurrence ofRt>1 was also mostly present in that area—which can be identified by node’s color inFig 5as well as by the markings inFig 3. In the area surrounding Cruzeiro do Sul, which was mainly connected by waterways (dashed blue edges) and roads under maintenance (orange edges), before 2007/2008 the occurrence of Rt>1 was registered only once at Maˆncio Lima (ML) and a few times in Cruzeiro do Sul. These results reinforce the hypothesis that those cases notified in Cruzeiro do Sul were most likely imported cases from Rio Branco due to the airline connection. It is interesting to note that in terms of roadways, the path from Rio Branco to Cruzeiro do Sul had a structural bottle-neck at Manoel Urbano (MU) since it was only accessed by means of unpaved road (red edges) up to 2007/2008.
Improvements in the structural network started in 2008/2009, which included paving and maintenance work of the roadways around Manoel Urbano, and were consolidated in 2009/ 2010 with the conclusion of major maintenance work in the roadways directly connected to both Rio Branco and Cruzeiro do Sul. We can see that is was precisely after those improve-ments that dengue notifications started to occur throughout the state of Acre, as well as the number of consecutive weeks withRt>1 in each municipality. The combination of low occur-rence ofRt>1 during the years with unpaved and under maintenance roadways, and the increased observation ofRt>1 after improvements were implemented reinforces the hypothe-sis that the human mobility network and the structural changes were relevant to the observed geographical spread of the virus in the state of Acre.
[65] south of Bogota´. In Nicaragua, a study showed the unsuspected presence of dengue cases in those areas as well [66].
These results from the literature and the results shown in the present manuscript suggest that introduction and establishment of dengue in those peripheral areas of Acre could be just a matter of time, especially since the virus has already been able to establish itself in the state.
Overall, with this study, we understand that the determination of vulnerable and receptive localities for dengue in the state of Acre is essential for an effective action of entomological and epidemiological surveillance. It is fundamental that all municipalities, especially those with a roadway link, systematically monitor mosquito infestation, which is not currently the case. In addition, favorable conditions for mosquito development are present in Acrean municipali-ties, with low coverage of services, climate and increased urbanization [25], which probably impacts on the availability of breeding sites forAe. aegyptiand its establishment. Acre has a humid equatorial climate, which may contribute to the transmission of the dengue virus occurring throughout the year. According to [50], the mosquitoes of the region have the vecto-rial competence to transmit the DENV-2. Unfortunately, we did not find more biological information on the mosquito populations of Acre. We can conclude that Acre is a state at risk of major dengue epidemics, with entire populations susceptible to all serotypes of the disease. Due to the limited data and number of municipalities, our analysis is more descriptive/qualita-tive than quantitadescriptive/qualita-tive. Nonetheless, we believe that the descriptors discussed here as well as the methodological approach has proved a valuable way to assess invasion risk which can be easily expanded to larger areas—conditioned on data availability –, allowing for a more quantitative analysis..
Supporting information
S1 Appendix. Airline origin-destination flow estimates based on Brazilian airline database.
Description of mathematical framework to estimate airline origin-destination flow between Brazilian airports from publicly available data.
(PDF)
S2 Appendix. Network descriptors and correlations between them.Full matrix of centrality measures for each Acrean Municipality and confusion matrix of those measures.
(PDF)
S1 Fig. High resolution version of the structural network figure.Vectorial format of the structural network of Acrean municipalities for each dengue epidemiological year from 2000/ 2001 to 2014/2015.
(PDF)
Acknowledgments
SESACRE, DERACRE, Prefeitura Municipal de Maˆncio Lima, Prefeitura Municipal de Rodri-gues Alves, Endemias de Maˆncio Lima e RodriRodri-gues Alves. Jose´ Joaquı´n Carvajal for help with LI/LIRAa.
Author Contributions
Conceptualization:Raquel Martins Lana, Nildimar Alves Hono´rio, Cla´udia Torres Codec¸o.
Formal analysis:Raquel Martins Lana, Marcelo Ferreira da Costa Gomes, Cla´udia Torres Codec¸o.
Investigation:Raquel Martins Lana, Marcelo Ferreira da Costa Gomes.
Methodology:Raquel Martins Lana, Marcelo Ferreira da Costa Gomes, Cla´udia Torres Codec¸o.
Supervision:Cla´udia Torres Codec¸o.
Visualization:Raquel Martins Lana, Marcelo Ferreira da Costa Gomes.
Writing – original draft:Raquel Martins Lana, Marcelo Ferreira da Costa Gomes, Cla´udia Torres Codec¸o.
Writing – review & editing:Raquel Martins Lana, Marcelo Ferreira da Costa Gomes, Tiago Franc¸a Melo de Lima, Nildimar Alves Hono´rio, Cla´udia Torres Codec¸o.
References
1. Stoddard ST, Forshey BM, Morrison AC, Paz-Soldan VA, Vazquez-Prokopec GM, Astete H, et al. House-to-house human movement drives dengue virus transmission. Proceedings of the National Academy of Sciences of the United States of America. 2013; 110:994–999.https://doi.org/10.1073/ pnas.1213349110PMID:23277539
2. Kuno G. Review of the factors modulating dengue transmission. Epidemiologic reviews. 1995; 17:321– 335.https://doi.org/10.1093/oxfordjournals.epirev.a036196PMID:8654514
3. Hono´rio NA, Silva WdC, Leite PJ, Gonc¸alves JM, Lounibos LP, Lourenc¸o-de Oliveira R. Dispersal of Aedes aegypti andAedes albopictus(Diptera: Culicidae) in an urban endemic dengue area in the State of Rio de Janeiro, Brazil. Memo´rias do Instituto Oswaldo Cruz. 2003; 98(2):191–198.https://doi.org/10. 1590/S0074-02762003000200005PMID:12764433
4. Gubler D, Kuno G. Dengue and dengue hemorrhagic fever: its history and resurgence as a global public health problem, p 1-22. Dengue and dengue hemorrhagic fever CAB international, London, United Kingdom. 1997.
5. Smith CEG. The History of Dengue in Tropical Asia and its Probable Relationship to the Mosquito
Aedes aegypti. Journal of Tropical Medicine and Hygiene. 1956; 59(10):243–51. PMID:13368255
6. Godding CC. An Account of an Obscure Outbreak of Dengue Occurring on Board HMS Agamemnon while Stationed at Zanzibar between November, 1888, and September, 1889. British medical journal. 1890; 1(1520):352.https://doi.org/10.1136/bmj.1.1520.352PMID:20752951
7. Smith A, Carter ID. International transportation of mosquitoes of public health importance. In: Laird M, editor. Commerce and the spread of pests and disease vectors. New York: Praeger Publishers, USA; 1984. p. 1–21.
8. Rvachev LA, Longini IM. A mathematical model for the global spread of influenza. Mathematical biosci-ences. 1985; 75(1):3–22.https://doi.org/10.1016/0025-5564(85)90064-1
9. Balcan D, Colizza V, Gonc¸alves B, Hu H, Ramasco JJ, Vespignani A. Multiscale mobility networks and the spatial spreading of infectious diseases. Proceedings of the National Academy of Sciences. 2009; 106(51):21484–21489.https://doi.org/10.1073/pnas.0906910106
10. Gomes MF, y Piontti AP, Rossi L, Chao D, Longini I, Halloran ME, et al. Assessing the international spreading risk associated with the 2014 West African Ebola outbreak. PLoS currents. 2014; 6.https:// doi.org/10.1371/currents.outbreaks.cd818f63d40e24aef769dda7df9e0da5PMID:25642360
11. Brockmann D, Helbing D. The hidden geometry of complex, network-driven contagion phenomena. Sci-ence. 2013; 342(6164):1337–1342.https://doi.org/10.1126/science.1245200PMID:24337289
12. Piontti APy, Gomes MFDC, Samay N, Perra N, Vespignani A. The infection tree of global epidemics. Network Science. 2014; 2(1):132–137.https://doi.org/10.1017/nws.2014.5
13. Tizzoni M, Bajardi P, Poletto C, Ramasco JJ, Balcan D, Gonc¸alves B, et al. Real-time numerical fore-cast of global epidemic spreading: case study of 2009 A/H1N1pdm. BMC medicine. 2012; 10(1):165. https://doi.org/10.1186/1741-7015-10-165PMID:23237460
15. Poletto C, Gomes MF, y Piontti AP, Rossi L, Bioglio L, Chao DL, et al. Assessing the impact of travel restrictions on international spread of the 2014 West African Ebola epidemic. Euro surveillance: bulletin Europeen sur les maladies transmissibles = European communicable disease bulletin. 2014; 19(42).
16. Rainisch G, Asher J, George D, Clay M, Smith TL, Kosmos C, et al. Estimating ebola treatment needs, United States. Emerging infectious diseases. 2015; 21(7):1273.https://doi.org/10.3201/eid2107. 150286PMID:26079150
17. Pastore-Piontti A, Zhang Q, Gomes MF, Rossi L, Poletto C, Colizza V, et al. Real-Time Assessment of the International Spreading Risk Associated with the 2014 West African Ebola Outbreak. In: Mathemati-cal and StatistiMathemati-cal Modeling for Emerging and Re-emerging Infectious Diseases. Springer; 2016. p. 39– 56.
18. Zhang Q, Sun K, Chinazzi M, Pastore-Piontti A, Dean NE, Rojas DP, et al. Projected spread of Zika virus in the Americas. bioRxiv. 2016; p. 066456.
19. Rego JP, Lavradio JPR. Esboc¸o histo´rico das epidemias que tem grassado na cidade do Rio de Janeiro: desde 1830 a 1870. vol. 2. Typographia nacional; 1872.
20. Pedro A. O dengue em Nictheroy. Brazil Me´dico. 1923; 1(13):174–7.
21. Schatzmayr HG, Nogueira RMR, Rosa APATd. An outbreak of dengue virus at Rio de Janeiro—1986. Memo´rias do Instituto Oswaldo Cruz. 1986; 81:245–246.
https://doi.org/10.1590/S0074-02761986000200019PMID:3587006
22. Miagostovich MP, Nogueira RM, Cavalcanti S, Marzochi KB, Schatzmayr HG. Dengue epidemic in the state of Rio de Janeiro, Brazil: virological and epidemiological aspects. Revista do Instituto de Medicina Tropical de São Paulo. 1993; 35(2):149–154.https://doi.org/10.1590/S0036-46651993000200006 PMID:8284599
23. Ministe´rio do Planejamento. Programa de Acelerac¸ão do Crescimento; 2014. Internet. Available from: http://www.pac.gov.br/infraestrutura-logistica/rodovias/ac.
24. ACRE Governo do Estado do Acre. Zoneamento Ecolo´gico-Econoˆmico do Estado do Acre, Fase II (Escala 1:250.000): Documento Sı´ntese. vol. 1. 2nd ed. SEMA, editor. Rio Branco; 2010.
25. IBGE Instituto Brasileiro de Geografia e Estatı´stica. Cidades; 2010. Internet. Available from:http:// www.cidades.ibge.gov.br.
26. Codec¸o C, Luz P, Struchiner C. Risk assessment of yellow fever urbanization in Rio de Janeiro, Brazil. Transactions of the Royal Society of Tropical Medicine and Hygiene. 2004; 98(12):702–710.https://doi. org/10.1016/j.trstmh.2003.12.019PMID:15485700
27. WHO World Health Organization. Malaria elimination: a field manual for low and moderate endemic countries. World Health Organization; 2007.
28. WHO Expert Committee on Malaria, et al. WHO Expert Committee on Malaria. Twelfth Report. Geneva, 21-27 September 1965. World Health Organization, editor. 324. World Health Organization; 1966.
29. IBGE Instituto Brasileiro de Geografia e Estatı´stica. Pesquisa Nacional por Amostra de Domicı´lios 2001-2011; 2011. Internet. Available from:http://seriesestatisticas.ibge.gov.br/series.aspx?vcodigo= PD335&t=populacao-residente.
30. IBGE Instituto Brasileiro de Geografia e Estatı´stica. Censo Demogra´fico 2010: Resultados gerais da amostra; 2010. Available from:http://www.ibge.gov.br/home/estatistica/populacao/censo2010/ resultados_gerais_amostra/resultados_gerais_amostra_tab_uf_microdados.shtm.
31. Lopez LF, Amaku M, Coutinho FAB, Quam M, Burattini MN, Struchiner CJ, et al. Modeling Importations and Exportations of Infectious Diseases via Travelers. Bulletin of mathematical biology. 2016; 78:185– 209.https://doi.org/10.1007/s11538-015-0135-zPMID:26763222
32. Vaughn DW, Green S, Kalayanarooj S, Innis BL, Nimmannitya S, Suntayakorn S, et al. Dengue viremia titer, antibody response pattern, and virus serotype correlate with disease severity. The Journal of infec-tious diseases. 2000; 181:2–9.https://doi.org/10.1086/315215PMID:10608744
33. Chowell G, Viboud C, Simonsen L, Moghadas SM. Characterizing the reproduction number of epidem-ics with early subexponential growth dynamepidem-ics. Journal of the Royal Society, Interface. 2016; 13. https://doi.org/10.1098/rsif.2016.0659PMID:27707909
34. Wallinga J, Lipsitch M. How generation intervals shape the relationship between growth rates and repro-ductive numbers. Proceedings Biological sciences. 2007; 274:599–604.https://doi.org/10.1098/rspb. 2006.3754PMID:17476782
35. Coelho FC, de Carvalho LM. Estimating the Attack Ratio of Dengue Epidemics under Time-varying Force of Infection using Aggregated Notification Data. Scientific reports. 2015; 5:18455.https://doi.org/ 10.1038/srep18455PMID:26675824