Original Articles
Temporal Rearrangement of Pre-ictal PTZ Induced Spike Discharges by Low
Frequency Electrical Stimulation to the Amygdaloid Complex
Daniel Castro Medeiros
a,b, Luciano Borges Oliveira
c, Flávio Afonso Gonçalves Mourão
a,
Cristiane Perácio Bastos
a, Norberto Garcia Cairasco
d, Grace Schenatto Pereira
a,
Eduardo Mazoni Andrade Marçal Mendes
b,c, Márcio Flávio Dutra Moraes
a,b,*aNúcleo de Neurociências (NNC), Departamento de Fisiologia e Biofísica, Instituto de Ciências Biológicas
eUniversidade Federal de Minas Gerais, Belo Horizonte, Minas Gerais CEP
31270-901, Brasil
bCentro de Tecnologia e Pesquisa em Magneto-Ressonância, Escola de Engenharia, Universidade Federal de Minas Gerais, Belo Horizonte, Minas Gerais CEP 31270-901, Brasil cDepartamento de Engenharia Eletrônica
eEscola de EngenhariaeUniversidade Federal de Minas Gerais, Belo Horizonte, Minas Gerais CEP 31270-901, Brasil
dDepartamento de Fisiologia, Faculdade de Medicina de Ribeirão Preto, Universidade de São Paulo, Ribeirao Preto, São Paulo CEP 14049-900, Brasil
a r t i c l e
i n f o
Article history:
Received 12 July 2013
Received in revised form 7 November 2013 Accepted 17 November 2013
Available online 9 December 2013
Keywords:
Epilepsy Pentylenetetrazole
Low frequency electric stimulation Phase-locking
Seizure prediction
a b s t r a c t
Background:Epilepsy is a common neurological disease affecting over 40 million people worldwide. The foremost important challenge of epileptologists has been to control and predict the recurrent and spontaneous seizures of epileptic patients. The application of low frequency electrical stimulation (LFS) in deep brain structures has shown promising results in seizure control. However, the use of LFS as a probing strategy for seizure prediction, thus contributing to a closed loop solution, is still poorly explored.
Objective: To improve seizure prediction by producing gradually increasing phase-locked pre-ictal electrographical responses, due to the short-term plastic changes in epileptogenic neural networks, thus behaving as a“programmed”surrogate marker.
Methods:Urethane anesthetized rats were divided into 3 groups: the PTZ-noES group was injected with pentylenetetrazole (PTZ 4 mg/ml/minflow rate) i.v. without electrical stimulation (ES); the ES-noPTZ group received ES (0.5 Hz, 0.1 ms pulse width and 0.6 mA) to the amygdaloid complex and the PTZþES group received simultaneously i.v. PTZ infusion and ES. After each condition, electrographical parameters and c-Fos expression of regions of interest were evaluated.
Results:Although the PTZþES group had no evident change in the sustained electrographic seizure onset, duration and/or frequency spectrum; c-Fos labeling showed a different expression pattern when compared to the PTZ-noES and ES-noPTZ. Also, PTZþES formed a gradually increasing evoked potential; confirming the strong coupling of reverberant neural networks induced by ESephase locked to stimuli. Conclusion:ES induces a detectable temporal rearrangement of pre-ictal activity, which has suggestive applicability to seizure prediction.
Ó2014 Elsevier Inc. All rights reserved.
Introduction
Epilepsy is one of the most common neurological diseases worldwide[1]. Although most epileptic conditions are satisfactorily controlled by medication, about 30% of the patients are resistant to
pharmacological treatment[2]. The deep-brain-electrical stimula-tion (DBS) is an emerging therapeutic alternative to an otherwise untreatable medical scenario. It has been hypothesized that DBS seizure control is achieved by inactivating ictogenic networks, us-ing high-frequency stimulation, or by activatus-ing inhibitory net-works, through low-frequency stimulation (LFS)[3]. If periodic LFS is applied to ictogenic areas, it may facilitate seizure occurrence[4]. Previous research has shown that 4 Hz periodic pulses applied to the amygdaloid complex (AMY) of pentylenetetrazole (PTZ) treated animals increases the susceptibility to seizure [4] and enhances neural activity in limbic system structures [5]. Adding to the complexity of the phenomena, the fixed time interval between Conflict of interest: The authors declare no competingfinancial interests.
*Corresponding author. Núcleo de Neurociências, Departamento de Fisiologia e Biofísica Instituto de Ciências Biológicas, Universidade Federal de Minas Gerais. Av. Antônio Carlos, 6627, CEP 31270-901, Campus Pampulha, Belo Horizonte, MG, Brazil. Tel.:þ55 31 3409 2930; fax:þ55 31 3409 2924.
E-mail addresses:[email protected],[email protected](M.F.D. Moraes).
Contents lists available atScienceDirect
Brain Stimulation
j o u r n a l h o m e p a g e : w w w . b r a i n s t i m j r n l . c o m
1935-861X/$esee front matterÓ2014 Elsevier Inc. All rights reserved.
electrical stimulation (ES) pulses is determinant to produce the pro-convulsive effect. Conversely, a non-periodic ES applied to the AMY, with the same 4 pulses-per-second paradigm, induces an anti-convulsant effect[4,5]. One possible explanation is that non-periodic ES delays seizure outcome by interfering with the exces-sive coupling between oscillators. In contrast, periodic ES promotes the coupling of endogenous neural oscillators, leading to abnormal neural synchronization and seizure. This hypothesis is quite con-sonant with the concept of several microseizure neural circuits being abnormally connected to form a full-scale epileptic event[6]. The present work explores the abnormal coupling (i.e. hyper-synchronicity) within a different perspective: seizure prediction.
It is our understanding that if ES is to be applied to seizure prediction at least a couple of guidelines must be convened: 1) The ES may not promote or induce seizures in non-epileptogenic and/or epileptogenic neural networks and 2) The probing of epileptogenic circuits must improve the detection of abnormal coupling when compared to ES-free seizure progression.
Although the use of the PTZ model is not ideal for studying seizure prediction, its choice is quite adequate for evaluating gradual changes previous to the sustained epileptiform onset; therefore, much better suited for testing our hypothesis. Also, urethane anesthetized rats were used in order to lower overall brain excitability and the frequency of endogenous pre-ictal iso-lated discharges. The occurrence of pre-ictal discharges in the PTZ-noES group was quantified in terms of its mean overall frequency to determine an adequate ES periodic stimulation. In sequence, ES-noPTZ, PTZ-noES and PTZþES groups were evaluated by means of electrographical parameters and c-Fos expression. The results show that ES induces a phase-locked coupling of reverberant neural networks during the pre-ictal period, without evident change to epileptiform activity onset (sustained spike discharges), duration of burst activity and frequency spectrum during the electrographic seizure. In summary, ES promotes a detectable temporal rear-rangement of pre-ictal activity, which has suggestive applicability to seizure prediction.
Material and methods
Animals
Male Wistar rats (n¼32, weighing 300e320 g), supplied by the CEBIO-ICB-UFMG vivarium, were housed under controlled envi-ronmental conditions (221C), with a 12:12-h light
edark cycle and free access to food and water. All experiments were executed under the Protocol Licensen150/06 approved by the University’s Ethical Committee for Animal Experimentation (CETEAeUFMG). The CETEA directives are in compliance to NIH guidelines for the care and use of animals in research.
Experimental procedure
Experimental groups
Rats were divided into 2 main groups: EEG (n¼18) and c-Fos (n¼18) groups. Both were further divided into 3 sub-groups: PTZ infusion (PTZ with no ES,n¼6ePTZ-noES), electrically stimulated (ES with noPTZ,n¼6eES-noPTZ) and PTZ infusion associated with electric stimulation (PTZþES,n¼6). The EEG recording, the i.v. PTZ infusion and the ES started simultaneously for all animals.
Surgical procedures
All rats were anesthetized (urethane 140 mg/ml; 10 ml/kg, i.p.) and positioned in a stereotaxic frame (Stoelting Co., Wood Dale, IL, USA). Bipolar electrodes (2 mm separation dipole), made of a twisted pair of stainless-steel teflon-coated wires (Model 791400,
A-M Systems Inc., Carlsborg, WA, USA), were surgically implanted in the right amygdala (AMY - AP: 2.8 referenced from the bregma, ML: 5.0, DV: 7.2)[7]. In addition, surface electrode micro-screws were positioned over both parietal cortices (AP: þ1.0 referenced from the lambda, ML:2.0) for EEG recordings. The electrodes were then soldered to a phone connector (RJ 11e6 pins), which in turn wasfixed to the rat’s skull with dental acrylic cement.
PTZ infusion and ES
Immediately after surgery, the medial tail vein was cannulated (BD Angiocath Catheter I.V.e24GA0.75INe0.719 mm) for infusion of PTZ (40 mg/mleSigmaeAldrich, diluted in saline 0.9%) or saline (ES-noPTZ group). The infusion pump (KDS100eKD Sci-entificÒ
) was set at 4 mg/ml/minflow rate. The PTZ infusion was interrupted at the beginning of the electroencephalographic seizure for EEG groups and at half necessary PTZ dose to evoke seizure for the c-Fos group (150 g/kg or 790 30 s). For the ES-noPTZ and PTZþES groups, electrical stimuli consisted of monophasic square pulse (0.1 ms pulse width and 0.6 mA intensity) delivered at 0.5 Hz by an isolated constant current stimulator (DigitimerÒ
DS3 Con-stant Current Stimulator) to the AMY bipolar electrodes. The use of monophasic instead of biphasic ES pulses in this work was not a relevant issue for the experimental design. One possible consider-ation would be that monophasic pulses might induce greater tissue damage by electrolysis. However, not only the pulse duration used was very short (100
m
s) but also the repetition rate was extremely low (0.5 Hz). In fact, according to Merrill et al. [8] our K factor (2 logQ logA) would be 0.77 (K<2 @50 Hz is considered safe practice;Q¼0.06m
C/phase andA¼0.000613 cm2), posing no harm to surrounding tissue due to ES. In addition, the total duration of ES was also short (approximately 25 min), when compared to other reported studies [9]. The widespread efferent connections from AMY to sensory cortex[10], hippocampus[11], hypothalamus[12] and thalamus[13]were the main reason for choosing this area as the ES target.Electrophysiology
The EEG signal from both parietal cortices were amplified (5000gain) andfiltered (1 Hz High pass, 500 Hz Low pass) by a signal conditioner (Aisha4eKananda
Ò
Ltd). Data were sampled at 1 kHz and recorded in a computer hard disk for offline analyses. The EEG group was recorded for over 1 min after PTZ infusion was interrupted; while the c-Fos group was monitored for another 90 min to guarantee no electrographic seizure occurred. Immedi-ately after EEG recording was halted, anesthetized animals were injected with a urethane overdose (1.4 mg/kg) and immediately underwent transcardial perfusion with 0.01 M phosphate buffer saline (PBS), followed by 4% paraformaldehyde (PFA) in PBS. The brains were removed and embedded in the perfusion solution. At this point, the brains for the EEG and c-Fos group diverged in the way they were processed.
Brain tissue preparation
The brains from EEG group rats were removed, sliced (Cryostat 300eANCAP
Ò
Ltd), and stained with neutral red (2%) for histo-logical identification of electrode position. For c-Fos immunohis-tochemistry, brains were transfer to a solution of 30% sucrose in PBS and maintained at 4C for three days. Brains were frozen in 99% isopentane, ate45C and cryo-sectioned (rostro-caudal extente Cryostat 300eANCAP
Ò
blocking solution [3% normal goat serum (NGS) in TBS/0.3% Triton X-100]. The primary antibody against c-Fos (Santa Cruz, sc-52), diluted 1:5000, was added and incubated overnight at room tem-perature. Next day, the sections were washed 36 min in TBS with 0.3% Triton X-100 and incubated with the secondary antibody (1:1000, biotinylated anti-IgG antibody goat antirabbit; Vector Laboratories) for 2 h at room temperature. After, the sections were washed 36 min in TBS with 0.3% Triton X-100 and incubated with avidinebiotin horseradish peroxidase complex (1:500 in TBS with 0.3% Triton X-100; Vector Laboratories) during 1 h at room tem-perature. Subsequently, the sections were washed 36 min in TBS and 36 min in 174 mMacetate buffer. The sections were devel-oped with a solution containing 0.2 mg/ml diaminobenzidine (DAB), 25 mg/ml nickel sulfate and 0.0025% H2O2in acetate buffer for 15 min. Finally, the sections were washed 36 min in 174 mM acetate buffer and mounted on gelatin-coated slides, air-dried, dehydrated in xylene, and embedded in EntellanÒ
[14].
Data analysis
c-Fos expression
Immunostaining images of coronal slices (from Bregma 2.5 to 3.3) were obtained using an AxioImager M2 (Zeiss) microscope, Plan-Apochromat5 objective. Photomicrographs of stained brain sections were taken with a digital camera (AxioCam MRm, Zeiss) through the software Carl Zeiss Axiovision 4.8 (13881420 pixels image; 1.02
m
m1.02m
m pixel size). The TIFF-format micrographs were analyzed using ImageJ software (http://rsbweb.nih.gov/ij/). The ImageJ threshold tool was used to construct a mask separating stained cells from the background (same pixel threshold level was held for all images analyzed). An identified object was only counted as a cell if the overall diameter was within 5e100m
m. Total counts were made within Regions of Interest (ROIs), depicted in the schematic diagram of the rat brain atlas shown inFig. 3eright inset, as follows (contralateral to ES electrode placement): cortex, amygdaloid complex, thalamus and hipotalamus. The mechanical lesions of areas ipsi-lateral to the ES electrode placement (i.e. cortexand amygdaloid complex) rendered the analysis inconclusive and therefore were removed from the results (data not shown). In order to provide proper inter-ROI comparison; the total number of cell counts was normalized by the area of each ROI in mm2(Fig. 3e bottom bar graphs). Due to the high density of cells within the hippocampus ROI (see Fig. 3 brain atlas diagram inset), with continuous overlapping of cell bodies, the analysis of this region was conducted by optical-densitometry (OD). The hippocampus ROI-OD gray scale average was normalized against background (i.e. corpus callosum OD), seeFig. 3.
Epileptiform EEG activity (onset, duration and spectral analysis) The latency from the beginning of the PTZ infusion and the emerging of typical polyspike epileptiform discharge on the EEG recording was used as the seizure onset value. The duration of polyspike epileptiform discharge activity was also determined (seizure duration) in order to quantify seizure severity. The fre-quency spectrum of the ictal EEG activity of the PTZ-noES and PTZþES groups were calculated using a MATLABÒ routine (fast Fourier transformeFFT) within thefirst 2 s after seizure onset.
Pre-ictal EEG analyses
Time zero (Tzero) was set at the beginning of the typical poly-spike epileptiform discharge pattern characteristic of PTZ induced seizures (seizure onset eFig. 1A). The subsequent analyses were conducted within the 600 s time window before EEG seizure onset (Tzero-600 seTzero), using MATLABÒroutines (The MathWorks) and functions. For both groups injected with PTZ, a threshold voltage for pre-ictal discharge detection was set to be at 75% of the maximum amplitude of the last discharge immediately before seizure onset (inset of the Fig. 1B). An algorithm was design to detect every electrographical event that surpassed threshold and returned the time-stamp of all events detected. In order to determine the average pre-ictal discharge time interval of repetition in the PTZ-noES group, the time of occurrence of the (N þ1)th event was subtracted from the previousNth event (time interval between pre-ictal dischargeseTI-ID). This data was used to produce a histogram
Figure 1.PTZ-noES pre-ictal electrographic activity. (A) Time segment of a typical electrographic recording from the PTZ-noES group. Only the 600 s time window preceding electrographic ictal activity onset (Tzeroeblack arrow) was used for analysis. Inset is a zoomed view depicting the transition between pre-ictal and epileptiform EEG. (B) Time-stamp
of 1 s-bins (Fig. 1C). The ES frequency chosen for subsequent ex-periments was established at constant inter-stimuli intervals of 2 s (i.e. 0.5 Hz).
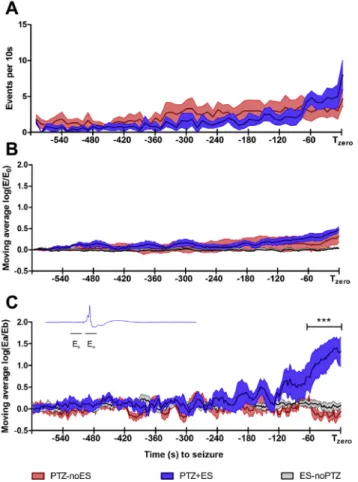
It is paramount to evaluate if the low frequency ES, in PTZ injected animals, did not significantly change the frequency of occurrence of pre-ictal discharge events. Thus, the 600 s analysis window was divided into 60 epochs (10 s window width) and the total number of pre-ictal discharge events quantified for each epoch (Fig. 4A).
For the purpose of evaluating phase synchronization to ES, the trigger signal from the ES was also recorded in a different channel of the A/D converter. Therefore, it was possible to trigger the elec-trographic response with the ES presentation, depicting EEG ac-tivity before (500 ms) and after (1500 ms) stimuli were applied (Fig. 6, left panel). Consequently, a sequence of 300 consecutives 2 s windows epochs (600 s EEG analyses) was used to evaluate the temporal rearrangement of the pre-ictal discharges. Nevertheless, the EEG energy (V2) of each 2 s epochs was calculated and normalized by basal energy (E0: EEG from thefirst 2 s epoch, 600 to 598 s), in order to show that ES did not significantly change the total energy of the signaledepicted inFig. 4B. Evidence of temporal synchronization to stimuli is clear from the emergence of an evoked potential recorded from cortical leads (Fig. 4C). The normalized energy ratio (Ea/Eb:Eb¼ 250 to 0 ms andEa¼10e260 ms) was quantified for every 2-s epoch for all three groups.
An algorithm was designed for quantifying to what degree the ES was driving pre-ictal spike activity. The EEG was separated into a series of 2 s window segments and the time, within each 2 s segment, at which the maximum peak (TMP e time maximum
peak) occurred was used to produce a time-stamp of event occur-rences. By subtracting the instant of occurrence of the (Nþ1)th from the previous Nth event, an histogram varying from 2 s toþ2 s (9 bins) was produced (Fig. 5C, D, E). It is important to highlight that a completely stochastic process would generate a Gaussian distribution, since every 2 s interval would have a random positioned correspondent maximum value (Fig. 5B). Furthermore, in order to observe the gradual“phase-locking”effect driven by ES, the EEG analysis interval was subdivided into 3 portions of 100 epochs each: 600 s to 400 s, 400 s to 200 s and 200 s to Tzero.
3 different waveforms (arbitrarily chosen as mentioned above) and the time of occurrence of each waveform was plot in a 2 s epochs window (synchronized with stimulus at 0 s) along the EEG analysis time frame (Tzero-600 seTzero).
Results
A typical EEG time series from a PTZ-noES group rat (600 s before seizure and 60 s after ictal activity onset) is shown inFig. 1A; the inset depicts the transition between pre-ictal to ictal period. It should be noted that, despite of the anesthesia, the PTZ was able to lead the brain structures to a clear, easily recognizable,
electrographic seizure.Fig. 1B presents the time interval between pre-ictal discharges (TI-ID time interval of interictal discharges) for the PTZ-noES group (each animal is represented by a specific color). A gradual organization of the TI-ID around 1e2 s can be observed. In order to determine the ES optimal presentation frequency, a his-togram of all the TI-ID was made showing the 2-s time interval bin as highest incidence of occurrence (Fig. 1C).
The ES did not interfere on the latency for the seizure onset, on its duration or spectral energy distribution; no statistical difference was found between PTZ-noES and PTZþES groups as shown in Fig. 2A, B and C (P¼0.1548 unpairedt-student test,P¼0.5887 Mann Whitney test,P>0.05 2-way ANOVA Bonferroni post-hoc Figure 3.The c-Fos expression in brain slices. Panel to the left depicts typical c-Fos expression images for all regions of interest (ROIs) analyzed. ROIs: CX-cortex, HC-hippocampus, AMY-amygdala complex, THALethalamus, HThehypothalamus. Dark area images in a rat brain atlas schematic diagram demonstrate the ROIs analyzed. (A, C, D, E) Number of
test, respectively). Nevertheless, the ES was able to modify neural activity as shown by the c-Fos expression analyses. The PTZþES group demonstrated a different c-Fos expression pattern when compared to the PTZ-noES and ES-noPTZ (Fig. 3), statistically different from the latter for thalamus, amygdaloid complex, and hipotalamus (THALP <0.001, AMY andHth P<0.05, one way ANOVA NewmaneKeuls multiple comparison post-hoc test). It is important to highlight that none of the animals from de c-Fos group had an identifiable electrographic seizure prior to brain tissue processing.
Pre-ictal discharge events throughout 600 s time window quantitative analyses are shown inFig. 4. The low-frequency ES did not significant change the frequency of occurrence of pre-ictal discharge events (Fig. 4A e P> 0.05 2-way ANOVA Bonferroni post-hoc test) or total energy of the signal (Fig. 4Belogarithm of normalized EEGeP>0.05 2-way ANOVA Bonferroni post-hoc test). Nevertheless, the logarithm of the ratio between EEG power after stimuli normalized by baseline energy for the PTZþES group is statistically higher compared with PTZ-noES (P < 0.001, 2-way ANOVA Bonferroni post-hoc test) and ES-noPTZ (P<0.001, 2-way ANOVA Bonferroni post-hoc test) groups 80 s before seizure onset (Fig. 4C).
The Fig. 5 shows the three experimental groups represented by specific colors: ES-noPTZ (black), PTZ-noES (red) and PTZþES (blue). The upper traces depict typical EEG recordings from each group. It should be note the lack of large oscillations in
representative EEG from the ES-noPTZ group, which obviously had no pre-ictal activity (Fig. 5A). Beneath the complete EEG time series recording, three distinct time intervals of 20 s, withdraw from EEG recording (I0 420 s to 400 s,I1 220 s to 200 s andI2 20 s to Tzeroseconds before seizure onset) is shown. These intervals were further separated in 2-s epochs and overlapped in order to highlight the evoked potential for the PTZþES group only prior the seizure; Fig. 5B. The histograms show the difference between TMPs in-tervals; suggesting that the external ES oscillator forces neural synchronization several seconds before seizure onset for the PTZþES group. As expected, the distribution at the beginning of the EEG record (Tzero-600eTzero-400 s) follows a Gaussian proba-bility for all groups (Fig. 5AeP>0.05, 2-way ANOVA Bonferroni
Figure 4.ES effect on the pre-ictal discharge events throughout the 600 s analysis window. (A) The 600 s was divided into 60 epochs (10 s each) and the total number of pre-ictal discharge events quantified for each epoch. (B) EEG normalized energy (E/E0) from a 20 s moving average calculated for every 2 s. (C) EEG power ratio of intervalsEa/
Eb (as shown in the inset) using the same moving average as B. (***P< 0.001, meanSEM).
Figure 5.Phase-locking of pre-ictal electrographic activity. The colors represent the ES-noPTZ (black), PTZ-noES (red) and PTZþES (blue) groups. (A) EEG recordings (T zero-600 seTzero) from a typical animal of each group. For each animal 3 intervals were
post-hoc test). However, the PTZþES group demonstrated a sig-nificant increase of the zero value bin, of TMPs intervals difference, on the last two thirds of the recording (Fig. 5B and C) preceding seizure onset, compared with PTZ-noES and ES-noPTZ (EEG from 400 to 200,P<0.01 and 200 toTzero,P<0.001, 2-way ANOVA Bonferroni post-hoc test). The value zero reflects the phase lock of pre-ictal discharges with the 0.5 Hz external ES drive. In order to test if the evoked potential for the PTZþES group results from the merging of individual neural circuits, which become synchronized with the external oscillator, the pre-ictal pattern identification algorithm was used. Thus, considering that different neural circuits may be represented by different waveforms on the EEG, semi-automatic pattern recognition can track the relative time occurrence (phase locked to ES) of specific circuits gradually shifting before seizure onset. A representative animal from PTZ-noES (Fig. 6A) and PTZþES (Fig. 6B) group was chosen depicting three different waveforms for each animal. The right panel shows the occurrence of the 3 waveforms templates in 2 s-epochs (from 0.5e1.5 s of the ES trigger) along EEG recording time to seizure. The left panel shows the EEG progression of sequential 2 s epochs varying fromTzero-160 seTzero-100 s. It can be noted that the waveforms occur randomly at the beginning of the EEG recording for both representative rats. However, the waveforms from the an-imal PTZþES group gradually synchronize with the stimuli prior seizure onset as the evoked potential emerges. The waveforms from the PTZ-noES animal remain randomly distributed.
Discussion
In our study, the low frequency ES (0.5 Hz) applied to the AMY (i.e. PTZþES group) did not show pro-convulsive properties: not altering seizure onset, duration of electrographic ictal activity or epileptiform discharge spectral distribution. However, low fre-quency stimulation has been shown to delay the evolution of seizure phenotype on the electrical kindling of the amygdala[15]. Controversially, 8 Hz stimulation of the anterior thalamic nuclear complex has a pro-convulsive effect generating electrographic seizures and behavioral manifestations even without the PTZ in-jection [16]. The classical view is that low-frequency ES would produce a stimulation-induced modulation of areas that could, in turn, either inhibit or induce seizures depending on the target area chosen for electrode placement [3]. Nevertheless, the very low frequency ES (0.5 Hz) was able to increase c-Fos expression only when applied during the ictogenic process induced by PTZ (PTZþES compared with ES-noPTZ group) which suggests that ES promotes abnormal neural network activation[17,18]by a poten-tiated modulation of amigdalofugal pathways. The PTZ-noES groups showed a significantly higher c-Fos count in the thalamus, as well as the PTZ-ES group, when compared to the ES group. It is expected, due to its diffuse and massive cortical afferent and efferent projections, that thalamic structures would be significantly activated during the PTZ infusion[19]. Altogether, these results are suggestive of a potentiating effect ES might exert on the abnormal Figure 6.Semi-automatic pattern recognition. The algorithm tracked the relative time occurrence of specific waveforms during the EEG analysis time window ( 600 s toTzero). Three different waveforms were arbitrarily chosen for each recording of a representative animal of the (A) PTZ-noES and (B) PTZþES groups. The left panel shows the raw EEG time-series progression of the sequential 2-s-epochs ( 0.5 to 1.5 s of the ES trigger) within the period depicted on the shadowed portion on the right (fromTzero-160 seTzero-100 s; thus,
PTZ induced coupling between diffuse microseizure circuits[20]. The ES may have worked as an exogenous pacemaker circuit driving PTZ triggered internal oscillators (pre-ictal EEG activity) to enhance coupling to a point as to promote visible evoked electrographical responses at the cortical leads (Figs.4C,5and6). It is important to highlight that neither the number of occurrences of pre-ictal events (Fig. 4A) nor the total energy of the electroencephalogram (Fig. 4B) showed significant changes between PTZ groups with or without ES.
The hypothesis that ictal neural circuitry may result from abnormal coupling between separate independent oscillatory substrates has been suggested by other studies using a myriad of different approaches. The GEPRs, a genetically strain of epilepsy prone rats, have a characteristic electrographic epileptiform signature that most likely results from the electricfield propagation (within the conducting volume) generated by different, phase locked, neural substrates[21]. In the before mentioned work, after surgically disconnecting the brainstem-forebrain circuitry, although seizure could still be induced by sound stimuli, the ictal electrographic epileptiform signature was significantly altered. The same concept has also been addressed in hippocampal slice studies [22]where a sequential disruption of the 3-synaptic circuitry had a significant effect on the coupling of independent hippocampal epileptiform activity and overall ictal waveform discharge pattern. Our data also support the view that independent pre-ictal neural generators, gradually coupling with each other, come to form an apparent single coupled epileptogenic oscillator (Figs.4C,5and6). Our results do not preclude the fact that neural circuits, other-wise silent during the pre-ictal period, may be recruited during seizure activity; thoughFig. 5D does not show an increase on EEG energy after the evoked potential response emerges. In addition, the coupling of existing pre-ictal generators and the recruitment of new epileptogenic circuits may be interdependent factors for seizure onset. As an example, it has been shown that brain regions responsible for inter-ictal electrographic activity are not necessarily part of ictogenic foci[23]; although inter-ictal activity and locali-zation is relevant for diagnostic purposes. Thus, it is not the authors’ intention to defend, with current results, that exclusively the neural substrates generating pre-ictal activity are synchronizing to pro-duce an epileptic circuit; rather, our data suggest that the mecha-nisms that underlie the excessive coupling between these pre-ictal generators might correlate to the same mechanisms of the icto-genesis process.
Although the chemical model used in this work (i.e. PTZ infusion seizures) is quite adequate to study the synchronization of pre-ictal activity; to assume that interictal patterns from patients having spontaneous seizures would behave in the same way would be an improper generalization of this principle. However, even under the paradigm of an ictogenesis chemical model, our results show that an external oscillator gradually drives/synchronizes the activity of endogenous ictogenic networks that can be measured before the onset of sustained epileptiform discharge, thus, potentially serving as a seizure predicting strategy. More so, if seen as a surrogate marker[24]for epileptic electrographic activity, the synchroniza-tion induced by ES was programmed by temporally pairing it to ictal activity, very much like it is done in an associative learning paradigm. It is important to highlight that the ES-noPTZ group did not give rise to any detectable evoked potential response at cortical EEG recordings. Nevertheless, although the present work lays ground for the concept of a programmed surrogate marker; further investigation is needed in order to test if the abnormal connectivity endures until the next epileptic event and if such plastic changes not change ES into a pro-convulsive stimuli.
In summary, our results show that very low frequency ES (0.5 Hz) may be used to probe neurogenic circuits without necessarily
facilitating or promoting seizure activity (Fig. 2). Furthermore, the LFS promoted an abnormal coupling between endogenous neural circuits, as evidenced by c-Fos and electrographic data (Figs. 3e6), which gradually changed before seizure onset. The current results endorse the proposition that probing epileptogenic neural circuits with ES may provide a temporal time frame for seizure prediction that allows feedback devices, such as using anti-epileptogenic ES [4,5], to create a novel treatment for patients with refractory epilepsy.
Acknowledgments
FAPEMIG, CNPq, INCT-INCeMaq and CAPES.
References
[1]Engel J. Epilepsy: global issues for the practicing neurologist. New York, NY: Demos Medical Pub; 2005.
[2]French JA. Refractory epilepsy: clinical overview. Epilepsia 2007;48(Suppl. 1):3e7. PubMed PMID: 17316406. English.
[3]Gwinn RP, Spencer DD. Fighting fire with fire: brain stimulation for the treatment of epilepsy. Clin Neurosci Res 2004;4(1e2):95e105.
[4]Cota VR, Medeiros Dde C, Vilela MR, Doretto MC, Moraes MF. Distinct patterns of electrical stimulation of the basolateral amygdala influence pentylenete-trazole seizure outcome. Epilepsy Behav 2009 Jan;14(Suppl. 1):26e31. PubMed PMID: 18824246. English.
[5]Mesquita MBS, Medeiros DD, Cota VR, Richardson MP, Williams S, Moraes MFD. Distinct temporal patterns of electrical stimulation influence neural recruitment during PTZ infusion: an fMRI study. Prog Biophys Mol Biol 2011 Mar;105(1e2):109e18. PubMed PMID: ISI:000288635300011. English.
[6]Jiruska P, de Curtis M, Jefferys JGR, Schevon CA, Schiff SJ, Schindler K. Synchro-nization and desynchroSynchro-nization in epilepsy: controversies and hypotheses. J Physiol Lond 2013 Feb;591(4):787e97. PubMed PMID: ISI:000315150000007. English.
[7]Paxinos G, Watson C. The rat brain in stereotaxic coordinates. 4th ed. San Diego; London: Academic; 1998. xxvi, 236 pp.
[8]Merrill DR, Bikson M, Jefferys JG. Electrical stimulation of excitable tissue: design of efficacious and safe protocols. J Neurosci Methods 2005 Feb 15;141(2):171e98. PubMed PMID: 15661300. English.
[9]McCreery DB, Agnew WF, Yuen TG, Bullara L. Charge density and charge per phase as cofactors in neural injury induced by electrical stimulation. IEEE Trans Biomed Eng 1990 Oct;37(10):996e1001. PubMed PMID: 2249872. English.
[10] Aggleton JP. The amygdala: a functional analysis. 2nd ed. Oxford: Oxford University Press; 2000. xiv, 690 pp.
[11] Petrovich GD, Canteras NS, Swanson LW. Combinatorial amygdalar inputs to hippocampal domains and hypothalamic behavior systems. Brain Res 2001 Dec;38(1e2):247e89. PubMed PMID: 11750934. English.
[12] Kapp BS, Gallagher M, Underwood MD, McNall CL, Whitehorn D. Cardiovas-cular responses elicited by electrical stimulation of the amygdala central nu-cleus in the rabbit. Brain Res 1982 Feb 25;234(2):251e62. PubMed PMID: 7059829. English.
[13] Sah P, Faber ES, Lopez De Armentia M, Power J. The amygdaloid complex: anatomy and physiology. Physiol Rev 2003 Jul;83(3):803e34. PubMed PMID: 12843409. English.
[14] Fonseca CS, Gusmao ID, Raslan AC, Monteiro BM, Massensini AR, Moraes MF, et al. Object recognition memory and temporal lobe activation after delayed estrogen replacement therapy. Neurobiol Learn Mem 2013 Mar;101:19e25. PubMed PMID: ISI:000317088700003. English.
[15] Yang LX, Jin CL, Zhu-Ge ZB, Wang S, Wei EQ, Bruce IC, et al. Unilateral low-frequency stimulation of central piriform cortex delays seizure development induced by amygdaloid kindling in rats. Neuroscience 2006;138(4):1089e96. PubMed PMID: 16427743. English.
[16] Mirski MA, Rossell LA, Terry JB, Fisher RS. Anticonvulsant effect of anterior thalamic high frequency electrical stimulation in the rat. Epilepsy Res 1997 Sep;28(2):89e100. PubMed PMID: 9267773. English.
[17] Kalitzin SN, Velis DN, da Silva FHL. Stimulation-based anticipation and control of state transitions in the epileptic brain. Epilepsy Behav 2010 Mar;17(3):310e23. PubMed PMID: ISI:000276029900003. English.
[18] Valentin A, Alarcon G, Honavar M, Garcia Seoane JJ, Selway RP, Polkey CE, et al. Single pulse electrical stimulation for identification of structural abnormalities and prediction of seizure outcome after epilepsy surgery: a prospective study. Lancet Neurol 2005 Nov;4(11):718e26. PubMed PMID: 16239178. English.
[19] Jones EG, Azmitia EC, Javier DEG, Jones PRCE. Chapter 27 thalamic organiza-tion and funcorganiza-tion after Cajal. Progress in brain research, vol. 136. Elsevier; 2002. pp. 333e57.
[21] Moraes MF, Mishra PK, Jobe PC, Garcia-Cairasco N. An electrographic analysis of the synchronous discharge patterns of GEPR-9s generalized seizures. Brain Res 2005 Jun 7;1046(1e2):1e9. PubMed PMID: 15885667. English.
[22] Imamura S, Tanaka S, Akaike K, Tojo H, Takigawa M, Kuratsu J. Hippocampal transection attenuates kainic acid-induced amygdalar seizures in rats. Brain Res 2001 Apr 6;897(1e2):93e103. PubMed PMID: 11282362. English.
[23] Keller CJ, Truccolo W, Gale JT, Eskandar E, Thesen T, Carlson C, et al. Hetero-geneous neuronalfiring patterns during interictal epileptiform discharges in the human cortex. Brain 2010 Jun;133:1668e81. PubMed PMID: ISI:000278226700010. English.