443
Abstract
This article aims to evaluate the use of a truck factor for off-highway trucks in open pit mine operations, thus reducing error on material movement and mine produc-tion data entry. This method is current for a copper mine located in South East Pará, Brazil. With a dispatch system, the truck factor is calculated using three data inputs called measured t, dump t and excavator load time. This dispatch system, designed to upload real time data from each truck, acquires measured load information by a truck weightometer and provides the basis for long-term, medium-term and mainly short-term planning. Due to the significant impacts toward mine planning, through data er-ror, a payload truck factor system provides data assurances in place of potential failure of onboard weighing. However, when using a system that is reliant on actual data, caution must be applied when replacing information with assumed fixed figures, thus forming the discussion on which this article attempts to review by providing overview on both the positive and negative impacts of implementing a truck factor system to an open pit mining using a dispatch system.
Keywords: truck factor, average load, production. Ana Carla de Melo Moreira Campelo
http://orcid.org/0000-0001-6359-211X Engenheira de Minas da Vale S.A. Mestranda
Universidade de São Paulo – USP Escola Politécnica
Departamento de Minas e de Petróleo São Paulo – São Paulo – Brasil [email protected]
Tatiane Marin Pesquisadora
Universidade de São Paulo – USP Escola Politécnica
Departamento de Minas e de Petróleo São Paulo – São Paulo – Brasil [email protected]
The impact of
payload truck factor
use in mine performance
reports for an open pit
copper mine in Brazil
http://dx.doi.org/10.1590/0370-44672017710189
1. Introduction
A database that attains information from several sources, such as Production Data Acquisition Systems or Manufac-turing Execution Systems, is inclined to have inaccuracies and inconsistencies (Reuter, 2016). Production reports that are date/time stamped or entail produc-tion volume data are susceptible to error through mechanical defects or human fault through manual reporting. The use of Key Performance Indicator and a continuous improvement program is widely used in the mineral industry (CROSER, 2005; NADER et al., 2012). However, the increased need for qual-ity data becomes even more crucial for manufacturing companies to improve efficiency and competitiveness, as it is an important prerequisite for intelligent factories, in which Cybernetic systems will operate autonomously based on ac-curate and consistent database reporting. Hardy (2003) emphasizes the im-portance of the transport fleet, since it
corresponds to 38% of the operational cost in open pit mines. It also addresses the accuracy of data from the truck weightometer: manufacturers warrant an error of 5%±, although the production reconciliation data point to larger errors.
One of the sources widely used for the control and monitoring of production is the datasets from Fleet Management Systems (FMS).
Most of the scientific articles focus on the automation and optimization of the truck dispatch rules (CHOI, et al.,
2009; ZHANG et al., 2015; DINDAR-LOO et al., 2015; CHAOWASAKOO
et al., 2017; MORADI AFRAPOLI and ASKARI-NASAB, 2017). The most practical subject with changes in the operation is the exchange of shifts (BASTOS, 2013).
The main objective of this article is to demonstrate the importance of the analysis of the database and to look for the operational causes of discrepancies.
In literature, the closest theme is HSU (2015), which analyzes two FMS datasets that indicate data corruption (software / hardware issues) or human error (op-erator input issues). However, the author does not seek the correlations between the database and the mining operation.
Truck factors are a widely used methodology, which allows small opera-tions to replace the need for the truck-mounted weightometer and large opera-tions to minimize reporting error due to truck weightometer defect. This case study considerers the timing in which the truck factor is applied to a dispatch sys-tem report, whereby, if the load measured by the truck weightometer, in real time, is lower than the weight of the average load, it marks the point where the truck factor is then implemented into the production data. A percentage of the average load defines the current truck factor number to be applied in any such case and is re-viewed to get as close as possible to the
actual loads realized in the operation. The dispatch system saves both records in the database - the original, measured by the weightometer and the newly created record (average payload set), although,
for performance reports the new values are set as the official.
Furthermore and specifically, for the mine in this case study, the quar-terly data set of the measured payload is
reviewed every three months with data categorized into three areas: transport fleet, excavation fleet and material clas-sification. An illustrative scheme, Figure 1, exemplifies this methodology.
Figure 1
Truck factor exemple,
payload records in white are modify.
The example above considered a 25% truck factor and the average payload set is 200 t. Defining a 25% truck factor means that every time the weightometer measures a load lower than 25% of the average set, the dispatch system will auto-matically create a new record in which the average is the value and it becomes then the official load. For example, considering a 220 t average payload set in the system, every time the weightometer measures a load lower than 165 t (75% of 220 t), the official load would be 220 t and no longer 165 t. The average payload set is the aver-age of the values of the last quarter that were not modified.
In the Figure 1 example, the factor was applied in four records - lower than 150 t and then these records now get a new value, which had been the aver-age previously set as 200 t. The averaver-age payload set for the next quarter is 206 t, average of values to which the truck factor was not applied. In theory, values greater than 125% of the average payload set are modified, but in practice these values do not occur, so in this work we only treat the lower limit.
As previously mentioned, the methodology purposes to mitigate er-rors in performance reports caused by mechanical weightometer defect,
which would otherwise generate data with lower production than actually executed. However, after analyzing data in this study, it is possible to state that if not regularly verified and updated, this methodology has the potential of increasing production that could affect production KPI’s, such as costs, pro-ductivity, and affect mine planning and equipment sizing. In addition, Renström (2010) shows in his work that there is another economic factor related to the filling of the load of the truck, in which the more complete the truck load, the lower the fuel consumption, considering the unit l / kt.km.
2. Methodology
The methodology used in this case study is composed by data collection, processing and analysis.
Data collecting: All data below were collected from dispatch database within a period of one year: loads measured by the weightometer; truck factor loads; excava-tors cycle time; excavator productivity; production and mass transported.
Data processing: All datasets were
extracted from the dispatch system, then analyzed and treated - outliers and small truck fleet data were not considered in the population. As aforementioned, in this case study, the average payload set is reviewed every quarter and updated in the system. In order to evaluate impacts, it was necessary to dispose the data in the same base for comparison – an average payload set for one of the periods was chosen and
applied on all datasets. An index was cre-ated for data analysis – known as percent-age of the truck factor application (%TF) and it is calculated as the total truck factor load divided by the total of loads.
Data analysis: after processing the data, we generate graphs in several pe-riods to find correlations of shifts, crew, fleet and operator. In addition, a test was performed by altering T.F.
3. Results
In this section, we present the analy-sis of the use of TF. The index represents the amount of changed data, e.g. TF = 30% means 30% of the measured masses
were changed to the mean value because the measurements in the system were wrong. The value of the variable is binary: mass changed or unchanged. Figure 2
445 The fleets are analyzed in Figure
3, %TF is much higher in CAT793 fleet
than CAT785, although for both fleets the index substantially increase during
the second semester in 2015.
Figure 3 Truck factor use for fleet by time.
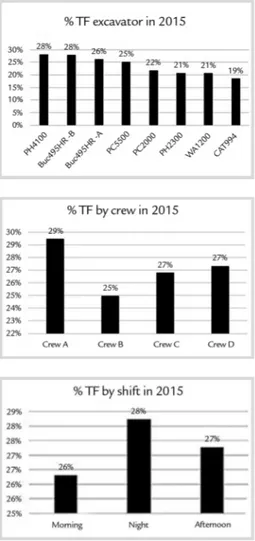
In order to compare the index in other bases, data was separated by excavation, crew and shift (Figure 4 – Figure 6). The data is whole dataset population from 2015:
• Excavator: It’s possible to notice a
trending %TF for each excavation fleet, which was not expected as trucks are not fixed in one excavator cycle.
• Crew: there is a high variance
among the crews that shows that even
with existing maintenance issues in trucks weightometers, there is also an evident operational behavior effect.
• Shift: A slight increase in %TF is
observed for night shifts. Figure 2
Truck factor use by time.
Figure 4 Truck factor use by excavator.
Figure 5 Truck factor use by crew.
Figure 6 Truck factor use by shift.
The analysis shown in Figure 7 was better-detailed to clear up any trending
behavior. The high rates found for crew A are even more evident after stratifying data
Figure 7
Truck factor use by crew/shift.
During the study, it was observed that the month of August, 2015 was the most critical (Figure 2: 32% use of T.F.), so additional analyses were performed for this month. The load factor modified 11.066 registers; half of the loads mea-sured (5516 registers) are zero, probably due to a communication failure between the weightometer and the dispatch
sys-tem. Despite the high number of zero values, the load factor was used many times, indicating a possible operational deviation. Detailed analyzes were per-formed to investigate the possibility of operational deviation.
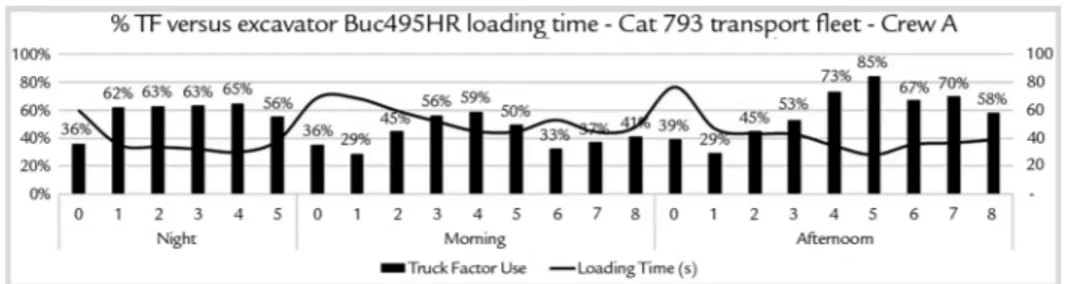
For a better understanding of the whole process, the %TF was analyzed in comparison to loading time for one
specific excavator and CAT793 fleet. The results in Figure 8 show that during the night (00h-06h) and afternoon (15h-00h) shifts, the %T.F is remarkably higher and loading time lower than the morn-ing shift (06h-15h), which is expected, as the morning shift coincides with the administrative work time and all leaders are on site.
Figure 9 shows the quantity of measured loads for two different opera-tors with different crews but during the same period of the day, as well as same excavator and same transport fleet. It is possible to identify very distinct behav-iors: until the load of 110 t, the behavior is the same (probably problems with the weightometer); from this point on there are operational differences, operator B loads less material than A. Operator A concentrates 53% of the loads whereby he
realized greater than 200 t and operator B realized only 12% of all loads around this tonnage. Operator B concentrates most of the loads around 150 t (30% lower than the average payload set – 220 t), in other words, the truck factor was applied in all those loads, showing a total production higher than that which was executed.
The most expressive result for this analysis is for operator’s productivity by excavator. Operator A performed 3.562 t/worked hours, and operator B achieves
5.573 t/worked hours. Although the productivity for the operator B is rather high, it is also not real for most truck factor loads. Another method to evaluate operator’s performance is by analyzing average loading time: for operator A, the average is 430 seconds and for operator B is 284 seconds, which endorses the fact that to reach this high performance, one needs to load less mass than the truck capacity, evidenced by short loading time.
Figure 9
Truck factor use by excavator operator. Figure 8
447 For analysis purposes, all the
mea-sured loads were calculated as a fraction
of the average previously mentioned (Equation 1).
Load Mass Fraction (LMF)
=
Average Payload Set-Load Mass
Average Payload Set
Equation 1
Where LMF (Load Mass Fraction) equals 1, means the load measured was zero. In this case, the truck factor set is 25%. Therefore when the LMF is less than or equal to 0.25 means that the load has not been modified, since it is lower than the TF. In order to facilitate the
visualization of the data, the zero load mass (LMF=1) was excluded from this analysis. The result is shown in the Figure 10.
For 97% of the loads (5393 regis-ters), the value measured was between 0.25 and 0.7 of the average payload set.
In this case the loads are possibly low due to loading issues and not weight-ometer defects. In other words, the TF should apply for loads 70% lower than the average and this study’s results show a probable inappropriate application of the T.F.
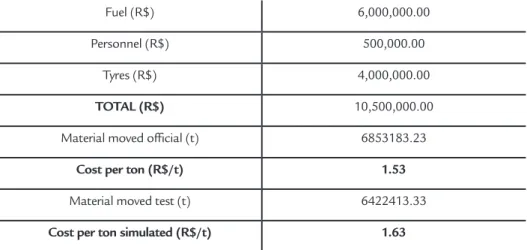
Using the previous dataset, a production test was made
consider-ing T.F as 70% instead of 25%. The results show a production 6% lower
than the official increase mining costs, as shown below:
Fuel (R$) 6,000,000.00
Personnel (R$) 500,000.00
Tyres (R$) 4,000,000.00
TOTAL (R$) 10,500,000.00 Material moved official (t) 6853183.23
Cost per ton (R$/t) 1.53
Material moved test (t) 6422413.33
Cost per ton simulated (R$/t) 1.63
An important topic to highlight is the zeroed loads measured by the weigh-tometer as being in accordance with off-highway truck provider because it could be caused by connectivity failure in the management system web. A secondary
im-pact from the currently used truck factor methodology is its influence on the average payload set. When modifying the factor to 25%, 50%, 75%, etc. it expressively affects the average load calculated. Taking a 220 t load as example and simulating the
truck factor as 25%, 50% and 75%, the inferior limit would be 165, 110 and 55 t respectively. In other words, any loads measured under these limits would not be part of dataset for average calculation (Figure 11).
Figure 11
Analyze of different truck factor, the payload values
in grey are used for average calculated.
4. Conclusion
References
Truck factor must be assessed and updated often to identify any changes of statistical data behavior. Each mine has individualities in its operations, therefore, it is suggested that each operation be calculated for its own factor and define average payloads by taking loading fleet, transport fleet, operators behavior, type of material mined, etc. into account. It is also very important to compare produc-tion data to the mine survey, as it can supply information in regards to the actual production and indicates the necessity of index review.
As the definition of average payload is affected by the truck factor set, it is also suggested to compare the new index calculated to the previous one set in the system, analyze the values calculated and treat it to minimize expressive impacts
on performance reports. The quantity of zeroed loads in database should be moni-tored, as it could be caused by communi-cation web failures and not necessarily by weightometer issues and might outcome in integrity data loss.
Using a very high T.F., such as 70% suggested means that a 220 t truck may be carrying 66 t, an unacceptable fact. However, the use of T.F. should be moni-tored to ensure that the data represent the operation, without disguising operational deviations.
The analysis between the two opera-tors demonstrates the case of operational deviation. In the information modified by the T.F., the operator B produces more than the operator A. However, in the measured loads the mass under the same conditions is lower, the productivity
is extremely high and the loading time operationally very low. This comparison suggests that operator B load less mass to have a higher productivity. This artifice is possible because low loads are corrected by T.F.
In short, the use of T.F. is important to correct measurement errors, but its use must be controlled to be of pre-established parameters. When using T.F., a cause-and-effect analysis should be performed.
This study might be applied in other operations under due adaptations for tracking inconsistencies on database purposes, which could permit better er-ror management and sensitively minimize impacts over mine performance and pro-duction reports, KPI’s, costs, operation technical parameters, mine planning, equipment sizing, etc.
BASTOS, G. S. Decision making applied to shift change in stochastic open-pit mi-ning truck dispatching. IFAC Proceedings Volumes, v. 46, n. 16, p. 34-39, 2013. Special issue: IFAC Symposium on Automation in Mining, Mine-ral and Metal Processing, 16th., Aug. 25-28, 2013, San Diego, California. DOI: https://doi.org/10.3182/20130825-4-US-2038.00090
CHAOWASAKOO, P. et al. Digitalization of mine operations: scenarios to bene-fit in real-time truck dispatching. International Journal of Mining Science and Technology, v. 27, n. 2, p. 229-236, 2017.
CHOI, Y. et al. Multi-criteria evaluation and least-cost path analysis for optimal hau-lage routing of dump trucks in large scale open pit mines. International Journal of Geographical Information Science, v. 23, n. 12, p. 1541-1567, 2009.
CROSER, A. Continuous improvement at a large open pit operation. The AusIMM Bulletin: Journal of the Australian Institute of Mining and Metallurgy, n. 4, p. 74-80, Jul./Aug. 2004.
DINDARLOO, S. R., OSANLOO, M., FRIMPONG, S. A stochastic simulation fra-mework for truck and shovel selection and sizing in open pit mines. Journal of the Southern African Institute of Mining and Metallurgy, v. 115, n. 3, p. 209-219, March 2015.
HARDY, R. J. Four-pass loading – Must-have or myth? In: LARGE OPEN PIT MINING CONFERENCE, 5th. Kalgoorlie, Western Australia. Proceedings...
449 Metalurgy Publication Series, 7/2003).
HSU, N. Data quality of fleet management systems in open pit mining: issues and impacts on key performance indicators for haul truck fleets. Kingston, Canada: Queen's University, 2015. 131p. (Thesis (Master of Sciences).
MORADI AFRAPOLI, A., ASKARI-NASAB, H. Mining fleet management systems: a review of models and algorithms. International Journal of Mining, Reclamation and Environment, p. 1-19, Jun. 2017. In press. DOI:https://doi.org/10.1080/1748 0930.2017.1336607.
NADER, B., TOMI, G. F.C., PASSOS, A. O. Key performance indicators and the mineral value chain integration. REM: Revista Escola de Minas, v. 65, n. 4, p. 537-542, 2012. DOI: http://dx.doi.org/10.1590/S0370-44672012000400015 RENSTRÖM, A. Productivity enhancements to increase ore production from 18 to
36 mt at Aitik. In: LARGE OPEN PIT MINING CONFERENCE, 7th. Perth, Australia. Proceedings... Melbourne: The Australasian Institute of Mining and Metallurgy, 2010. p. 115-120. (Australasian Institute of Mining and Metalurgy Publication Series, 5/2010)
REUTER, C. et al. Improving data consistency in production control by adaptation of data mining algorithms. PROCEDIA CIRP, v. 56, p. 545-550, 2016. DOI: https:// doi.org/10.1016/j.procir.2016.10.107. Special issue: [papers of] 9th International Conference on Digital Enterprise Technology – Intelligent Manufacturing in the Knowledge Economy Era; ed by Y. Li, J.Gao and P.Marapoulos, 2016.
ZHANG, L., XIA, X. An integer programming approach for truck-shovel dispa-tching problem in open-pit mines. Energy Procedia, v. 75, p. 1779-1784, 2015. DOI: 10.1016/j.egypro.2015.07.469. Special issue: Clean, Efficient and Affordable Energy for a Sustainable Future: 7th. International Conference on Applied Energy (ICAE2015), Abu Dhabi, United Arab Emirates, March 2015; ed. by J. Yan et al.