MASTER IN FINANCE
THIS REPORT WAS PREPARED EXCLUSIVELY FOR ACADEMIC PURPOSES BY CAROLINA MASSA AND LUÍSA GASPAR,MASTER IN
FINANCE STUDENTS OF THE NOVA SCHOOL OF BUSINESS AND ECONOMICS.THE REPORT WAS SUPERVISED BY A NOVA SBE FACULTY
Healthy lifestyles and moderate drinking are boosting the growth of low- and non-alcoholic beers and the expansion of the cider/perry market (consumption increased 19.2% in past 5 years). Furthermore, increase in disposable income is making consumers more willing to buy premium beverages (premium and super premium beer grew 3.1% and 5.0%, annually, since 2000).
Heineken is including non-alcoholic beverages in its offerings (launch Radler 2.0%; Radler 0.0%; and Heineken 0.0) and enhancing the higher brackets of its portfolio. Currently, it is the biggest cider producer worldwide (market share of 18.7%) and the largest international premium beer in the world (premium volume increased 17.6%, in past 3 years, representing, in 2017, 14.3% of total volume).
Company description
Heineken N.V. is a European-based global brewer. Currently, the company holds more than 250 brands in its beverage portfolio, which are sold in more than 190 countries, and operates 167 breweries, malteries and cider plants in more than 70 countries. Heineken is the #1 brewer in Europe and the #2 in the world.
“H
EINEKEN
N.V.”
C
OMPANY
R
EPORT
“
ALCOHOLIC BEVERAGES
”
J
ANNUARY2019
S
TUDENTS
:
“C
AROLINA
M
ASSA
&
L
UÍSA GASPAR
”
[email protected]
[email protected]
"Brewing” into new segments
Adapting to changing consumer preferences
Recommendation: BUY
Vs Previous Recommendation -
Price Target FY17: 97.52 €
Vs Previous Price Target -
Price (as of 31-Dec-18) 77.20 € Reuters: HEIN.AS, Bloomberg: HEIA:NA
52-week range (€) 86.93-77.20
Market Cap (€m) 43 979.5782
Outstanding Shares (m) 569.684
Source: Bloomberg, Analyst estimates
Source: Bloomberg, Analyst estimates
(Values in € millions) 2017 2018E 2019F
Revenues 21 888 23 422 23 675
EBITDA 4 939 5 311 5 422
EBITDA margin 22.6% 22.7% 22.9%
Net Profit 2 153 2 284 2 382
Net Profit margin 9.8% 9.8% 10.1%
NOPLAT 2 443 2 519 2 601
NOPLAT growth 20.5% 3.1% 3.3%
ROIC 8.4% 8.1% 8.2%
EPS 3.78 4.01 4.18
DPS 1.79 1.46 1.52
Source: Company information, Analyst estimates Heineken’s performance also relies on M&A deals. In
August 2018, it acquired a 40% stake on China Resources Beer Enterprise, which holds a position of 16.6% on the biggest beer market, Asia Pacific (beer consumption, in 2017, amounted to 717.3 million hectolitres). Furthermore, Asia Pacific expects to record a CAGR [2018 – 2031] on cider consumption of 4.8%. Heineken’s coverage is initiated with a BUY recommendation, given a 28.2% upside potential (capital gains of 26.3% and dividend yield of 1.9%). Heineken’s fair value, at 2019F, resulted from a DCF valuation, using a WACC of 4.57%.
“HEINEKEN N.V.” COMPANY REPORT
Table of Contents
COMPANY OVERVIEW ... 3
COMPANY DESCRIPTION ... 3 PERFORMANCE ANALYSIS ... 4 SHAREHOLDER STRUCTURE ... 5INDUSTRY OVERVIEW ... 6
EUROPE ... 6 Market overview ... 7 Competitive environment ... 8 Heineken ... 8 AMERICAS ... 9 Market overview ... 9 Competitive environment ... 10 Heineken ... 11AFRICA,MIDDLE EAST &EASTERN EUROPE ... 12
Market overview ... 13 Competitive environment ... 13 Heineken ... 14 ASIA PACIFIC... 15 Market overview ... 15 Competitive environment ... 16 Heineken ... 17
INDUSTRY TRENDS AND VALUE DRIVERS ...18
PREFERENCES SHIFTING ... 18
MARKET PREMIUMTIZATION ... 19
CROSS-POLLINATION INITIATIVES ... 19
LEGALIZATION OF CANNABIS ... 20
MACROECONOMIC DRIVERS ... 20
STRATEGIC PARTNERSHIPS – MARKETING ... 21
FORECAST ...23
REVENUES ... 23 OPERATING COSTS ... 25 CAPEX&NWC ... 25VALUATION ...26
ENTERPRISE VALUE ... 26 Discount rates ... 26 Sensitivity Analysis ... 27 Scenario Analysis ... 28 MULTIPLES VALUATION... 28APPENDIX ...29
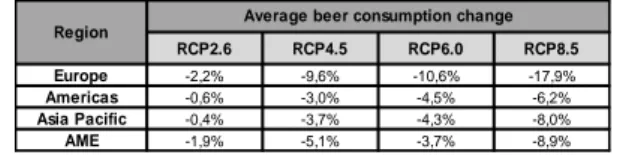
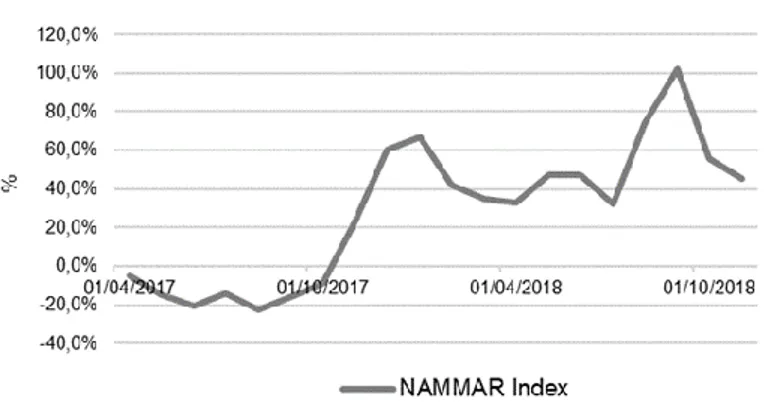
REPORT RECOMMENDATIONS ... 31CLIMATES CHANGES THREAT BARLEY PRODUCTION, IMPACTING BEER MARKET . 33 CANNABIS MARKET EXPANSION –THREAT OR OPPORTUNITY FOR BREWERS? .... 38
“HEINEKEN N.V.” COMPANY REPORT
Company Overview
Company Description
The Heineken N.V. Company was established in 1864 by the Heineken family, growing in the past 150 years from a single brewery in Amsterdam to one of the world’s most international breweries. The company is engaged in the production and sale of alcoholic beverages, namely, beer and cider. Currently, it holds more than 250 brands in its beverage portfolio, which are sold in more than 190 countries, and operates 167 breweries, malteries and cider plants in more than 70 countries. Heineken is the number 1 brewer in Europe and the number 2 in the World, behind Anheuser-Busch InBev, following the acquisition of SAB Miller by A-B InBev, in 2016. In 2017, Heineken sold 247.3 million hectolitres of beer and 4.3 million hectolitres of cider and reached € 22 529 million in revenues. In addition to its flagship brand, Heineken®, the company has other international beer brands, which includes low- and non- alcoholic beers, Craft and Specialty beers, Flavoured Beers and Cider Brands. The brands with more weight on revenues are the global brands - Heineken®, Amstel, Desperados and Sol; Craft and Specialty Beers- Affligem Abbey Beer; and Cider- Strongbow. Its diverse and wide brand portfolio allows Heineken to be well positioned in all segments of the market: premium, mainstream and economy. The company is the largest international premium beer in the world (in 2017, 14.3% of volume sold/ 36.0 million hectolitres was in the premium segment) and continues to expand its craft portfolio (acquisition of US-based Lagunitas). Furthermore, Heineken has been exploring opportunities resulting from a growing number of consumers worldwide appealing towards low- and non-alcoholic beers such as Radler (in 2015, Radler 2.0% and Radler 0.0% offers were expanded across all regions in over 45 markets) and Ciders (cider volumes sold increased 20.3%, in past 3 years). Currently, the company is the world’s biggest cider producer, having its brands available in over 50 markets. Its flagship cider brand is Strongbow Apple Ciders. The company operates through 4 regional segments: Europe (46.6%), Americas (28.6%), Africa, Middle East & Eastern Europe - AME (14.0%) and Asia Pacific (13.7%) and one segment related to common expenses: Head Office and Other/ Eliminations (-2.9%). Europe is the most important market for the company; nevertheless, it has a very strong position in Latin America and is investing in North America and Asia Pacific. In the last decade, Heineken has been increasing its exposure to emerging markets, which it expects to work as a catalyst for revenue’s growth and brand awareness. From 2014 to 2017, the weight on revenues of Americas increased 4.6% and of Asia Pacific 2.9%.
Heineken is the #1 brewer in Europe and #2 in the World.
Fig.1- Heineken’s brand portfolio
Source: Company website
Fig.2- Heineken’s revenues by region
Source: Company report
FLAGSHIP BRAND Heineken® Amstel Desperados Sol Tiger Tecade Red Stripe Krusovice Birra Moretti Af f ligem Lagunitas FLAGSHIP BRAND Strongbow Apple Ciders
Orchard Thieves Stassen Bulmers Old Mount Blind Pig
HEINEKEN BRAND PORTFOLIO
INTERNATIONAL BRANDS
CRAFT & VARIETY
B E E R CIDER BRANDS C ID E R
Fig.3- Heineken’s beer volumes (absolute
value and CAGR) by region (bubbles sizes refer to market size)
Source: Company report, Euromonitor, Statista
Fig.4- Heineken’s cider volumes (absolute
value and CAGR) by region (bubbles sizes refer to market size)
“HEINEKEN N.V.” COMPANY REPORT
The company stands out from other international brewers by its diverse range of products and its geographical diversification. Revenue breakdown per region of top-3 players in the market: Heineken, A-B InBev and Carlsberg reflect that Heineken has a more balanced geographic footprint. Following this higher degree of diversification, the company is less exposed to macroeconomic concerns (Heineken unlevered beta – 0.488 is lower than peers and industry average – 0.660) and shifts on consumer preferences, decreasing volatility at Heineken’s top line (revenues) and lowering operational risk.
Performance Analysis
Heineken’s performance is, mainly, dependent on 2 key value drivers: revenue growth, which is driven by total consumption of beer and cider and Heineken’s market share in each of these markets and return on invested capital (ROIC). Heineken registered, on global terms, annual growth rates of beer volumes above the market (CAGR [2012 – 2017] was -0.1%, for the market, and 4.5%, for Heineken). The company started to expand its cider portfolio in 2015, from which it also recorded annual growth rates of cider volumes above the market (CAGR [2015 – 2017] was 1.2%, for the market, and 6.8%, for Heineken). Revenue growth was mainly driven by market shares gains (organic growth has been increasing in the last 3 years) and M&A deals. Revenue grew at 6.5%, in 2015; however, it slowdown in 2016, due to negative impact from fluctuations in exchange rates, recovering in 2017, with 5.3% growth rate. Americas and Asia Pacific are the 2 regional segments, experiencing higher growth rates. In 2017, revenues increased organically in all regions, except for AME.
Gross profit margins have been fairly constant over the past years around 68%. Although costs with services, such as marketing, transportation, maintenance and warehousing, have been increasing in absolute value, as it would be expected with the increasing in revenues, it has been decreasing y-o-y as percentage of revenues, suggesting operational efficiency gains. Similarly, personnel costs were decreasing as percentage of revenues; however, last year, they rose due to acquisition of Brazil Kirin which increased the number of employees in Americas region. EBITDA margin have also been constant around 22 – 23%, with divergences mainly due to other income from sale of PPE and intangible assets. Abnormally high depreciations in 2016, due to impairment loses, led to the decrease of EBIT margin; however, normal levels were restored in 2017, with an EBIT margin of 15.3%. The average interest rate of past 4 years is 3.3%, without major fluctuations. Heineken has a gross margin above its biggest competitor and significantly above industry average and, in the past couple years, it has been improving its EBITDA margin. The company has in
Fig.5- Top-3 players’ revenue breakdown
Source: Company reports
Heineken’s value drivers are revenue growth and ROIC.
Fig.8- Industry top-players’ revenue growth
Source: Company reports
Fig.6- Heineken’s revenue growth rate
Source: Company report
Companies CAGR [2014 - 2017]
Heineken 4,4%
AB InBev 6,2%
Carlsberg -1,4%
Molson Coors Brewing 38,4% Boston Beer Company -1,5%
Diageo 5,5%
China Resources Enterprise Beer 2,9% Tsingtao Brewery -3,3%
Average 6,4%
Median 3,6%
Fig.9- Heineken’s operating costs structure 2017
Source: Company report
Fig.7- Heineken’s regional revenue growth
“HEINEKEN N.V.” COMPANY REPORT
place a disciplined working capital management, which is reflected on a negative cash conversion cycle that has been improving y-o-y, even with frequent M&A. Although Heineken has a high operating cycle (159 days), mainly, caused by inventories storage (98 days), the company benefits from high bargaining power against suppliers (of barley, hops, bottles and cans – 186 days).
Heineken’s ROIC has been between industry median and average and significantly above its top-2 competitors: A-B InBev and Carlsberg. In 2016, ROIC was lower than normal (6.9%) due to decrease in NOPLAT (-2.1%). However, recuperation of NOPLAT, which increased an exceptional 20.5%, in 2017, boosted ROIC to 8.5% (profit margin of 11.2% and invested capital turnover of 75.6%). The company is creating value, as the ROIC is higher than the estimate cost of assets (WACC = 4.57%). In the matter of ROA and ROE, Heineken is in line industry average, but once again substantial above its top-2 rivals. After a downturn in 2016, ROA has increased due to improvements in both net income margin and asset turnover ratio, achieving 5.2% (or 6.5% ignoring cost of debt), in 2017. ROE follows the trend of ROA as the equity multiplier has remain fairly stable over the last years. Therefore, after a slump in 2016, it recovered to 14.8%. The company is generating value for its shareholders, as the ROE is higher than the estimated cost of equity (Re = 5.2%).
The interest coverage ratio of 9.3x over the past couple years and the cash coverage ratio of 7.8x and 7.6x, in 2016 and 2017, respectively, signals a sustainable financing structure, as the likelihood of default is residual. Heineken’s dividend policy is to have a payout ratio between 30% and 40% of full year net profit (not considering exceptional items). Past 4-years average payout ratio was 36.5%, excluding exceptional items, and 49.8%, considering entire net income.
Shareholder structure
Heineken N.V. is controlled by a structure that ensures the Heineken family has the majority of voting rights (23.37%), ensuring full control of management and strategic decisions. FEMSA is the 2nd most important shareholder, with a 14.76%
position, although it has decreased its investment (sale of 5.24% of its investment), on September 2017, to take advantage of tax benefits. FEMSA is a multinational beverage and retail company headquartered in Mexico that operates as the largest independent Coca-Cola bottling group in the world and the largest convenience store chain in Mexico. The Hoyer family detains a smaller participation of 2.93%. The remaining shares (58.93%) are hold by the public. Heineken’s shares are traded on the Euronext Amsterdam, where the company is included in the AEX Index. As of end 2018, there were 569 683 655 publically listed shares.
Fig.11- Industry top-players’ cash cycle
Source: Company report, Bloomberg
Companies Gross margin EBITDA margin EBIT margin Heineken 69,7% 22,6% 15,3% AB InBev 62,1% 39,1% 30,4% Carlsberg 50,9% 22,1% 14,5%
Molson Coors Brewing 43,5% 23,1% 15,7%
Boston Beer Company 52,1% 19,3% 13,4%
Diageo plc 61,2% 32,5% 29,5%
China Resources Enterprise Beer 33,7% 12,3% 6,5%
Tsingtao Brewery 40,5% 12,1% 7,6%
Average 51,7% 22,9% 16,6%
Median 51,5% 22,3% 14,9%
Fig.10- Industry top-players’ margins
Source: Company reports
Companies Cycle (days)
Heineken -27
AB InBev -149
Carlsberg -80
Molson Coors Brewing -19
Boston Beer Company 29
China Resources Enterprise Beer 73
Tsingtao Brewery -26
Average -28
Median -26
Fig.12- Industry top-players’ return on capital
Source: Company report, Bloomberg
Companies ROE ROA ROIC
Heineken 14,8% 6,5% 8,5% AB InBev 7,2% 1,7% 5,9% Carlsberg 10,5% 3,9% 7,3% Molson Coors Brewing 20,2% 8,5% 10,6% Boston Beer Company 21,0% 14,9% 20,9% Diageo 28,3% 9,3% 14,1% China Resources Enterprise Beer8,2% 2,8% 6,3% Tsingtao Brewery 6,2% 3,3% 3,7%
Average 14,5% 6,4% 9,7%
Median 12,6% 5,2% 7,9%
Heineken’s main shareholders are the Heineken family and FEMSA.
Fig.13- Heineken’s shareholder structure
“HEINEKEN N.V.” COMPANY REPORT
Industry Overview
The beer industry, primarily, manufactures and distributes alcoholic beverages that use malted barley and hops, and non-alcoholic beverages. Beer is the most popular and widely consumed beverage, being just surpassed by water and tea. The cider/perry industry produces and distributes mainly low alcohol drinks by partial or complete fermentation of fruit juices. In 2017, total consumption of beer and cider amounted to 1 962.0 and 23.1 million hectolitres, respectively.
Consumers can purchase beer and cider though on-trade channels, which includes bars, pubs, and restaurants for immediate consumption and off-trade channels, which includes supermarkets, specialist retailers and convenience stores. Prices for on-trade are higher than for off-trade, as in addition to pay for the drink, the consumer is paying for the atmosphere and the entertainment. The top-3 players in the beer market are A-B InBev, Heineken and Carlsberg with a market share, in 2017, of 26.8%, 12.6% and 6.0%, respectively. A-B InBev reinforced its leading position with the acquisition of SAB Miller, in 2016. Heineken has consecutively been increasing its market share since 2012 (total increase of 2.3% from 2014 to 2017: of which 1.4% was organic). On the other side, Carlsberg has been losing market share to competitors. The top-2 players in the cider market are Heineken and Distell Group with a position, in 2017, of 18.7% and 16.0%, respectively. Heineken lost market share from 2012 to 2017; however, it has been starting to recuperate since 2015. In 2015, Heineken substantial expanded the geographical footprint of its cider portfolio, making it available to 41 markets and selling, for the first time, more than 1 million hectolitres outside the United Kingdom (UK).
There is a consolidation trend in the industry. A-B InBev is the company that accomplished more M&A deals, celebrating 22 big acquisitions on US, Colombia, Mexico, China, Brazil, Australia and Spain. However, following the acquisition of the 2nd largest company worldwide, SAB Miller, any future US acquisitions will
need to be reviewed by the US Department of Justice to address potential competition issues. Therefore, it is likely A-B InBev has already been looking outside the US for M&A opportunities. Heineken also acquired strategic players on US, South Africa, Italy and UK, in 2017. Molson Coors took full control of the Miller Coors joint venture in the US, in 2016, while Asahi purchased SABMiller’s European businesses. Carlsberg purchased London Fields Brewery, in 2017.
Europe
In 2017, 1 962 and 23.1 million hectolitres of beer and cider, respectively, were consumed worldwide.
Fig.14- Worldwide consumption in 2017 of
most popular drinks
Source: Euromonitor, Statista
Fig.17- Global market shares - Beer Source: Euromonitor, Company report
Fig.18- Global market shares – Cider/perry
Source: Euromonitor, Company report Fig.15- Average beer prices on-trade vs
off-trade (sample includes 75 cities worldwide)
Source: The Wall Street Journal, GoEuro
Fig.16- Revenues and volume of top-3 players
in 2017
“HEINEKEN N.V.” COMPANY REPORT
Europe is the world’s largest cider market, representing 51.9% of total consumption worldwide. On the other hand, it only accounts for 14.3% of total beer consumption. Heineken is present in 22 countries, where top brands include Heineken® and Desperados. Europe is Heineken’s biggest market in terms of total volume (38.9%) and beer volume (38.2%). Heineken is Europe’s leading brewer both in beer and cider markets, with a significant advantage over competitors.
Market overview
European countries have a well-established brewing tradition. Beer volumes have been around 280 million hectolitres, registering annual growth rates below 1%, from 2012 to 2017. This was mainly driven by the shrinkage of several national markets, highlighting, top-2 beer markets, Germany and UK, which decreased 3.5% and 2.4%, respectively, during the last 5 years. In contrast, other markets are gaining force, namely, Spain and France (+8.3% and +8.8%, respectively, from 2012 to 2017). Similarly, cider volumes have been around 12 million hectolitres, witnessing low and even negative annual growth rates, for the past 5 years. This follows the trend in the majority of national markets, highlighting the negative impact from Denmark (-22.1%, from 2012 to 2017). Germany, UK and Spain are some of the major beer markets in Europe, representing 32.1%, 16.0% and 13.2%, respectively, of European beer consumption, in 2017. France, Italy and Spain are slowly expanding beer volumes in the last years due to popularity of craft-beer. Even though, in Turkey, cider consumption decreased 2.2%, in the past 5 years, it is still the biggest European market with a share of over 70% of consumption. Finland, Greece and Portugal are also key markets with an aggregate contribution of 17.7%, in 2017. In Europe, off-trade dominates on-trade distribution channels on beer and cider markets (60.5% vs 39.5%, for beer and 63.7% vs 36.3%, for cider). In most of European countries, supermarkets (22.0%) and hypermarkets (28.6%) emerge as the most used sales channel owing to lower prices charged to consumers due to their ability to buy in bulk. Difficult economic conditions also contributed to the rise of discounters (6.7%) as another frequent distribution channel. Furthermore, online shopping is slowly gaining significance, leading brewers to search ways to leverage on that. For instance, Heineken, in 2016, established a partnership with Deliveroo, a British online food delivery company, across several cities in UK that allows consumers to order and get beer delivered at their houses in the space of 20 minutes. In 2017, it launched, in the Netherlands, Belgium, UK, France and Germany, an online craft & variety e-commerce platform called Beerwulf. In Europe, the European Union sets a minimum excise duty on beer of € 0.748 per
Europe represents 51.9% of beer market and 14.3% of cider/perry market.
Fig.19- Beer market in Europe
Source: Euromonitor, Statista, Business Wire, Analyst estimates
Fig.20- Cider/perry market in Europe Source: Euromonitor, Statista, Business Wire, Analyst estimates
Fig.21- Beer volume by country in Europe Source: Euromonitor
Fig.22- Cider volume by country in Europe Source: Euromonitor
Fig.23- Off-trade channels in Europe Source: Euromonitor
“HEINEKEN N.V.” COMPANY REPORT
hectoliter per degree of plato or € 1.87 per hectoliter per degree of alcohol, which has not change since 1992. However, rates differ widely among countries.
Volume decline, in beer and cider markets, is related with market maturity, premiumtization trend (consumers drink less but better), demographic structure and though economic conditions, particularly in Southern European markets such as Spain, Portugal and Greece. According to market trends and macroeconomic and social factors (explained in next chapter), the beer market is expected to grow at fairly constant rates of 0.6%, while the cider market exhibits more attractive prospects with annual growth between 0.8% and 1.2%.
Competitive environment
The beer market in Europe has several small regional players with redundant market shares and top-3 breweries which lead the market: Heineken, Carlsberg and A-B InBev, with markets shares of 33.7%, 10.5% and 10.1%, respectively, in 2017. Heineken is the #1 player, with a substantial advantage over #2 rival. To diversify its operations geographically, Asahi Breweries expanded to Europe by acquiring SABMiller’s Western European operations, in 2016, raising its position to 2.5%, in 2017. Being a mature market, the competitive landscape is not expected to change considerable; however, changing consumer patterns and rise of microbrewers may pose a challenge environment.
Similarly, the cider market is highly fragmented, with only Heineken concentrating a substantial market share of 27.1%, in 2017. Its closest competitor is Kopparbergs Bryggeri, a Swedish brewery and cider company, with 7.2% market share. Carlsberg and A-B InBev only had an aggregate position of 6.2%.
Heineken
Revenues in Europe increased organically, in the past years, which is reflected in organic market share gains in both beer (+0.5%) and cider market (+1.0%). Heineken was able to perform better than the market, in term of volumes, in recent years. Heineken’s beer volume hit a turnaround in 2015, increasing 3.9% that year, due to organic market share gain potentiated by successful campaigns with UEFA Champions League, James Bond and Rugby World Cup. However, there has been a deceleration with beer volume growing 2.4%, in 2016, and 0.4%, in 2017. On the other hand, from 2013 until 2015, cider volumes have been shrinking, with a turnaround in 2016. During 2015 and 2016, Heineken expanded its cider offerings from 25 to 41 markets. In the past couple years, Heineken increased its cider volume 1.7% each year, reaching more than 50 markets, in 2017. Furthermore, by 2016, low- and non-alcohol products
Market Beer Cider/perry
CAGR [2012A - 2017A] -0,1% -0,3% CAGR [2018E - 2023F] 0,6% 1,1% CAGR [2024F - 2031F] 0,6% 1,0% Fig.24- Online sales as percentage off-trade
channels in Europe
Source: Euromonitor
Fig.25- GDP per capital annual growth rate Source: World Bank
Fig.27- Beverages market growth in Europe Source: Euromonitor, Statista, Business Wire, Analyst estimates
Fig.28- Europe market shares - Beer Source: Euromonitor, Company report
Fig.29- Europe market shares - Cider Source: Euromonitor, Company report
Fig.30- Revenue growth rate in Europe Source: Company report
Fig.26- Beer excise duty per hectoliter per degree
of plato across European countries
Source: European Commission, Directorate-general Taxation and Custom Union (July 2018)
“HEINEKEN N.V.” COMPANY REPORT
represented around 5.0% of beer volume in Europe. In 2017, Heineken sold almost 13 million hectolitres of low- and no-alcohol products.
To counter European markets volume stagnation and lever on current trends with growth potential, Heineken reinforced its position on craft-beer and low- and non-alcoholic beers. In 2017, the company acquired a minority stake on Brixton, a craft brewery based in London, and bought Birrificio Hibu, a craft brewery and brew pub in Italy (investment expected to be completed by spring 2019, increasing brewing capacity from 12,000 to 60,000 pints a week), especially focused in Indian Pale Ale’s beer. Furthermore, it continued to invest in pubs in UK, acquiring approximately 1,900 pubs from Punch Taverns, in 2017, by € 448.1 million. This deal turned Heineken into the 3rd largest pub company in the
UK, with 1 995 pubs, after Greene King (over 2 900 pubs) and Enterprise Inns (over 5 000 pubs). In addition, it launched Heineken® 0.0, in 2nd quarter 2017, a
non-alcoholic beer, in 16 markets, during the Formula 1® Grand Prix in Barcelona. In June 2018, Heineken acquired a minority stake on Beavertown Brewery, a premium craft brewer recognised in UK and worldwide, through an investment of around € 44 million. Moreover, in December 2018, it acquired a 51% stake on La Cibeles, a microbrewery producing small range of artisan beer in Spain, with sales of € 825 000.
Americas
Americas is the world’s 2nd largest beer and cider market, responsible for 29.8%
of total beer and 17.4% of total cider consumption. Heineken is present in 9 countries, operating 19 majority-owned breweries and 8 joint venture breweries. In addition to Heineken®, top brands include Dos Equis and Tecate. Americas is the 2nd most important beer market for Heineken, representing 31.4% of total
volume and 31.8% of total beer volume, in 2017. Heineken occupies the 3rd place
in the competitive landscape of the region in both markets.
Market overview
Beer volume, in 2017, amounted to around 584.6 million hectoliters, registering a low CAGR of 0.1%, in the past 5 years, drove by the shrinkage of beer market in countries such as Canada, Brazil and Venezuela. This was mainly counteracted by strong growth in top markets such as Mexico and Colombia and other countries such as Peru and Chile. In contrast, cider market in Americas has been expanding, registering a CAGR, from 2012 to 2017, of 11.0% and attaining around 4.0 million hectoliters, in 2017. This expansion was mainly, due to a growth in volumes in North America (US and Canada consumption increased 162% and 132%, respectively, in the course of only 5 years).
Heineken Beer Cider/perry
CAGR [2012A - 2017A] 0,0% -0,4% CAGR [2018E - 2023F] 0,7% 1,8% CAGR [2024F - 2031F] 0,6% 1,1%
Americas represents 29.8% of beer market and 17.4% of cider/perry market.
Fig.31- Heineken in beer market in Europe Source: Company report, Euromonitor, Statista, Business Wire, Analyst estimates
Fig.32- Heineken in cider market in Europe Source: Company report, Euromonitor, Statista, Business Wire, Analyst estimates
Fig.33- Heineken growth in Europe Source: Company report, Euromonitor, Statista, Business Wire, Analyst estimates
Fig.35- Cider/perry market in Americas Source: Euromonitor, Statista, Business Wire, Analyst estimates
Fig.34- Beer market in Americas
Source: Euromonitor, Statista, Business Wire, Analyst estimates
“HEINEKEN N.V.” COMPANY REPORT
The US is the biggest beer and cider market in Americas, representing 41% and 54% of beer and cider consumption, respectively. Even though the Brazilian beer market has been contracting, it still is the 2nd biggest beer market in Americas,
responsible for 23% of consumption. Another important country is Mexico, which has been expanding due to improvement of living standards and represents 13% of total beer consumption. Developed countries, namely, US and Canada have been playing an important role in the propagation of cider consumption, representing together almost 70% of consumption. Nevertheless, this tendency is spreading to emerging economies such as Brazil (consumption increased 12.2% in the past 5 years) and Argentina (21% of consumption).
In Latin America, off-trade dominates on-trade distribution channels on beer and cider (60.9% vs 39.1% for beer and 81.8% vs 18.2% for cider). In North America, off-trade channels are also more used than on-trade channels (75.7% vs 24.3% for beer and 74.8% vs 25.2% for cider).Supermarkets (28.4% / 30.5%) and hypermarkets (15.6% / 4.5%) play a relatively small role in off-trade beer sales across the majority of Latin / North America, resulting from the fragmented retail industry in the region. The most important distribution channel are specialist drink outlets or independent stores (32.6% / 41.9%). Brewpubs are also emerging as a popular way used by microbrewers to generate interest of consumers. In Canada, there was a slight change in excise beer taxes, on April 2018, from $ 2.643 to $ 2.683 per hectoliter. In the US, in December 2017, the Congress approved a temporary reduction in federal excise taxes on beer, for a period of 2 years, according to the Tax Cuts and Jobs Act. In Latin America, countries report minimum excise taxes as percentage of selling price: Argentina – 8.0%; Brazil – 5.0%-15.0%; Chile – 10.0%-50.0%; Mexico – 26.5%; and Venezuela – 15.0%. Shrinking of beer and cider market in Venezuela is related to deterioration of macroeconomic conditions, significantly rises in prices (inflation in 2015 - 112% and in 2017 – 2400%), difficulty in obtaining raw materials and complications for consumers to have access to essential goods (currency devaluation due to high inflation – August 2018, currency devaluated 95%). Declining disposable income in countries, such as Brazil and Argentina, are causing consumers to cut back on discretionary spending. According to market trends and macroeconomic and social factors (explained in next chapter), the beer market is expected to grow around 1.0% and 1.4%, while the cider market grows at more moderated level.
Competitive environment
The beer market in Americas region is highly consolidated, with top-3 players: A-B InA-Bev, Molson Coors and Heineken accounting, in aggregate terms, for 80% of total beer volumes, in 2017. In North America, A-B InBev and Molson Coors, in
Fig.36- Beer volume by country in Americas Source: Euromonitor
Fig.37- Cider/perry market in Americas Source: Euromonitor, Analyst estimates
Fig.38- Off-trade channels in Latin America Source: Euromonitor
Fig.39- Off-trade channels in North America Source: Euromonitor
Fig.40- GDP per capita annual growth rate Source: World Bank
Fig.41- Beer excise duty per gallon across US Source: Federation of Tax and Administrators (February 2018)
“HEINEKEN N.V.” COMPANY REPORT
2017, have a market share of 43.6% and 26.0%, respectively. It has proven to be a difficult market to penetrate, explaining that even though Heineken has been expanding volume sold, its market share was only 4.3%, last year. In Latin America, A-B InBev, once more, takes the lead with a market share of 64.8%, in 2017. Heineken follows, with a market share of 19.3%. Americas became the largest regional market of A-B InBev, in 2013, after the acquisition of Modelo, reinforcing its contribution with the company’s acquisition of SABMiller.
In the cider market, Boston Beer takes the lead with a market share of 28.4%, followed by Cía Cervecerías Unidas with a position of 9.9%, in 2017. Heineken is ranked 3rd player, with a market share of 7.9%. In North America, in the cider
market, there are 3 significant players: Boston Beer, Heineken and A-B InBev, with positions of 41.5%, 11.6% and 7.3%, in 2017, respectively. None of them is present in Latin America. Instead, the cider market in Latin America is dominated by regional brands such as Cía Cervecerías Unidas, a Chilean beverages company, and Bodegas Cuvillier, an Argentinean brewer.
Heineken
Revenue growth in Americas, in 2015 and 2016, was, mainly, driven by increases in organic market share gains in beer market (+0.9%). In 2017, the majority of growth is inorganic; nevertheless, organic market share still increased 0.3%. Heineken was able to grow above the market both in beer and cider volumes. The vast majority of its volumes are contributed by the 2 leading markets: Brazil and Mexico. In the past 4 years, beer volumes’ annual growth rates rounded between 4-5%, with exception of last year which registered a growth rate of 31.7%, mainly driven by acquisition of Brazil Kirin. On the other hand, cider volumes witnessed double digits annual growth rates from 2012 until 2017, being the latter a particular strong year with a growth rate of 19.4%.
Heineken’s excellent performance in 2017 can be explained by the expansion of its brand portfolio and acquisition of strategic players in the region. In February 2017, Heineken added Kirin Brasil to its Brazilian operations, through an investment of € 664.0 million, significantly increasing its exposure to the region: Heineken became the 2nd largest brewery in Brazil, raising its position from 7% to
17%. Moreover, the deal allowed Heineken to acquire mainstream brands such as Schin and Devassa and speciality brands Baden and Eisenbahn and to expand its soft drinks portfolio through the Itubaína brand. Additionally, this acquisition allowed Heineken to strengthen its operational independence in Brazil, as it gained control of a vastly improved distribution network and strong commercial platform. Previously, the company relied on a partnership with Coca-Cola to ensure distribution across the country. Moreover, in the same month, on
Fig.44- Americas market shares – Cider
Source: Euromonitor, Company report
Fig.47- Heineken in cider market in Americas Source: Company report, Euromonitor, Statista, Business Wire, Analyst estimates Fig.42- Beverages market growth in Americas Source: Euromonitor, Statista, Business Wire, Analyst estimates
Fig.43- Americas market shares – Beer
Source: Euromonitor, Company report
Fig.45- Revenue growth rate in Americas Source: Company report
Fig.46- Heineken in beer market in Americas Source: Company report, Euromonitor, Statista, Business Wire, Analyst estimates
Market Beer Cider/perry
CAGR [2012A - 2017A] 0,1% 11,0% CAGR [2018E - 2023F] 1,4% 0,7% CAGR [2024F - 2031F] 1,0% 1,1%
“HEINEKEN N.V.” COMPANY REPORT
a deal amounted to € 440.0 million, it acquired 50% of American craft beer Lagunitas, levering its position to 100%, which will help to penetrate in the US. Lagunitas is the market leader in the IPA segment, selling over 1 million hectolitres, per year, which will reinforce Heineken’s craft-beer portfolio. On February 2017, Heineken undertook an investment of € 440.0 million to open a brewery in Mexico, with a production capacity of 6 million hectoliters per year, which will produce leading brands such as Tecate, Dos Equis and Heineken® for the Mexican market and for export. This plant was designed to operate 100% from renewable energy. Furthermore, by 2020, it is expected to only use 2 litres of water for every litre of beer produced instead of the current 3.6 litres.
In May 2018, Heineken announced it acquired a minority stake in Belize Brewing, which is Belize's market leader in beer and acts as an important distributor of Heineken’s brands Heineken®, Amstel and Red Stripe. This acquisition expands Heineken geographical footprint. Heineken is facing some problems concerning the rights to spring water supplying an important Heineken plant in Brazil, Bahia, bought in 2017 as part of the acquisition of Kirin Brazil operations. Heineken has assured that this will not affect the factory’s operations and business performance is improving; however, investors got nervous which could be reflected on the decline share price in the second half of 2018, around 6.1%. Regarding potential acquisitions, Heineken could take full control of Compañía Cervecerías Unidas, in Chile, in which Heineken already has a major stake (60%). The total takeover could expand Heineken’s footprint as it produces over 24.8 million hectolitres of beverages, reaching over 286 000 customers in Chile and Argentina (28.5 and 0.8 million hectoliters of beer and cider, respectively, consumed, in 2017, in aggregate terms). Another opportunity arises in Brazil, by acquiring Cervejaria Petrópolis, which has a 4.9% market share in Latin America beer market, after a failed attempt in 2012. Furthermore, a partnership between Molson Coors and Heineken could also be settled, as there is already a strong collaboration between them: the former distributes most of the Heineken brands in Canada and the later distributes Coors and Miller in Mexico and Bahamas.
Africa, Middle East & Eastern Europe
AME accounts for 19.4% and 23.7% of total beer and cider consumption worldwide, respectively. Heineken is present in 23 countries and produces many iconic brands in the region, namely Star®, in Nigeria, and Primus®, which is brewed in 4 Central African countries. AME represented 18.7% of total Heineken volume and 18.8% of beer volume, in 2017. Heineken occupies the 3rd place in
the beer market and the 2nd place in the cider market.
Heineken Beer Cider/perry
CAGR [2012A - 2017A] 7,7% 21,3% CAGR [2018E - 2023F] 2,6% 3,0% CAGR [2024F - 2031F] 1,3% 1,5%
AME represents 19.4% of beer market and 23.7% of cider/perry market.
Fig.48- Heineken growth in Americas Source: Company report, Euromonitor, Statista, Business Wire, Analyst estimates
“HEINEKEN N.V.” COMPANY REPORT
Market overview
After beer volume shrinkage until 2015, the beer market hit a turning point in 2016, when it registered a positive growth rate of 1.3%, attaining 379.7 million hectolitres, in 2017. This weak performance of beer market until 2015 is due to significant decrease in beer volumes in the major markets, such as Russia (-27.1%) and Ukraine (-39.29%). Contrariwise, the cider market has been in strong expansion, recording a CAGR of 7.1%, between 2012 and 2017, attaining 5.5 million hectolitres, in 2017. Soft drink positioning in many Muslim-majority markets allows access to a far wider consumer pool than alcoholic beers.
The continuous decline in beer consumption in Russia was driven by regulatory and legal changes imposed by the government (tripling excise taxes and imposing strict restrictions on sales, advertising and consumption, in 2010) and by severe macroeconomic conditions, namely related to the drop in oil price. Nevertheless, the country continues to assume the leading position in the beer market, accounting for 15.7% of total beer consumption, followed by Poland (8.4%) and South Africa (7.0%). South Africa also has an important role in the cider market, as it represents 54.7% of consumption.
In AME, off-trade channels display a major role, especially looking to Eastern Europe markets, where off-trade channels are responsible for over 80% of traded beer and for over 75% of traded cider, above the worldwide averages. In fact, even though modern grocery retailing chains have emerged, the majority of Eastern countries still rely their activity in small and traditional groceries (21.4%). Nonetheless, the trend towards modernization and urbanization is expected to positively impact the on-trade channels, namely the brewpubs.
The rise in disposable income, namely in the countries who lead both markets, combined with a change in consumption patterns have been driving the increase demand since last year, especially for cider. The region, which includes underdeveloped countries, is also benefiting from projects towards high levels of urbanizations and development of distributions channels. According to market trends and macroeconomic and social factors (explained in next chapter), both beer and cider market are expected to record growth rates above 1% and 2%, respectively.
Competitive environment
The beer market in AME is marked by the presence of several market players with small positions and is dominated by top-3 players: A-B InBev, Carlsberg and Heineken that have an aggregate market share of 43.3%, in 2017. Considering the Eastern Europe beer market, Carlsberg assumes the leading position, with a
Fig.52- Cider volume by country in AME Source: Euromonitor
Fig.49- Beer market in AME
Source: Euromonitor, Statista, Business Wire, Analyst estimates
Fig.50- Cider/perry market in AME
Source: Euromonitor, Statista, Business Wire, Analyst estimates
Fig.51- Beer volume by country in AME Source: Euromonitor
Fig.53- Off-trade channels in Eastern Europe Source: Euromonitor
Fig.54- Off-trade channels in Africa & Middle East Source: Euromonitor
“HEINEKEN N.V.” COMPANY REPORT
position of 21.2%, followed by Heineken, which controls 18.2% of the market. However, Carlsberg has gradually been losing market share, whereas Heineken has been gaining exposure, owing to offer of non- and low- alcoholic beers. The former has suffered from its exposure to Russia market and its consequent downturn in beer consumption. On other hand, in Middle East and Africa, A-B InBev assumes the leading position, holding a stake of 33.0%, since 2016, when it acquired SAB Miller. In fact, until that point AB InBev used to have a residual stake in the region (0.5%) and SAB Miller was the uncontestably market leader. Additionally, Diageo and Castle Group detain substantial positions.
The cider market is highly consolidated, being controlled by Distell Group, Heineken and Carlsberg, with market shares of 66.4%, 9.8% and 7.0%, respectively. Small players are gradually penetrating the market due to the craft trend across the region, but it has not really impacted the market yet. In Eastern Europe, Carlsberg and Heineken have been dominating the cider market, controlling over 46.0% of the market, in the last 5 years. In Middle East and Africa, Distell, which is not present in the Eastern Europe market, clearly monopolizes the market, holding a stake of 86.2%. Nonetheless, the rivalry with Heineken, which reached a share of 7.8%, in 2017, expanding its positioning from previous stakes around 2.0%, caused Distell to lose share of the market.
Heineken
Growth in revenues in AME was driven by organic market shares gains in beer market (+0.1%, in 2015, and +0.4%, in 2017). Although the beer market in AME has been sluggish during the last 5 years, Heineken was able to outperform the market. It also experienced negative growth rates from 2013 to 2015; however, it started to expand in 2016, following the industry trend, recording an annual growth rate of 5.4%. On other hand, enjoying the expansion of the cider market, Heineken recorded a CAGR of 44.7%, from 2012 to 2017.
Heineken’s expansion was largely driven by the macroeconomic trend in its major markets, namely South Africa, Nigeria and Poland. Moreover, M&A strategy also contributed for Heineken’s performance. In Africa and Middle East, it acquired 75% stake in DHN Drinks and 15% of Namibia Breweries Limited and gained control over the Sedibeng Brewery. This restructuring process costed Heineken € 138.0 million. In Eastern Europe, it acquired 53.43% stake in Pivovarna Lasko, the leading Slovenian brewer, by € 119.5 million. This acquisition strengthened Heineken’s position within the region and brought 2 additional strong local brands (Lasko and Union) to its portfolio. In 2017, Heineken opened the first brewery in Mozambique, with a production capacity of 0.8 million hectolitres, by investing € 85.0 million. This acquisition particularly
Fig.57- AME market shares - Beer Source: Euromonitor, Company report Fig.56- Beverages market growth in AME Source: Euromonitor, Statista, Business Wire, Analyst estimates
Fig.60- Heineken in beer market in AME Source: Company report, Euromonitor, Statista, Business Wire, Analyst estimates
Market Beer Cider/perry
CAGR [2012A - 2017A] -0,8% 7,1% CAGR [2018E - 2023F] 1,7% 3,8% CAGR [2024F - 2031F] 1,1% 2,7% Fig.55- GDP per capita annual growth rate Source: World Bank
Fig.58- AME market shares - Cider Source: Euromonitor, Company report
Fig.59- Revenue growth rate in AME Source: Company report
“HEINEKEN N.V.” COMPANY REPORT
challenges its main competitor A-B InBev, who also gained a brewery in Mozambique through the acquisition of SABMiller. Additionally, Heineken launched Heineken 0.0 in Russia, attempting to lessen the impacts from regulation. Furthermore, it acquired 2 breweries in South Africa: Stellenbrau and Soweto. Those deals allowed Heineken to include in its portfolio brands such as Craven Craft Lager, Jonker’s Weiss, Alumni Ale and Governor’s Red rooibos lager, increasing the value of its intangible assets around € 85.0 million. Following the launch, in 2016, of Salone, a 100% locally sourced sorghum beer, in Sierra Leone, Heineken opened a new brewery, in Ivory Coast, in 2017, Brassivoir (51% owned by Heineken and 49% owned by CFAO), with an annual production capacity of 1.6 million hectolitres. This costed € 150 million. In November 2018, Heineken signed an agreement to acquire 100% of Browar Namysłów, by €115.92 million, one of the largest regional breweries, in Poland, with an annual production of about 1.7 hectolitres.
There are some windows of opportunity for Heineken regarding potential partnerships or acquisitions that could certainly boost its expansion in this region. Considering that Heineken has already a stake of 29.9% in Namibia Breweries, its acquisition could be one to be taken into consideration given its total share of 69%, in Namibia market, and 3%, in South Africa (beer consumption, in 2017, amounted to 32.2 million hectolitres). Nevertheless, the opportunity that stands out is the possible acquisition of Castel, one of the main players in Middle East and Africa. The Group produces 28 million hectolitres of beer and soft drinks in Africa, annually, and sponsors relevant teams and events, namely the South African Cricket, Rugby Teams and “Bafana Bafana”. However, this can be a deal hard to reach given the regulatory authorities, the family bonds to the brand and the presence of A-B InBev, also running for its acquisition.
Asia Pacific
Asia Pacific is the world’s largest beer market, responsible for 36.6% of total beer consumption worldwide. On the other hand, it only represents 6.9% of total cider consumption worldwide. Heineken is present in 19 countries, holding 45 breweries, which are responsible for the production and distribution of around 50 brands. Top brands include Tiger®, which has grown to become a major global brand, Kingfisher®, that is India’s best-selling beer, and Bintang, that is Indonesia’s most iconic beer brand. It represents 11.0% of total Heineken volume and 11.1% of total beer volume, in 2017. Heineken occupies the 7th place region
beer market and the 3rd place in the cider market.
Market overview
Heineken Beer Cider/perryCAGR [2012A - 2017A] 0,6% 44,7%
CAGR [2018E - 2023F] 1,8% 5,7%
CAGR [2024F - 2031F] 1,1% 3,0%
Asia Pacific represents
36.6% of beer market and 6.9% of cider/perry market.
Fig.61- Heineken in cider market in AME Source: Company report, Euromonitor, Statista, Business Wire, Analyst estimates
Fig.62- Heineken growth in AME Source: Company report, Euromonitor, Statista, Business Wire, Analyst estimates
Fig.63- Beer market in Asia Pacific
Source: Euromonitor, Statista, Business Wire, Analyst estimates
“HEINEKEN N.V.” COMPANY REPORT
Although the beer market in Asia Pacific has presented moderate growth rates in 2014 and even decreased in the subsequent 2 years, driven by deceleration in nominal GDP growth, it has started to recuperate in 2017, registering an annual growth rate of 1.4%. Beer volumes, in 2017, amounted to 717.3 million hectolitres. On the other hand, the cider market, in the past 5 years, recorded double digits annual growth rates, attaining around 1.6 million hectolitres, in 2017. Nevertheless, there has been a deceleration on cider volumes expansion, with volumes, in 2017, growing 8.2%.
The emerging economies China, Vietnam and India have been playing an important role in the expansion of beer consumption, while Taiwan and Thailand provide a significant contribute to the expansion of cider consumption. China represents around 60% of total market in Asia Pacific. Even though Japan is still the 2nd biggest consumer of beer in Asia Pacific (7.8%), the beer market size has
been decreasing since 2015, from 60.3 million hectolitres to 57.8 million hectolitres, in detriment of the expansion of cider market, which suggests a slightly change in Japaneses’ patterns of consumption.
In Asia Pacific, there is an equilibrated distribution among off-trade and on-trade distribution channels, for both markets. Nonetheless, in the beer market, the off-trade channel displays a more dominant positioning, accounting for 53.2% of the whole distribution, in 2017, whereas in the cider market, the on-trade channels assume a more relevant role, being responsible for 56.5% of sales. Supermarkets (30.5%) and hypermarkets (10.8%) represent an important supply chain due to a more flexible negotiation between companies and these chained retailers. On other hand, it also benefits companies as it decreases its logistics costs and allows for economies of scale. In Asia Pacific, there is already a considerable share of distribution through online platforms, reflecting the different cultural mind-sets and stages of these countries. Most countries belonging to Asia Pacific display a severe regulatory environment regarding beer consumption. On average, they apply excise taxes between 30% and 50%. Indeed, the growing population, especially youth, has been boosting the acceptance and adoption of beer and cider in Asia Pacific. Additionally, the increase in disposable income and improvement of living standards have also contributed to this cultural change in their habits and preferences. According to market trends and macroeconomic and social factors (explained in next chapter), the cider market offer particularly attractive prospects with growth rates above 4%, while the beer market grows at more moderated rates.
Competitive environment
Fig.65- Beer volume by country in Asia Pacific Source: Euromonitor
Fig.66- Cider volume by country in Asia Pacific Source: Euromonitor
Fig.64- Cider/perry market in Asia Pacific Source: Euromonitor, Statista, Business Wire, Analyst estimates
Fig.67- Off-trade channels in Asia Pacific Source: Euromonitor
Fig.68- Online sales as percentage off-trade
channels in Asia Pacific
Source: Euromonitor
Fig.69- GDP per capita annual growth rate Source: World Bank
“HEINEKEN N.V.” COMPANY REPORT
The beer market in Asia Pacific is highly fragmented with a lot of players with market shares between 0.1% and 4%, emerging 3 players which dominate the market: China Resources Enterprise, A-B InBev and Tsingtao Brewery with market shares, in 2017, of 16.6%, 14.3% and 11.2%, respectively. Beijing Yanjing Brewery and Carlsberg also detain a sizeable participation of the beer market of 6.5% and 5.9%, respectively. Heineken is ranked as the 6th largest
brewery in the region, with a position of 3.8%, in 2017.
The cider market is controlled by Carlsberg, A-B InBev, Heineken, Kirin Holdings and Åbro Bryggeri with market shares of 27.1%, 19.1%, 15.6%, 13.4% and 8.3%, respectively. Important to note that A-B InBev was not present in the Asia Pacific cider market until it acquired SAB Miller, jumping to the 2nd leading position.
Heineken
The main driver of Heineken’s expansion in this region comes from its ability to acquire positions on strategic market players to penetrate new markets, expanding its capacity and brands’ portfolio across several countries. Nevertheless, the region still registers positive organic growth driven by organic market share gains in beer market. Heineken was able to record exponential volume increase in 2013 (triple digit growth), maintaining considerable annual growth rates in the following years. The CAGR, from 2012 to 2017, was 45.6%. Enjoying the expansion of the cider market, it outperformed the industry growing at 96.9% p.a., from 2012 to 2017. Biggest market share gains happened in 2013 and 2015, for both markets, which coincides with strategic acquisitions and expansion of brand portfolio by launching Radler, in 2014, and launching internationally Strongbow, in 2015.
There is a long historic of acquisitions. In 2017, Heineken completed the merger of its business in Mongolia with APU JSC, the country’s leading beverage business, retaining 25% of the merged business afterwards. Moreover, in order to accelerate its expansion in Australia and reinforce its relation with the company Lion Beer Australia, it signed a new Trade Mark Licensing and Distribution Agreements, which costed around € 5.0 million, regarding the brands Heineken® and Birra Moretti, respectively. This allowed Heineken to be considered an international brand produced in Australia rather than an import, as it happens with the brands Guinness and Stella Artois. It also contributed for the expansion in the premium segment, which represents around 10% of Australian beer market. Furthermore, allowed Heineken to access the distribution network of Lion Nathan. Additionally, it acquired Tuatara craft brewery, one of the biggest players in the country (production capacity of around 2 million hectolitres), through its subsidiary DB Breweries, by € 3.2 million.
Fig.71- Asia Pacific market shares - Beer Source: Euromonitor, Company report
Market Beer Cider/perry
CAGR [2012A - 2017A] 0,2% 11,4% CAGR [2018E - 2023F] 1,1% 5,8% CAGR [2024F - 2031F] 0,7% 4,0%
Fig.72- Asia Pacific market shares - Cider Source: Euromonitor, Company report
Fig.73- Revenue growth rate in Asia Pacific Source: Company report
Fig.74- Heineken in beer market in Asia Pacific Source: Company report, Euromonitor, Statista, Business Wire, Analyst estimates
Fig.75- Heineken in cider market in Asia Pacific Source: Company report, Euromonitor, Statista, Business Wire, Analyst estimates
Fig.70- Beverages market growth in Asia Pacific Source: Euromonitor, Statista, Business Wire, Analyst estimates
“HEINEKEN N.V.” COMPANY REPORT
Recently, on August 2018, Heineken invested € 2.2 billion in the acquisition of 40% of China Resources Holding, China’s largest beer company, to strengthen its distribution network and its position as leader in premium beer. In the aftermath of the announcement, there was a positive market reaction, with stock price rising 2%. China is the largest beer market in the world with an annual consumption of 457.8 million hectolitres, twice as much as the US, and more than 5 times as Germany, the largest beer market in the EU. However, macroeconomic, legislative and political events can threat Heineken’s expansion, since the country faces tremendous challenges, both internally and externally, mainly regarding its high levels of indebtedness (total debt represents 257.1% of GDP) and trade issues ($ 250 billion of Chinese goods were hit by US with tariffs since July, and China has retaliated by imposing duties on $110 billion of US products. China’s economic growth has been cooling, and its growth rate is decreasing to values around 6.5%).
Potential deals include San Miguel Corporation, in Philippines, and Boon Rawd, in Thailand. San Miguel has a 90%, 29% and 16% share in the Philippines, Indonesia and Hong Kong markets, respectively, that had an aggregate beer consumption of 24.5 million hectolitres, in 2017. Its biggest shareholder is Kirin Holdings (48%). Boon Rawd has a 59% share in the Thailand market (in 2017, beer and cider consumption amounted to 20.8 and 0.1 million hectolitres, respectively). Its biggest shareholder is Thai Beverage Company (33%).
Industry Trends and Value Drivers
There are, currently, 4 global trends on the alcoholic beverages industry: preferences shift towards non- and low-alcoholic drinks; market premiumtization; cross-pollination initiatives; and legalization of cannabis. In addition to these trends, alcoholic beverages consumption is also impacted by macroeconomic and demographic factors. Furthermore, marketing investments, namely strategic partnerships, particularly with the sports industry, drives consumption and determines engagement with customers through increase in brand awareness.
Preferences shifting
Healthy lifestyles and moderate drinking are shifting consumer preferences towards low- and non-alcoholic products across all categories. Beer companies are diversifying their portfolio by including non-alcoholic beer; radler; and cider in their offerings. Furthermore, brewers promote responsible drinking. In fact, 10% of Heineken’s expenditure on marketing is on advertisement initiatives that
Heineken Beer Cider/perry
CAGR [2012A - 2017A] 45,6% 96,9% CAGR [2018E - 2023F] 4,3% 7,0% CAGR [2024F - 2031F] 1,4% 4,2% Fig.76- Heineken growth in Asia Pacific Source: Company report, Euromonitor, Statista, Business Wire, Analyst estimates
Fig.77- Global beer growth by alcoholic
strength (CAGR[1999 – 2017])
“HEINEKEN N.V.” COMPANY REPORT
promote moderate alcohol consumption. Low- and non- alcoholic offers are very attractive, because these beers are sold for prices not much different from standard beers (for instance, a 6 pack of 330ml bottles of regular Heineken is sold by € 12.83, while Heineken 0.0 is sold at € 11.45), though falling into lower tax brackets, which allows brewers to collect higher margins.
A survey by Global Data concluded that 84% of worldwide alcoholic beverages consumers are trying to reduce or moderate their alcohol consumption. Another survey by Global Data concluded that 37% of consumers intend to reduce their alcohol consumption for health reasons, being this trend stronger among the male population than the female population (39% vs 34%) and among the younger layers of population (18 – 34). Moreover, data shows these concerns are more evident on emerging regions. Low- and non- alcoholic beer have been growing at rates above the market, registering, globally, a CAGR, over the past 2 decades, of 3.6% and 4.0%, respectively. Despite the trend towards alcohol free beers, beers with strong alcohol content are growing even faster, at 4.1% p.a. over last 2 decades, due to growth of craft and premium beer.
Market premiumtization
Driven by GDP growth and expansion of economies, the alcoholic beverages industry is witnessing a premiumtization trend, with consumers more willing to pay more for quality. Beer companies are working to enhance the higher brackets of their portfolios through premium beer and more niche offerings such as craft and specialty beer. High-value brackets of the market are very attractive to brewers as it allows to charge higher prices to consumers.
A survey by Global Data concluded that 37% of worldwide alcoholic beverages consumers are willing to pay more for a drink that can provide extra levels of enjoyment and indulgence. Premium and super premium beer have been growing at rates above the market. Over the past 2 decades, globally, premium beer has grown by 3.1% p.a. and super premium beer by 5.0% p.a. compared to 1.6% growth in mainstream and economy beer. Furthermore, flavoured beer and beer mixed, which belong to premium category, increased significantly, above the market, in detriment of traditional beers such as lager and stout.
Cross-pollination initiatives
To attract more consumers, especially millennials and generation Z, beer companies will need to make radical experiments with hybrid products straddling category lines. Those cross-pollination initiatives may result from combining lager and ale yeast strains; changing ageing time of beer barrels or joining hops to gin, for instance. These offers are inserted in the premium segment of the market,
Fig.78- Proportion of population trying to
reduce alcohol consumption due to health reasons
Source: Global Data
Fig.79- Proportion of population who reads
nutrition content of beer before buying
Source: Global Data
Fig.80- Global beer growth by price segment
(CAGR[1999 – 2017])
Source: Global Data
Fig.81- Global beer growth by category
(CAGR[1999 – 2017])
“HEINEKEN N.V.” COMPANY REPORT
allowing breweries to charge higher prices to consumers. According to Zenith’s market study, these types of beer are, on average, priced up to an additional € 2.22 per litre, compared to standard beer products.
New styles and fusions are gaining popularity, namely Hazy and Juicy IPA’s (known as “New England Style” Indian Pale Ale), a beefed-up version of pale ale beer, which is made with lactose, oats, vanilla, fruity hop varieties and high-pectin fruit. According to IRI Worldwide, global sales grew by more than € 155 million, in 2017, which corresponds to a 16% increase. Another unexpected partnership gaining momentum is between breweries and beekeepers. There is a growing number of breweries establishing relationships with beekeepers or installing their own hives, namely in United States. In 2014, in the first Craft Brewers Conference, 20% of the brewers were already brewing with honey. This percentage increased to 80% in the last year.
Legalization of cannabis
The rise of interest towards cannabis, particularly in North America, may potentially cause disruptions on the alcohol industry through substitution, for example. However, it can also represent an opportunity, as consumers show curiosity in consuming beers with infusion of the cannabis plant.
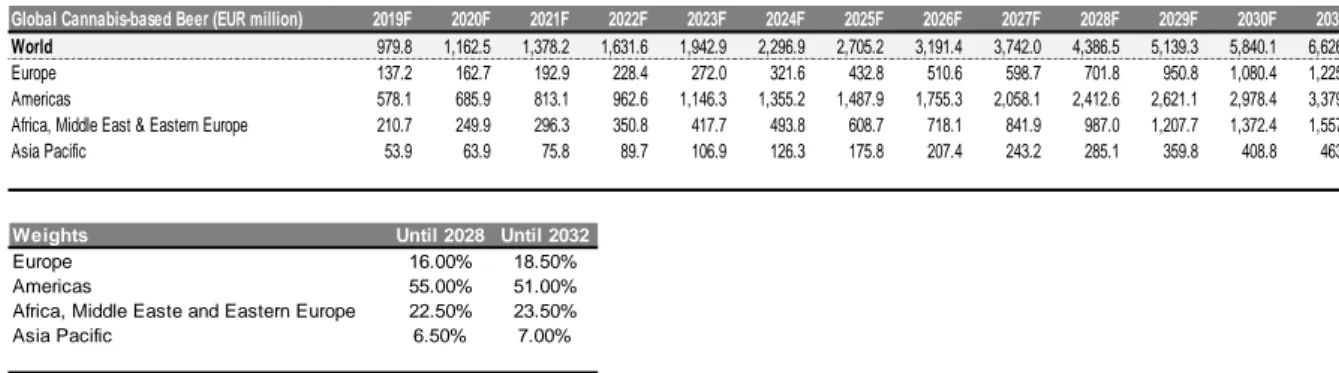
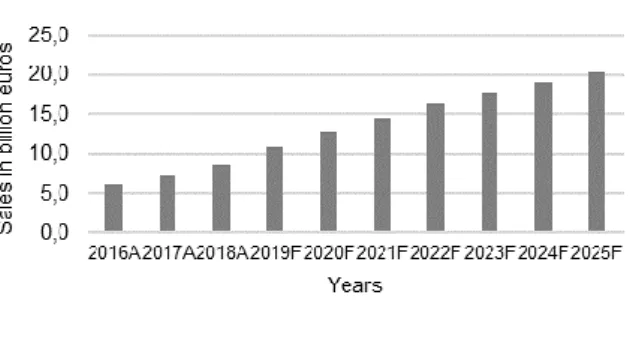
Cannabis, for recreational use, is already legal in 9 states in the US and became legal in Canada on 17th October 2018, with supply exhausting after only 2 days. Given the recent legalization, Canada is the market that offers higher growth prospects; nevertheless, California and Nevada are attractive markets within the US. Consumers are interested in consuming edibles and concentrates, in addition to simple flowers (particularly, 14% of US consumers indicated they prefer to consume cannabis on liquid form by infusion on beverages). The global alcoholic beverages- based cannabis market size is estimated to be around €1 218.1 million, in 2019, reaching € 7 122.6 million by 2031. The global cannabis-based beer market represents 77.5% of the total alcoholic beverages.
Macroeconomic and demographic drivers
Consumption of alcoholic beverages is, also, influenced by macroeconomic indicators, namely, growth in disposable income; by demographic indicators, explicitly, the population growth rate and the age profile of population; and by beverages prices and consumers’ sensitivity to price changes.
After the great recession, economies started to recuperate (increase in nominal growth rates). Emerging and developing regions, namely, Latin America, Africa, Middle East & Eastern Europe (AME) and Asia Pacific exhibit growth rates above
Fig.82- IPA popularity Source: IRI Worldwide
Fig.83- Pricing standard vs cross-pollinated
beer
Source: Zenith Global Ltd 2017
Fig.84- Number of cannabis users worldwide Source: Statista
Fig.85- Sales of recreation cannabis in the US Source: Statista
Fig.86- Sales of recreation cannabis in
Canada
Source: Statista
Fig.87- Preferred forms of cannabis’
consumption in US