Equity Market Timing,
How Long Does It Last?
David Ferreira Lopes
Dissertation written under the supervision of Diana Bonfim
Dissertation submitted in partial fulfilment of requirements for the MSc in
Finance, at the Universidade Católica Portuguesa, January 2020.
David Lopes 152418009
Equity Market Timing, How Long Does It Last?
Abstract
Market timing is a very well-known investment strategy, albeit a difficult one to execute properly. Equity market timing is a type of market timing investment plan whereby a company issues equity when their market price is high and repurchases equity when the price is low. The cost of equity for a firm can be lowered by taking advantage of such fluctuations. This analysis documents the importance of market equity timing as a facet of real financial policy, with very persistent effects when observing present capital structures. Results indicate that subsequent capital structures are derived from the incremental outcome of managers’ historical attempts to time the equity market.
Keywords: Market Timing, market-to-book, equity
Timing do Mercado de Capital Próprio, Quanto Tempo Dura? Abstrato
Timing do mercado é uma estratégia de investimento muito conhecida no mundo
financeiro, mas de difícil execução. Timing do mercado de capital próprio é um plano de investimentos em que a empresa emite ações quando o seu preço de mercado é alto e recompra ações quando o seu preço é baixo, quando comparado com antigos valores de mercado e contabilísticos. Aproveitando essa flutuação, a empresa consegue reduzir o custo do capital em comparação com outras formas de financiamento externo. Esta análise documenta que a estratégia de timing é um especto importante e real na política financeira das diferentes empresas, com efeitos muito persistentes na estrutura de capital das mesmas. Os resultados indicam que a atual estrutura de capital é o resultado incremental de passadas tentativas feitas pelos gerentes em ordem de avaliar o mercado de capitais.
Acknowledgments
I would like to take this part of the thesis to show my gratitude towards people that really influenced not only my dissertation but my master, reaching this point was only possible because of this major elements that influenced the process of the same, giving me guidance, strength and mostly support.
Firstly, I would like to thank my supervisor Diana Bonfim. I always thought the thesis would be a very difficult time period of my academic life. Although it gave me a lot of work, I can say that it would be more difficult without the professor and the excellent guidelines she gave me and my seminary colleagues. The guidelines and presentations always improved my work and made me push even harder to know more about the subject I am writing.
I would also like to thank my parents and brother; they always illuminated my path even in the difficult times showing me what unconditional love means. I will always have the deepest gratitude for their sacrifices, for always making me feel special and different and for investing in me and always giving me the best so I can go out there chasing my dreams.
I am also indebted to my best friends, especially Miguel, he’s always pushing me forward and show me different perceptions about numerous subjects. I wouldn’t probably be in this position if he didn’t show me that I can always improve and do even better with its motivation, work ethics and friendship.
And lastly, to the friends I made this last year on the master. Mariana, Afonso, Carlos and Francisco, without their presence this will be impossible, we shared the same pain and difficulties, but we really understand and helped each other, making me happier with life and motivated just because they were always there for me and with me. Now looking at all we accomplished from the finish line, I know it was all worthy.
Index
1. Introduction ... 6
2. Literature review ... 10
2.1 Trade-off Theory ... 10
2.2 Pecking Order Theory ... 11
2.3 Managerial Entrenchment Theory ... 12
2.4 Market Timing Theory ... 12
3. Methodology ... 14
3.1 Data and Summary Statistics ... 14
3.2 Regressions ... 18
3.2.1 Annual changes in leverage ... 18
3.2.2 Factors of Leverage ... 20
3.2.3 Persistence ... 22
4. Results ... 24
5. Discussion and Limitations ... 40
6. Conclusion ... 42
7. Robustness Check ... 43
8. References ... 47
Content Table
Table 1: Summary statistics ... 16
Table 2: Determinants of changes in leverage ... 25
Figure 1: Explanatory power (R-Square) of capital structure factors as firms age ... 28
Table 3: Factors of leverage ... 30
Table 4: Factors of leverage – Different Control Variables ... 33
Table 5: Factors of leverage - Cumulative Changes from Pre-IPO ... 35
Table 6: Persistence of Market-to-book ... 37
Table 7: Robustness Check – Book Leverage ... 44
Table 8: Correlation Matrix ... 52
Table 9: Standard Deviation of Determinants of Change in Leverage ... 53
Table 10: Standard Deviation of Factors in Leverage ... 54
Table 11: Sic Code Portfolios ... 55
Table 12: Robustness Check – Market Leverage ... 57
1. Introduction
Market timing is a very recognized investment strategy, although opinions within the literature diverge on the ease of its execution, most authors advocate that it is a relatively difficult type of trading which can only be properly accomplished by managers and individuals with high levels of financial knowledge and skills. Equity market timing is a type of investment plan where the company issues equity when their market price is high and repurchases equity when the price is low. By taking advantage of such fluctuations, a firm can lower the cost of equity compared to the costs of other capital sources and thus benefit from them.
In a completely efficient marketplace, as first mentioned by Modigliani and Miller (1958), different capital forms possess the same costs, thus there is no benefit from opportunistically switching between types of financing. Such conditions do not arise in the real world, and there are certain costs which must be necessarily taken into account when choosing means of external financing. Within an inefficient capital market, shareholders will profit from market timing. Therefore, if managers think they can time the market, undertaking such an approach will likely come across as a signal that they care about investors.
Several previous works of research on the subject have suggested that market equity timing is an important aspect within real financial policy.1 On preliminary evidence, it appears
clear that when the market value of a company is high when compared to previous market and book values, the firm will tend to issue equity rather than debt, and when the market valuation is low the firm will tend to repurchase shares.2 The following evidence provided insight into
capital structures and subsequent long-term stock returns, suggesting that market equity timing is normally effective, rendering equity issues appealing when the cost of equity is low, and vice versa3. The authors of a third separate analysis further observed that companies have a tendency
to issue equity when stakeholders are excited about forecast results and earnings.4 A fourth set
of authors, Harvey and Graham (2001) performed an anonymous survey of various CFOs, who acknowledged attempts to time the market. 2/3 of chief financial officers within this survey further disclosed that both overvalued and undervalued stock prices influence the issuing of
1 See Alti (2006), Baker and Wurgler (2002), and others.
2 Concurring with the works of Marsh (1982), Taggart (1977), Jung, Kim and Stulz (1996), Hovakimian,
Opler and Titman (2001), Pagano, Panetta and Zingales (1998), Ikenberry, Lakonishok and Vermaelen (1995), Jung, Kim and Stulz (1996), and others.
3 See Ritter (1991, 1995), Jegadeesh (2000), Stigler (1964), Ikenberry (1995), Fama (1998), Norli et al.
stock, and recent stock price increases made them even likelier to attempt to sell the stock at an even higher price. Stock prices were voted the second most important aspect when making the decision on whether or not to issue equity.
The main research goal of our study is to identify the means through which equity market timing influences a company’s capital structure, and whether such an influence has short- or long-term effects. Given the extensive research within the literature, the existence of a short-term impact should be evident. Nonetheless, the existence of a long-term impact is more questionable since companies can balance and dilute the effects of equity market timing. Classical financial literature suggests as much, meaning that there is little if any consensus on this approaches’ theoretical long-term effects.
The results we obtained concur with the theory that shows that the effects of market timing are not only persistent, they also have a significant impact on a firm’s capital structure. Firms with low leverage increase funds when the market value is high (measured by the ratio market-to-book), while firms with high leverage tend to increase their funds when the market value is low.
The results of our analysis were obtained through statistical regressions, the majority of these consisting of Ordinary Least Squares (OLS), while some applied the Fama-Macbeth method. Leverage ratio and variations of the same variable always take the position of dependent variable, while independent variables change throughout our analysis. One of the most relied upon ratios was the external financing weighted average market-to-book ratio, or 𝑀/𝐵𝑒𝑓𝑤𝑎 ratio for short. This independent variable is a weighted average of previous
market-to-book ratios which takes external financing, debt or equity into consideration. The ratio returns high values for firms that have already raised external financing in the past, when the market-to-book ratio was high, while returning a low value if a company raised external financing when the market-to-book value was low. The application of this ratio enables us to conclusively propose that leverage and historical data were strongly and negatively correlated. These results are robust and economically significant regardless of whether the relationship is tested against the book or market valuation.
It became clear further into our work that previous valuations have a persistent impact on capital structures. In order to measure this persistence, we implemented three different types of tests. The first one uses leverage as a dependent variable, while controlling for the actual market-to-book ratio, leaving the external financed weighted average ratio to capture solely the firm’s in-house fluctuation. The discovered variation helped to explain the capital structure outcomes, suggesting that these momentary fluctuations in the market values lead to perpetual
modifications in the company’s capital structure. The second test utilizes the original levels of capital structure and proceeds to assess how successive oscillations in market values affect a firm’s capital structure. A third test is also applied whereupon we checked the power of the weighted average ratio lagged values, discovering that the impact of this variable on the capital structure lasted for more than 10 years. These results suggest that the capital structure of 2018 depends strongly on the market-to-book oscillations that existed in 2008 and earlier. This variation presented within the market-to-book ratio has long term influences on capital arrangement, rendering our results difficult to explain by relying solely on traditional capital theories.
The market-to-book ratio is a measure of investment opportunities and risk of capital structures. Trade-off theory forecasts that fluctuations in this indicator should be momentary if one is to achieve an optimal capital arrangement. This suggestion was not verified by our results, with these temporary effects being instead shown to be very persistent. On the pecking order theory, Myers reports that managers try to prevent issuing equity, and on a dynamic version they reduce leverage to increase the probability of investment. Our results did not concur with this theory either, with the robust relationship we found between long-term investment prospects and leverage being particularly difficult to explain under this theoretical framework. The entrenchment theory proposed by Zwiebel (1996) however, is mainly concurrent with our statistical results. Periods in which a company has high market values can lead to the entrenchment of management, resulting in a reduction of the relevance of an optimal point for the capital structure as external debt financing options will tend to be resisted.
The simplest and most direct way to explain the results of our paper, is that a firm’s capital structure is the incremental outcome of all managers’ historical attempts to time the equity market. The two versions of market equity timing could also clarify these outcomes. The first version of these, expanded upon by Myers and Majluf (1984) integrated rational agents and adverse costs, which are inversely connected to the market-to-book ratio. In the second version of market equity timing, company managers look at investors as irrational agents, and thus assume that the increase of equity usually happens in an abnormal way when its cost is low. Both versions require adverse selection costs to reduce desirability on market timing. Although both are consistent with our results, the second one appears more appropriate for our purposes, given earnings and long-run evidence.
Everything discussed in this section will be expanded upon and presented in more detail throughout our work in the following sections. The thesis is divided into a literature review
(section 3), a results section (section 4), a discussion & limitations section (section 5), followed by a section containing our conclusions (section 6). Robustness checks (section 7) and an appendix will be provided at the end (section 9).
2. Literature review
Looking at the current market context, a significant number of different debt and equity instruments can be found. A firm’s capital structure can possess a variety of compositions depending on the different instruments that companies choose to rely upon for self-financing. Some companies may decide to finance themselves only through debt or equity, while others may find that the perfect spot is somewhere in between, choosing instead to mix both approaches. Even the earliest analyses of capital structures have seen authors trying to find the perfect capital structure to maximize a firm’s market value. A straight answer has continue to elude researchers, resulting in the continuation of this topic as one of the most widely discussed within the finance literature.
On this section, we will address some important topics and findings within the wider existing body of literature that will serve as a basis for our study and its theoretical framework.
2.1 Trade-off Theory
The first formal proposal for the trade-off theory was published by Kraus and Litzenberger (1973). This theory was derived from what is arguably one of the most important papers in finance literature, Modigliani and Miller’s 1963 work. In this seminal piece, Modigliani and Miller stated that debt can maximize a firm’s value (i.e., by contracting more debt the company can take advantage of the deductible tax). They further proposed that although debt is a cheaper way of financing the company when compared to equity, one should refrain from analyzing debt solely from this perspective since adding debt also increases the probability of financial distress (Ang, Chua and McConnel (1982) and Jensen and Smith (1984)).
It is important to note that different companies will possess different debt percentages, and that managers will always attempt to pursue optimum ratios (Marsh (1982)). In order to reach the ideal point of debt, one should look at the marginal value of tax on increasing debt in a manner that minimizes capital costs while maximizing a company’s value. This evidence suggests that healthier companies should take advantage of debt, but many authors over the years have digressed and offered counter propositions, suggesting instead that: higher non-debt tax shields indicate less debt (DeAngelo and Masulis (1980)); too much debt can lead to asset substitution and conflicts of interest between bond- and share-holders (Fama and Miller (1972)
and Jensen and Meckling (1976)); there is no evidence that tax shields increase the value of a company (Fama and French (1998)).
The book-to-market ratio is an important indicator in this dissertation study and can be connected to different aspects of our main relied-upon theory, particularly when assessing the costs of financial distress. Firms with growth and investment opportunities are those that lose more with debt, since a significant debt burden can prevent new capital from being raised (Myers (1976); Smith and Watts (1992); Barclay, Smith and Watts (1995) and Rajan and Zingales (1995)). However, trade-off theory literature establishes a main relation between market-to-book and capital structure saying that capital structures will slowly respond to the market-to-book ratio.
2.2 Pecking Order Theory
This theory first saw the light of day in Donaldson’s 1961 paper, before being further developed by Myers and Majluf (1984), with the notion of optimal structure disappearing, along with the suggestion that capital structures should be seen as an asymmetric conflict between inside and outside financing. This asymmetry can vary in its impact and effect on the moment of choice for not only inside and outside financing, but also between debt and equity.
CEO's will typically prefer to rely upon internal rather than external financing options, not merely because they possess more information within the firm than outside firm financiers, but also because external financing will invariably mean that managers lose their information advantage. This model thus proposes that managers will tend to prioritize the choosing of internal funds, followed by debt, and only then followed by equity. Furthermore, in situations where a firm has a lack of investment opportunities, managers tend to retain earnings in order to build a financial stack in order to prevent outside financing in the near future, with equity issues only taking place when the risk of bankruptcy is too big (when debt costs are large). When a company decides to issue shares, investors start to ponder whether this is taking place because the manager believes them to be currently overvalued in the market. If the firm issues debt however, investors are likely to think that the company is undervalued.
A well performing company following the precepts laid out by this theory should have a lower debt ratio, given that these ratios should only increase when the firms need outside financing. There are significant difficulties to the analysis of the relationship between book-to-market and capital structure values through the 1st theory proposed, also denominated as static
decrease leverage to avoid equity investments in the future (Myers (1984) and Fama and French (2000)).
2.3 Managerial Entrenchment Theory
Managerial entrenchment takes place when a manager invests in order to increase his value as an employee, rather than to benefit the company’s finances. This is essentially the topic under discussion on Zwibel’s (1996) paper, “Dynamic Capital Structure under Managerial Entrenchment”. The underlying idea in this case is that equity financing is facilitated through high valuations and good investments, but it also allows managers to become rooted. This theory in itself has some intrinsic connection to market timing, since managers issue equity when the market value of the company is high.
2.4 Market Timing Theory
The theory of Market Timing will provide the theoretical foundation for this paper’s results. This principle has been widely discussed within the literature, resulting in the creation of three very important versions of equity market timing. The last one by Baker and Wurgler (2002) states that the actual capital structure is given by the cumulative past outcomes of managers trying to time the equity market. We expect this version to provide the most appropriate and accurate explanations for the results of our study.
The genesis of the first dynamic version can be found in Myers and Majluf’s 1984 paper, incorporating rational agents, namely managers and investors, while also taking the variation of adverse selection costs into account, not only between firms, but across different timeframes as well. This theory experienced a significant number of changes since its inception (Lucas and McDonald (1990); Korajczykm Lucas and McDonald (1992) and Choe, Masulis and Nanda (1993)) and even some authors have found that equity issues tend to be announced following the release of information which could potentially reduce information asymmetry (Korajczyk, Lucas and McDonald (1991)), or that equity issues clusters around times of smaller announcement effects (Bayless and Chaplinsky (1996)).
The second dynamic version follows an altogether different train of thought, affording greater consideration to irrational agents and time-varying mispricing. This version of the theory suggests instead that managers issue equity when costs are low and repurchase when expenses are high. One important aspect of this second dynamic is that the market does not
need to be efficient, it does not assume that managers successfully predict stock returns, it simply suggests that they believe they can truly time the market.
The market-to-book ratio has different interpretations regarding these different dynamics. Within the paper made by Myers and Majluf, this ratio measures variations in adverse selection. Furthermore, the second dynamic version suggests that book-to-market extreme values are connected to extreme investor expectations, while being historically inversely related to future equity returns (La Porta (1996); La Porta, Lakonishok, Shleifer and Vishny (1997); Frankel and Lee (1998) and Shleifer (2000)). The paper published in 2002 saw them applying this same ratio for the purposes of measuring the market timing opportunities observed by managers.
3. Methodology
The existing literature drawn upon throughout this paper largely suggests that individual financing will tend to depend on the market-to-book ratio. Our goal within this thesis is to document the cumulative effect of the market-to-book ratio in the current capital structure of a company while also, as suggested by the market timing strategy, assessing whether this ratio has persistent effects which are reflected on the capital structure through net equity issues.
3.1 Data and Summary Statistics
The main sample for this model was extracted from COMPUSTAT, with firms present between 1987 and 2018 within this database being selected for our study. Only companies for which the IPO date could be defined as taking place between those 30 years became part of our final sample. 5 Knowing the IPO date enabled us to control the leverage behavior and assessing
how it changed over a given timeframe, while also checking the relationship between leverage and the market-to-book indicator.
In order to create the sample, we relied upon 3 different databases: COMPUSTAT, Jay Ritter, and Screener. IPO dates were not directly extracted from COMPUSTAT given the database’s inconsistency in this variable.6 This shortcoming led us to rely on the Jay Ritter and
Screener (provided by Thomson Reuters) databases for identifying the specific IPO dates, mirroring the data sources used by Wurgler, Baker (2002), and Ritter (2003) in their previous, rigorous studies. It should be noted that these databases will only identify the subset of COMPUSTAT firms that will be used in the analysis.
The IPO year is reported as the first-year market value data available on COMPUSTAT. Our sample was further restricted to eliminate companies with a SIC code between 6000 and 6999, also identified as financial companies. This specific set of firms was excluded due to their inherent and abnormal leverage ratio values. While these are by no means unusual for financial companies, such high levels will typically serve as significant indicators of financial distress in the majority of other company types (Fama and French (1992)). Other types of companies which we excluded from our sample include: Firms with a value of book assets less than $10 million for the purposes of removing relatively small companies, firms with missing values on
the variable assets between the year they went public and the year they exited COMPUSTAT, and firms with a single year of available data.
In order to create all the variables required for our report, some variables which were already presented through the COMPUSTAT database needed to be combined into new ones. These will be expanded upon below.
Book equity is thus the result of total assets and convertible debt minus total liabilities, preferred stock, or redemption value of the same when the first one is missing, along with deferred taxes. Book debt is simply the difference between total assets and book equity. Both variables will be used for the purposes of calculating book and market leverage. The first one is calculated by dividing book debt by total assets, while the second one is calculated by dividing book debt by total assets, before adding market equity minus book equity. Market equity is a relatively straightforward calculation, taken from the multiplication of outstanding common shares outstanding by price (Fama and French (2000)). Net equity issues (e/At) represents the change in book equity, minus the change in retained earnings, all then being divided by total assets. Newly retained earnings (∆RE/At) represents the change in retained earnings, divided by assets. Finally, net debt issues (d/At) is simply the residual change in assets divided by total assets. 7 After calculating and creating all of these variables, the sample was
restricted even further by excluding firm-year observations with a book leverage above 1 or below 0.
This analysis is reported in IPO years, relying upon different subsamples holding the number of fiscal years of a company following an IPO date. As such, k in the term IPO+k indicates the number of years that a company survived following an initial offering. The sample includes 3,678 companies at the end of the first fiscal year, with this number being reduced to 3,523 by the end of the next year, eventually being reduced down to 1,539 when looking at 10 fiscal years after the IPO. It is also worth mentioning that the number of Pre-IPO observations is a significantly smaller number when compared to the IPO year. This is due to the COMPUSTAT database failing to provide certain company-specific information prior to their public offering.
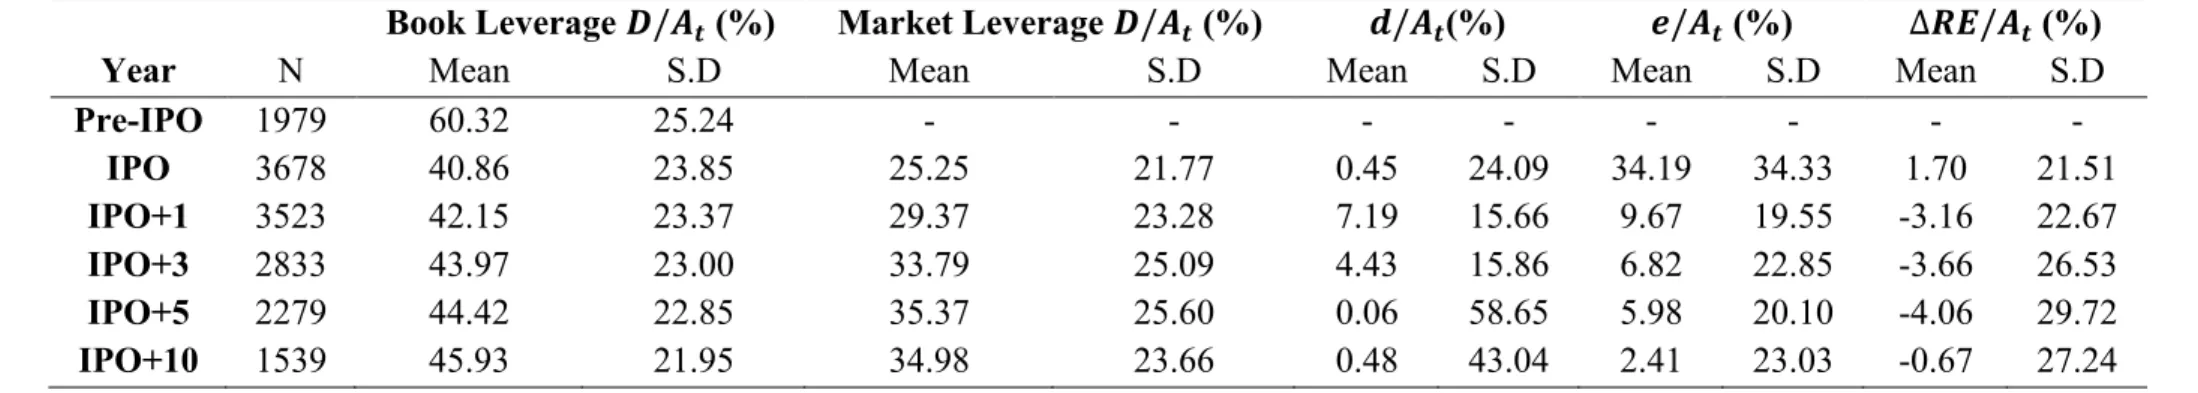
Our following table will present the summary statistics concerning the financial decisions taken within our sample. A thorough analysis of the table allows us to draw some conclusions on these decisions. Table 1 demonstrates that a firm’s book leverage experiences a considerable decrease when undergoing an IPO, and while the value of this ratio increases in
Table 1: Summary statistics
This table contains the means and standard deviation values. Book leverage was done dividing book debt by assets and is restricted between 0 and 1. Market leverage is book debt divided by total assets minus book equity plus market equity. New debt issues was calculated by dividing residual change in assets to assets. Net equity issues is book equity minus change in retained earnings all divided by assets. Newly retained earnings is defined as change in retained earnings split by assets. All the variables are expressed in percentage terms. The time is expressed in IPO years.
Book Leverage 𝑫/𝑨𝒕 (%) Market Leverage 𝑫/𝑨𝒕 (%) 𝒅/𝑨𝒕(%) 𝒆/𝑨𝒕 (%) ∆𝑹𝑬/𝑨𝒕 (%)
Year N Mean S.D Mean S.D Mean S.D Mean S.D Mean S.D
Pre-IPO 1979 60.32 25.24 - - - - IPO 3678 40.86 23.85 25.25 21.77 0.45 24.09 34.19 34.33 1.70 21.51 IPO+1 3523 42.15 23.37 29.37 23.28 7.19 15.66 9.67 19.55 -3.16 22.67 IPO+3 2833 43.97 23.00 33.79 25.09 4.43 15.86 6.82 22.85 -3.66 26.53 IPO+5 2279 44.42 22.85 35.37 25.60 0.06 58.65 5.98 20.10 -4.06 29.72 IPO+10 1539 45.93 21.95 34.98 23.66 0.48 43.04 2.41 23.03 -0.67 27.24
the next 10 years, the market ratio values increased even further. The last 3 financial decision indicators also suggest that a major increase switch occurs in debt financing during a company’s transition into its 2nd IPO year. Taking into consideration that the change in assets is composed
by the sum of net equity with debt issues, plus retained earnings, the composition change of a company in the 2nd year is determined by roughly 35% and 50% in debt and equity issuing
3.2 Regressions
3.2.1 Annual changes in leverage
This section will endeavor to begin a preliminary analysis on both leverage and the market-to-book ratio, before proceeding to provide deeper insights into market equity timing which will be applied throughout our work. Our analysis will begin by assessing leverage changes within a firm and their relationship to market-to-book net effects to distill their specific impact, therefore allowing us to test some of the hypotheses already put forward within the existing literature.
High market-to-book values tend to emerge from firms which present high growth rates, but which may also be issuing as much debt as equity. For our research purposes we will undertake to deconstruct the change in leverage to identify the origins of any existing effect and to further assess if it emerges from net equity issues, as suggested by previous studies into equity market timing. We will first report the net effect of market-to-book ratios on annual leverage changes, before deconstructing the leverage change itself.
The market-to-book ratio serves as the primary focus of these regressions, but in order to create a benchmark set of control variables, a set of three control variables were included, drawing on the work of Rajan and Zingales (1995). Their paper proposes that asset tangibility, profitability and firm size are corelated to leverage in several developed countries. The market-to-book ratio is related to both mispricing and investment opportunities, calculated as the book value of assets minus equity plus market equity, all divided by the book value of assets. Companies returning a ratio value above 10 are considered outliers and subsequently removed from our sample. Asset tangibility is normally associated with high values of leverage since tangible assets are typically used as collateral. This particular variable is defined as the net plant, property, and equipment (PPE), divided by the book value of assets.
Profitability on the other hand, if related to internal funds and linked to Myers and Majluf (1984)’s pecking order theory, which states that managers prefer internal funds to external, could subsequently be related to low levels of leverage. Another hypothesis comes from Jensen (1986), who states that profitable firms have more cash flow problems, while effective governance might require higher levels of leverage. Profitability is defined as EBITDA divided by the book value of assets.
Lastly, firm size is measured as the log of net sales, which we further complement with the assumption that if larger firms are less likely to enter financial distress, then size may
increase leverage. To test these different variables effects on the annual change in book leverage, the following regression was performed:
(𝐷 𝐴)𝑡 − (𝐷 𝐴)𝑡−1 = 𝑎 + 𝑏 (𝑀 𝐵)𝑡−1 + 𝑐 (𝑃𝑃𝐸 𝐴 )𝑡−1 + 𝑑 (𝐸𝐵𝐼𝑇𝐷𝐴 𝐴 )𝑡−1 + 𝑒 𝑙𝑜𝑔(𝑆)𝑡−1+ 𝑓 ( 𝐷 𝐴)𝑡−1 + 𝑢𝑡 (1)
The lagged leverage variable was included due to leverage being restricted to values between 0 and 1. When leverage is close to one of these values the ratio can only go one way, regardless of the values of our other variables. Controlling this variable allows us to ensure that the regression does not dilute other variable specific effects based solely on the effect of the leverage level.8 In order to analyze where the annual changes in leverage came from, leverage
needs to be deconstructed into equity issues, newly retained earnings, and alterations in leverage, provided by asset growth through equity, debt issues, and retained earnings. An illustration of this deconstruction is presented below:
(𝐷 𝐴)𝑡− ( 𝐷 𝐴)𝑡−1= − [( 𝐸 𝐴)𝑡− ( 𝐸 𝐴)𝑡−1] = − ( 𝑒 𝐴)𝑡− ( ∆𝑅𝐸 𝐴 )𝑡− [𝐸𝑡−1( 1 𝐴𝑡− 1 𝐴𝑡−1)] (2) − (𝑒 𝐴)𝑡 = 𝑎 + 𝑏 (𝑀 𝐵)𝑡−1+ 𝑐 ( 𝑃𝑃𝐸 𝐴 )𝑡−1+ 𝑑 ( 𝐸𝐵𝐼𝑇𝐷𝐴 𝐴 )𝑡−1+ 𝑒 𝑙𝑜𝑔(𝑆)𝑡−1+ 𝑓 ( 𝐷 𝐴)𝑡−1+ 𝑢𝑡 (3) − (∆𝑅𝐸 𝐴 )𝑡 = 𝑎 + 𝑏 (𝑀 𝐵)𝑡−1 + 𝑐 (𝑃𝑃𝐸 𝐴 )𝑡−1 + 𝑑 (𝐸𝐵𝐼𝑇𝐷𝐴 𝐴 )𝑡−1 + 𝑒 𝑙𝑜𝑔(𝑆)𝑡−1+ 𝑓 ( 𝐷 𝐴)𝑡−1 + 𝑢𝑡 (4) − [𝐸𝑡−1( 1 𝐴𝑡 − 1 𝐴𝑡−1 )] = = 𝑎 + 𝑏 (𝑀 𝐵)𝑡−1+ 𝑐 ( 𝑃𝑃𝐸 𝐴 )𝑡−1+ 𝑑 ( 𝐸𝐵𝐼𝑇𝐷𝐴 𝐴 )𝑡−1+ 𝑒 𝑙𝑜𝑔(𝑆)𝑡−1+ 𝑓 ( 𝐷 𝐴)𝑡−1 + 𝑢𝑡 (5)
8 Tests without the lagged variable were performed, with the results demonstrating that no endogeneity
In the end these different regressions will ultimately articulate where the changes in leverage come from and if those changes are derived from equity issuing as suggested by the market equity timing theory.
3.2.2 Factors of Leverage
After analyzing the short-term effects of the market-to-book ratio on leverage, this section will begin assessing the persistence of these effects in order to understand the cross-sectional impact of leverage. Managers may use equity market timing as an opportunity then rebalance quickly, thus making the effect more noticeable in the short term, while effectively cancelling it out in the long term. In the case of managers that do not rebalance to a specific target leverage however, this theory will explain why the ratios and persistence effects differ.
In order to analyze these persistence effects, new regressions will be performed by utilizing the control variables we derived from Rajan and Zingales (1995). A new variable will be created within this section however, the external finance weighted average of market-to-book, in order to assess relevant historical variations in market valuations. The market-to-book external finance weighted average will be outlined as:
(𝑀 𝐵)𝑒𝑓𝑤𝑎,𝑡−1= ∑ 𝑒𝑠 + 𝑑𝑠 ∑𝑡−1𝑟=0𝑒𝑟+ 𝑑𝑟 𝑡−1 𝑠=0 ∗ (𝑀 𝐵)𝑠 (6)
The summations begin at the IPO year, with e and d representing net equity and debt issues respectively, while being defined as previously stated.9
The external finance weighted average returns high values when a company that already possesses a high market-to-book ratio raises financing by external sources and returns low values when the reverse takes place. External finance represents opportunities to change levels of leverage, whether such opportunities are presented through debt or equity. 𝑀𝑡𝐵𝑒𝑓𝑤𝑎 ratio gives more weight to valuations that prevailed when such financing decisions were being made, measuring the lags while allowing us to reflect upon the most important lagged observations.
Some important restrictions regarding this ratio were set out. The minimum weight was set to zero, while the ratio value itself was required to remain below 10, with any outliers being
excluded. This first minimum weight restriction was applied to ensure the weighted average only increased during our set timeframe, and thus to verify that any weight increase is exclusively representative of times where the leverage was most expected to change. Therefore, a weight of zero will mean that this variable eliminates the market information for that specific year.
To test the univariate explanatory power of this weighted variable when compared to other factors, a set of different regressions was applied, relying upon the different IPO times in order to analyze their R-square value. These regressions are provided below:
(𝐷
𝐴)𝑡 = 𝑎 + 𝑏𝑋𝑡−1+ 𝑢𝑡 (7)
The 𝑋𝑡−1 variable represents the 4 different variables utilized by Rajan and Zingales
(1995) and which were already incorporated in our previous regressions. 𝑋𝑡−1 will also further represent 4 new variables applied by Fama and French (2000), related to capital structure factors. Two of these are related to dividends, one is related to depreciation, and the last one is related to R&D. Dividends to book equity is equal to common stock dividends divided by the book value of equity, and these will be used as a proxy for profitability. As a proxy for investment opportunities the ratios are dividends to market equity and research and development which is R&D expenditures to book value of assets. The depreciation expense, calculated by dividing depreciation by the book value of assets, will provide us with the ratio necessary for our final proxy for nondebt tax shields. To compare the explanatory power of these different variables one is required to calculate the weighted averages of their individual historical values.
After this explanatory power is assessed, multivariate regressions can be performed on our book and market leverage ratios, including on our weighted average market-to-book values:
(𝐷 𝐴)𝑡 = 𝑎 + 𝑏 ( 𝑀 𝐵)𝑒𝑓𝑤𝑎,𝑡−1+ 𝑐 ( 𝑀 𝐵)𝑡−1+ 𝑑 ( 𝑃𝑃𝐸 𝐴 )𝑡−1+ 𝑒 ( 𝐸𝐵𝐼𝑇𝐷𝐴 𝐴 )𝑡−1+ 𝑓 𝑙𝑜𝑔(𝑆)𝑡−1 + 𝑢𝑡 (8)
This new set of regressions allows us to perform the important process of inclusion of the normal lagged market-to-book ratio, ensuring that the weighted average will capture only effects derived from the residual past valuation, while the lagged values will capture current variations in the market-to-book ratio. The lagged ratio is more related to investment rather than perceived mispricing. Controlling for current investments enables past within-firm variation to improve the selection of what may have been perceived as market timing opportunities.
For testing if the coefficient of the external finance weighted average is sensitive to different control variables than the ones we relied upon earlier, another multivariate regression was performed using the control variables selected by Fama and French (2000). Some of these overlap with the ones we used in the previous multivariate regression. The different variables used were EBIT to assets, common dividends to book equity and market equity, depreciation to assets, R&D expenses scaled by assets, and firm size.10 All the variables were lagged as in
our previous models.
(𝐷 𝐴)𝑡 = 𝑎 + 𝑏 ( 𝑀 𝐵)𝑒𝑓𝑤𝑎,𝑡−1+ 𝑐 ( 𝑀 𝐵)𝑡−1+ 𝑑 ( 𝐸𝑇 𝐴 )𝑡−1+ 𝑒 ( 𝐷𝑖𝑣 𝐵𝐸)𝑡−1+ 𝑓 ( 𝐷𝑖𝑣 𝑀𝐸)𝑡−1 + +𝑔 (𝐷𝑝 𝐴 )𝑡−1 + ℎ (𝑅𝐷 𝐴 )𝑡−1 + 𝑖 𝑅𝐷𝐷𝑡−1+ 𝑗 𝑙𝑜𝑔(𝐴)𝑡−1+ 𝑢𝑡 (9) 3.2.3 Persistence
This section will seek to provide even deeper insight. Our previous two sections illustrated the relationship between the market-to-book ratio and leverage in the short-term, along with assessing whether historical market valuations are associated with leverage. If there indeed exists a short- and long-term effect visible within the historical data, then the market-to-book ratio can subsequently declared to be persistent. To conclude our empirical study, the magnitude of this persistence will be measured on this last step.
We will primarily rely upon a regression analysis on the cumulative changes in leverage beginning in the pre-IPO year, using the Rajan and Zingales control variables. This regression will be performed as follows:
(𝐷 𝐴)𝑡 − (𝐷 𝐴)𝑝𝑟𝑒−𝐼𝑃𝑂 = = 𝑎 + 𝑏 (𝑀 𝐵)𝑒𝑓𝑤𝑎,𝑡−1+ 𝑐 ( 𝑀 𝐵)𝑡−1+ 𝑑 ( 𝑃𝑃𝐸 𝐴 )𝑡−1+ 𝑒 ( 𝐸𝐵𝐼𝑇𝐷𝐴 𝐴 )𝑡−1 + 𝑓 𝑙𝑜𝑔(𝑆)𝑡−1+ 𝑔 (𝐷 𝐴)𝑝𝑟𝑒−𝐼𝑃𝑂 + 𝑢𝑡 (10)
Since an IPO represents a critical event which is linked to the market valuation of a company, it is important to measure the changes in the dominant leverage before an IPO takes place, meaning that the pre-IPO leverage will be included within our dependent variable.
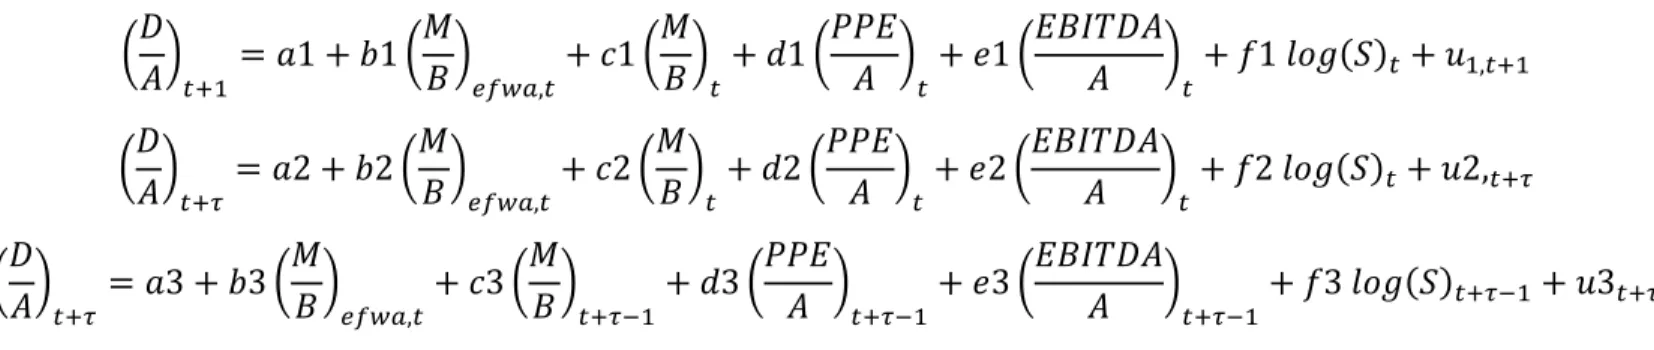
The last set of regressions performed in our study aim to demonstrate the direct persistence effect of past valuations on the current capital structure of a company. This set consists of 3 different regressions as presented below:
(𝐷 𝐴)𝑡+1= 𝑎1 + 𝑏1 ( 𝑀 𝐵)𝑒𝑓𝑤𝑎,𝑡+ 𝑐1 ( 𝑀 𝐵)𝑡+ 𝑑1 ( 𝑃𝑃𝐸 𝐴 )𝑡+ 𝑒1 ( 𝐸𝐵𝐼𝑇𝐷𝐴 𝐴 )𝑡+ 𝑓1 𝑙𝑜𝑔(𝑆)𝑡 + 𝑢1,𝑡+1 (11) (𝐷 𝐴)𝑡+𝜏 = 𝑎2 + 𝑏2 ( 𝑀 𝐵)𝑒𝑓𝑤𝑎,𝑡+ 𝑐2 ( 𝑀 𝐵)𝑡+ 𝑑2 ( 𝑃𝑃𝐸 𝐴 )𝑡+ 𝑒2 ( 𝐸𝐵𝐼𝑇𝐷𝐴 𝐴 )𝑡+ 𝑓2 𝑙𝑜𝑔(𝑆)𝑡 + 𝑢2,𝑡+𝜏 (12) (𝐷 𝐴)𝑡+𝜏= 𝑎 + 𝑏3 ( 𝑀 𝐵)𝑒𝑓𝑤𝑎,𝑡+ 𝑐3 ( 𝑀 𝐵)𝑡+𝜏−1+ 𝑑3 ( 𝑃𝑃𝐸 𝐴 )𝑡+𝜏−1+ 𝑒3 ( 𝐸𝐵𝐼𝑇𝐷𝐴 𝐴 )𝑡+𝜏−1 + 𝑓3 𝑙𝑜𝑔(𝑆)𝑡+𝜏−1+ 𝑢3𝑡+𝜏 (13)
The first regressions presented in this set differ from our previous regressions in that they measure the effect of the average value of the weighted ratio of the capital structure presented in t+1. While similar in format to our previous regressions, its application is oriented differently. Our second regression here will still controlling time through t, but it will further consider a new capital structure time through t+𝜏. This last regression has a significant change when compared to our previous ones, with the 𝑀/𝐵𝑒𝑓𝑤𝑎 measuring its effects through time t, while the regression itself aims to returns its results through 𝑡 + 𝜏 − 1. 𝜏 represents a company’s survived years. This set of regressions will get a further deepest explanation in the results part.
4. Results
Given all our previous regressions, this section will endeavor to explain within the context of market equity timing, those same OLS analyses. These regressions are noted in IPO years on our IPO sample (e.g., if the time in study is IPO+1 year, the lagged variables represent the IPO year). In our results section the order of our regressions results will follow the regression segment.
The annual changes in leverage will be the primary subject of our analysis. This first set of regressions is divided into 4 panels, with the first one analyzing which factors change annual leverage levels, while the next 3 will endeavor to explain where that changes comes from.
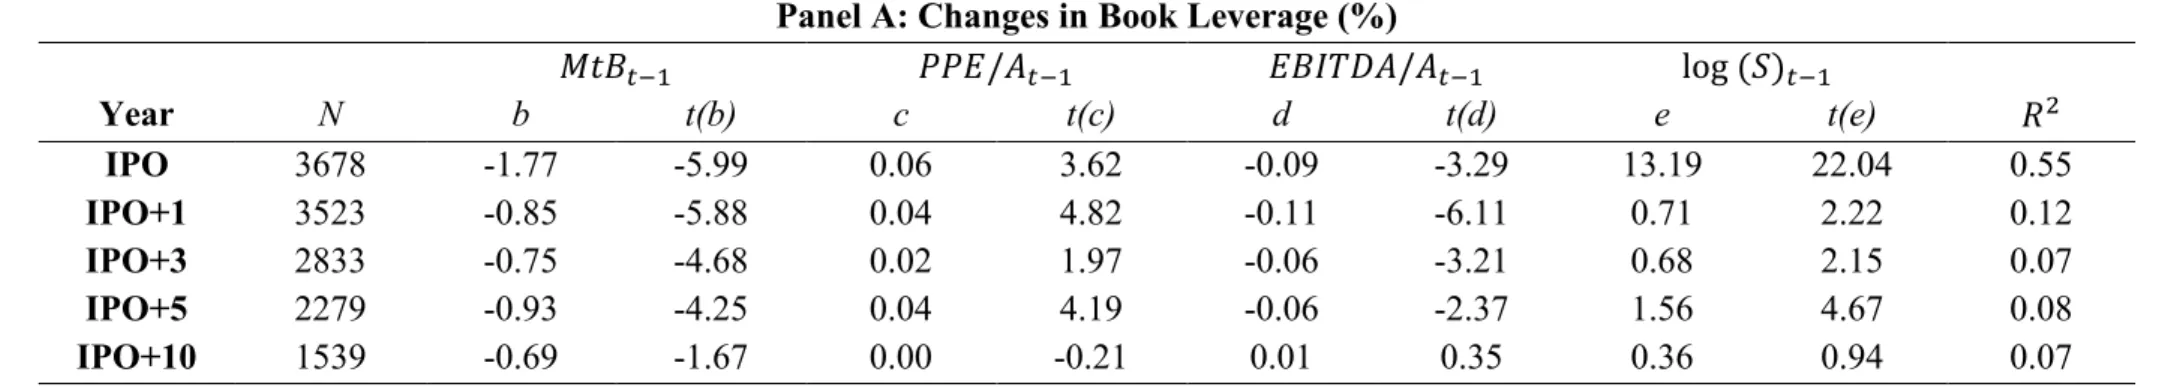
Table 2, panel A demonstrates that leverage and the market-to-book ratio possess negative correlation, with high values of market-to-book ratio typically leading to lower levels of leverage. By multiplying the coefficient and the sample standard deviation given by the independent variable, the total change can be measured. In our IPO+3 year this total change amounted to -1.2%, meaning that at the time of IPO+3, one unit increase in the market-to-book ratio will tend to result in a leverage decrease of almost 1.20%. Such results are consistent with the theory that managers tend to issue equity when the prices are high, but it does not properly explain where such change originates from. Regarding our other columns, asset tangibility and firm size tends to increase the leverage ratio by 0.15% and 2.2% respectively within the same year, while profitability typically reduces it by 1.3%. These results are consistent with previous studies performed by Baker, Wurgler or La Porta. 11
The next panel results conclusively demonstrate that changes in leverage through market-to-book ratio originates mostly from net equity issues. Furthermore, and concurring with previous studies by Marsh (1982) and other financial authors, panel B seems to suggest that the market-to-book ratio is highly significant to net equity issues. Panel C further shows that newly retained earnings are weakly related to the market-to-book ratio, thus rejecting the hypotheses that leverage is affected by market-to-book based on newly retained earnings. Panel D shows that growth in assets is positively related to market-to-book, thus increasing leverage levels through a positive effect. 12 All the distinct panels from B to D reflect the total effect of
the market-to-book ratio, with the sum of all of these resulting in our panel A.
11 Sample standard deviations will be presented in the appendix
12 The effect of firm size is positive; however, this indicator does not change leverage one on one in the
Table 2: Determinants of changes in leverage 13 (𝐷 𝐴)𝑡 − (𝐷 𝐴)𝑡−1 = − (𝑒 𝐴)𝑡− ( ∆𝑅𝐸 𝐴 )𝑡 − [𝐸𝑡−1( 1 𝐴𝑡 − 1 𝐴𝑡−1 )] = 𝑎 + 𝑏 (𝑀 𝐵)𝑡−1 + 𝑐 (𝑃𝑃𝐸 𝐴 )𝑡−1 + 𝑑 (𝐸𝐵𝐼𝑇𝐷𝐴 𝐴 )𝑡−1 + 𝑒 𝑙𝑜𝑔(𝑆)𝑡−1+ 𝑓 ( 𝐷 𝐴)𝑡−1 + 𝑢𝑡
Ordinary least squared regressions (already identified on the paper as 1, 3, 4 and 5) of changes in the book leverage ratio. The independent variables are market-to-book ratio, asset tangibility, profitability, firm size and lastly lagged leverage. The coefficients of a and f are not reported. Book leverage is book debt divided by assets. Market-to-book ratio is assets plus market equity minus book equity everything divided by book assets, this variable is lagged at all times, except in the IPO year, on that time is measure at time t. Firm-year observations with market-to-book ratio higher than 10 were dropped. Asset Tangibility equals PPE (net property, plant and equipment) divided by assets. Profitability is EBITDA divided by assets. Firm size is composed by the log of net sales. All independent variables are expressed in percentage terms except for market-to-book and firm size. Panel A presents the changes in leverage. Panel B presents net equity issues as dependent variable. Panel C presents newly retained earnings as dependent variable. Panel D presents growth in assets growth coming from equity. The regressions are robust and t-stat values are presented by the columns t().
Panel A: Changes in Book Leverage (%)
𝑀𝑡𝐵𝑡−1 𝑃𝑃𝐸/𝐴𝑡−1 𝐸𝐵𝐼𝑇𝐷𝐴/𝐴𝑡−1 log (𝑆)𝑡−1 Year N b t(b) c t(c) d t(d) e t(e) 𝑅2 IPO 3678 -1.77 -5.99 0.06 3.62 -0.09 -3.29 13.19 22.04 0.55 IPO+1 3523 -0.85 -5.88 0.04 4.82 -0.11 -6.11 0.71 2.22 0.12 IPO+3 2833 -0.75 -4.68 0.02 1.97 -0.06 -3.21 0.68 2.15 0.07 IPO+5 2279 -0.93 -4.25 0.04 4.19 -0.06 -2.37 1.56 4.67 0.08 IPO+10 1539 -0.69 -1.67 0.00 -0.21 0.01 0.35 0.36 0.94 0.07
Panel B: Changes in Book Leverage Due to Equity Issues (%) 𝑀𝑡𝐵𝑡−1 𝑃𝑃𝐸/𝐴𝑡−1 𝐸𝐵𝐼𝑇𝐷𝐴/𝐴𝑡−1 log (𝑆)𝑡−1 Year N b t(b) c t(c) d t(d) e t(e) 𝑅2 IPO 3678 -3.78 8.16 0.09 -3.70 0.20 -4.09 20.63 -24.03 0.37 IPO+1 3523 -2.69 12.82 0.00 0.39 0.33 -12.25 3.93 -10.09 0.27 IPO+3 2833 -3.96 12.00 -0.04 2.97 0.35 -5.17 1.70 -1.48 0.16 IPO+5 2279 -3.82 10.79 -0.01 0.73 0.35 -8.24 1.72 -3.63 0.21 IPO+10 1539 -3.82 5.52 -0.03 1.22 0.48 -3.74 0.35 -0.39 0.11
Panel C: Changes in Book Leverage Due to Newly Retained Earnings (%)
𝑀𝑡𝐵𝑡−1 𝑃𝑃𝐸/𝐴𝑡−1 𝐸𝐵𝐼𝑇𝐷𝐴/𝐴𝑡−1 log (𝑆)𝑡−1 Year N b t(b) c t(c) d t(d) e t(e) 𝑅2 IPO 3678 0.65 -1.89 0.01 -0.69 -0.31 6.63 -0.24 0.40 0.11 IPO+1 3523 -0.56 2.82 -0.02 1.46 -0.71 15.26 -2.07 4.35 0.42 IPO+3 2833 -0.23 0.69 0.00 0.33 -0.67 8.09 -0.25 0.18 0.24 IPO+5 2279 -0.61 2.29 -0.02 0.89 -0.63 12.53 -0.49 0.60 0.14 IPO+10 1539 0.26 -0.49 0.06 -1.42 -0.69 5.99 0.23 -0.23 0.13
Panel D: Changes in Book Leverage Due to Changes in Assets (%)
𝑀𝑡𝐵𝑡−1 𝑃𝑃𝐸/𝐴𝑡−1 𝐸𝐵𝐼𝑇𝐷𝐴/𝐴𝑡−1 log (𝑆)𝑡−1 Year N b t(b) c t(c) d t(d) e t(e) 𝑅2 IPO 3678 1.36 -6.00 -0.04 2.87 0.02 -0.90 -7.19 15.22 0.40 IPO+1 3523 2.40 -12.07 0.07 -5.71 0.27 -9.21 -1.16 2.68 0.15 IPO+3 2833 3.45 -13.60 0.06 -4.45 0.26 -6.40 -0.77 1.49 0.14 IPO+5 2279 3.49 -11.71 0.07 -2.85 0.22 -5.95 0.33 -0.43 0.07 IPO+10 1539 2.86 -6.35 -0.03 0.59 0.22 -4.08 -0.22 0.25 0.04
Our final 3 columns comprise asset tangibility, profitability, and size. In a side analysis, the profitability column suggests that changes in leverage through profitability typically originate from retained earnings. Previous statements purport that profitable firms will tend to issue less equity, but this new result also suggests that this effect is instead balanced from the higher return earnings, reducing leverage. Another interesting pattern arises from our firm size variable, which returns large values for our IPO years, revealing that this variable seems to play an important role during these critical starting periods.
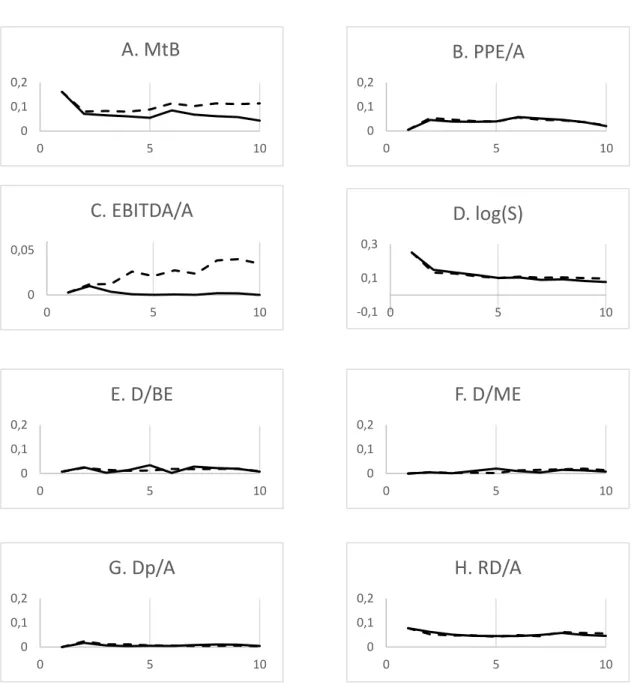
The effect of the market-to-book ratio on leverage in the short term is confirmed, allowing us to proceed to the analysis on long-term effects. This part required the creation of our external financing weighted average ratio as previously stated. Different plots tracing out the cross section of our R-squared values with different independent variables had to be created in order to examine the power of this weighted variable. In figure 1, the dashed lines in these plots represent the external financing weighted average ratio or efwa ratio, while the solid one represents the lagged one-year indicator.
Our average weighted ratio appears to hold more univariate explanatory power than the unweighted ratio. Panel A further suggests that market-to-book starts with an explanation power of roughly 20% of the capital structure and a with negative coefficient in both regressions as expected. 14 While the weighted average explanation suffered a slight decline at the start, this
one held steady throughout the firm’s lifetime. This did not take place with the once-lagged market-to-book, which experienced decreased explanatory power as time progressed. As firms age, historical information becomes more relevant in explaining the capital structure, a conclusion supported by the increasing gap present between the solid and dashed line in our plots as time progresses. Both versions of asset tangibility in panel B on the other hand, presented low levels of explanatory power along with positive coefficients.
Profitability is presented in Panel C, although it has low explanatory power, this variable returned in these visual analyses the most peculiar results along with our market-to-book ratio, being the only variables whereby historical valuations had a significant increase on explanatory powers. Such results make sense in the context of our profitability variable only if the firm keeps the retained earnings instead of paying them out. Our weighted average variable includes not only the presented profitability, they further include the effect of previous ones which
14 All the coefficients mentioned on this part of the paper will be presented in the next regression tables:
Figure 1: Explanatory power (R-Square) of capital structure factors as firms age
(𝐷 𝐴)𝑡
= 𝑎 + 𝑏𝑋𝑡−1+ 𝑢𝑡
Ordinary least squares regressions of book leverage regress with 8 different determinants of capital represented by the 8 different panels. Book leverage is debt divided by assets. From the 8 different independent variables, they were defined in 2 different ways, one considers the weighted average of past external financing and the other is the simple lagged one-year values, the variables efwa is presented by the dashed line and the normal lagged by the solid line. External financing is the sum of net and debt issues, when this sum is negative the weight is set to 0. Market-to-book ratio is assets plus market equity minus book equity everything divided by book assets, firm-year observations with market-to-book ratio higher than 10 were dropped. Asset Tangibility equals PPE (net property, plant and equipment) divided by assets. Profitability is EBITDA divided by assets. Firm size is composed by the log of net sales. Scaled by book and market equity are the common dividends. Depreciation expense is divided by assets. Research and Development is split by assets.
0 0,1 0,2 0 5 10
A. MtB
0 0,1 0,2 0 5 10B. PPE/A
0 0,05 0 5 10C. EBITDA/A
-0,1 0,1 0,3 0 5 10D. log(S)
0 0,1 0,2 0 5 10E. D/BE
0 0,1 0,2 0 5 10F. D/ME
0 0,1 0,2 0 5 10G. Dp/A
0 0,1 0,2 0 5 10H. RD/A
directly affect retained earnings values. These effects of past profitability have already been widely discussed within the literature, notably within Wessels and Titman (1988) paper titled “The determinants of capital structure”. Our size variable demonstrates some ability to explain younger firms, but that explanation power decreases a lot with time, with the normal and weighted ratios showing only marginal differences in this variable, with positive coefficients in both. Both dividend ratios along with depreciation (Panels E, F and G) appear to possess very little explanatory power, with none of them returning an R-square larger than 3.5%. R&D expenses returned a negative coefficient, and while it explains almost 10% of the capital structure, our weighted average scheme does not seem to improve this variable’s explanatory power. Figure 1 simply suggests that capital structure results from several factors when a firm performs an IPO. As companies get older the cross section of leverage is further clarified by past choices, and while this historic data does not affect all our control variables, it does add value to the market-to-book and profitability variables.
After assessing the explanatory power of all our control variables, both weighted and unweighted ratios, our next step is to check if the effect of the market-to-book ratio is notable over the long term.
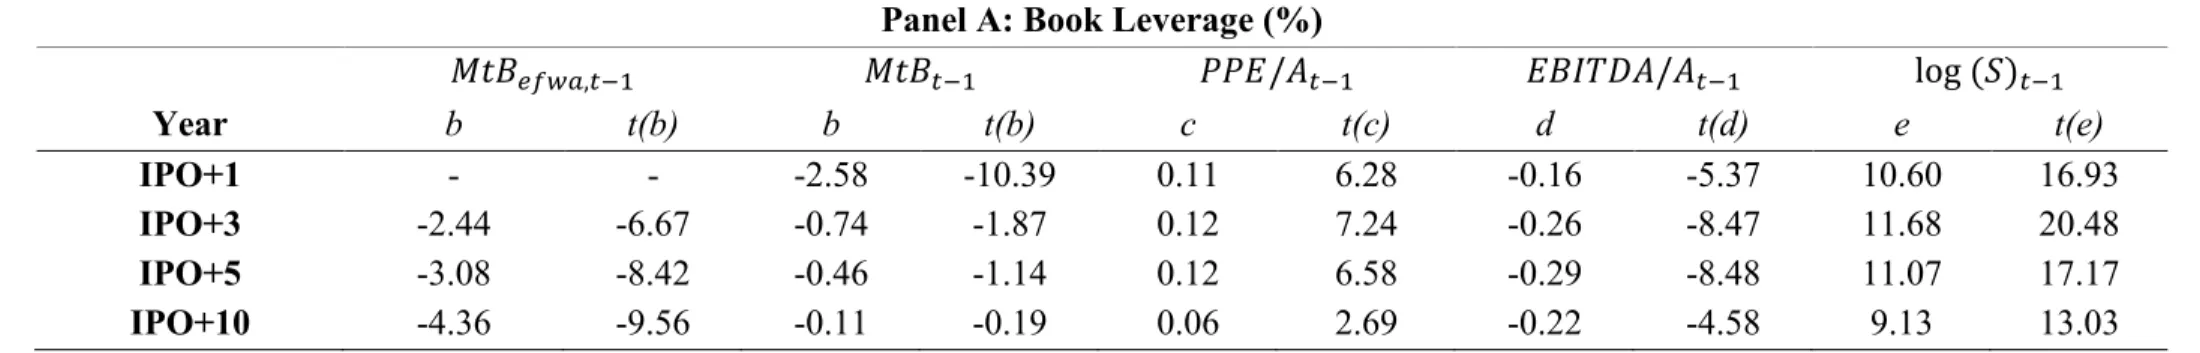
Table 3 demonstrates that 𝑀/𝐵𝑒𝑓𝑤𝑎 is both more consistent and stronger than the once lagged market-to-book ratio, with this difference being even more visible in the book leverage, represented in panel A. The normal lagged market-to-book ratio has little explanatory power for younger companies, losing this power almost entirely as they age, while the 𝑀/𝐵𝑒𝑓𝑤𝑎 ratio demonstrates an almost opposite behavior, the signal getting even stronger and with larger negative coefficients over time. Furthermore, market leverage has a mechanical association with the market-to-book ratio, which can explain its larger values in our Panel B, particularly when compared to panel A.
The 𝑀/𝐵𝑒𝑓𝑤𝑎 ratio is our most important economic variable. In our IPO+3 year row, a single standard increase in this indicator implies a decrease in book leverage of around 9%, with the same decrease taking place in market leverage. The biggest increase originates from our size variable, whereby a one unit increase in standard deviation is associated with an increase of almost 6% in the book leverage, along with 3,6% in market leverage. Consistent with Figure 1, the effect of past valuations on the capital structure becomes clearer over time. Our IPO+10 row demonstrates that the effect of 𝑀/𝐵𝑒𝑓𝑤𝑎 is even more pronounced than in previous years, with one standard deviation increase leading to a decrease of nearly 20% in market leverage, along with nearly 15% in book leverage. After our average weighted ratio
Table 3: Factors of leverage (𝐷 𝐴)𝑡 = 𝑎 + 𝑏 (𝑀 𝐵)𝑒𝑓𝑤𝑎,𝑡−1 + 𝑐 (𝑀 𝐵)𝑡−1 + 𝑑 (𝑃𝑃𝐸 𝐴 )𝑡−1 + 𝑒 (𝐸𝐵𝐼𝑇𝐷𝐴 𝐴 )𝑡−1 + 𝑓 𝑙𝑜𝑔(𝑆)𝑡−1+ 𝑢𝑡
Ordinary least squared regressions (identified on the paper as 8) of changes in the book and market leverage ratio, the independent variables are market-to-book ratios, asset tangibility, profitability and firm size. The coefficients of a are not reported. Book leverage is book debt divided by assets. Market leverage as book debt to assets plus market equity minus book equity. Market-to-book ratio is defined in 2 different methods. The first one is the external finance weighted average from t-1. The external finance of net debt and equity issues distribute the weights. When the external finance is negative the weight equals 0. The other t-1 market-to-book is assets plus market equity minus book equity everything divided by assets lagged for all years. Asset Tangibility equals PPE (net property, plant and equipment) divided by assets. Profitability is EBITDA divided by assets. Firm size is composed by the log of net sales. Asset tangibility and profitability are expressed in percentage terms. Panel A shows the results for book leverage. Panel B shows the results for the market leverage dependent. The regressions are robust and t-stat values are presented by the columns t().
Panel A: Book Leverage (%)
𝑀𝑡𝐵𝑒𝑓𝑤𝑎,𝑡−1 𝑀𝑡𝐵𝑡−1 𝑃𝑃𝐸/𝐴𝑡−1 𝐸𝐵𝐼𝑇𝐷𝐴/𝐴𝑡−1 log (𝑆)𝑡−1 Year b t(b) b t(b) c t(c) d t(d) e t(e) IPO+1 - - -2.58 -10.39 0.11 6.28 -0.16 -5.37 10.60 16.93 IPO+3 -2.44 -6.67 -0.74 -1.87 0.12 7.24 -0.26 -8.47 11.68 20.48 IPO+5 -3.08 -8.42 -0.46 -1.14 0.12 6.58 -0.29 -8.48 11.07 17.17 IPO+10 -4.36 -9.56 -0.11 -0.19 0.06 2.69 -0.22 -4.58 9.13 13.03
Panel B: Market Leverage (%) 𝑀𝑡𝐵𝑒𝑓𝑤𝑎,𝑡−1 𝑀𝑡𝐵𝑡−1 𝑃𝑃𝐸/𝐴𝑡−1 𝐸𝐵𝐼𝑇𝐷𝐴/𝐴𝑡−1 log (𝑆)𝑡−1 Year b t(b) b t(b) c t(c) d t(d) e t(e) IPO+1 - - -5.96 -27.68 0.15 9.01 -0.12 -5.44 7.22 13.62 IPO+3 -2.72 -7.6 -5.90 -14.75 0.15 8.92 -0.14 -6.50 7.36 13.28 IPO+5 -6.28 -9.32 -5.95 -12.54 0.18 9.08 -0.17 -5.72 6.16 9.75 IPO+10 -10.38 -10.72 -6.99 -12.05 0.11 4.85 -0.23 -4.62 5.21 7.52
variable, the largest effect on IPO+10 originates from profitability, with an approximately 11% decrease in both book and market leverage.15
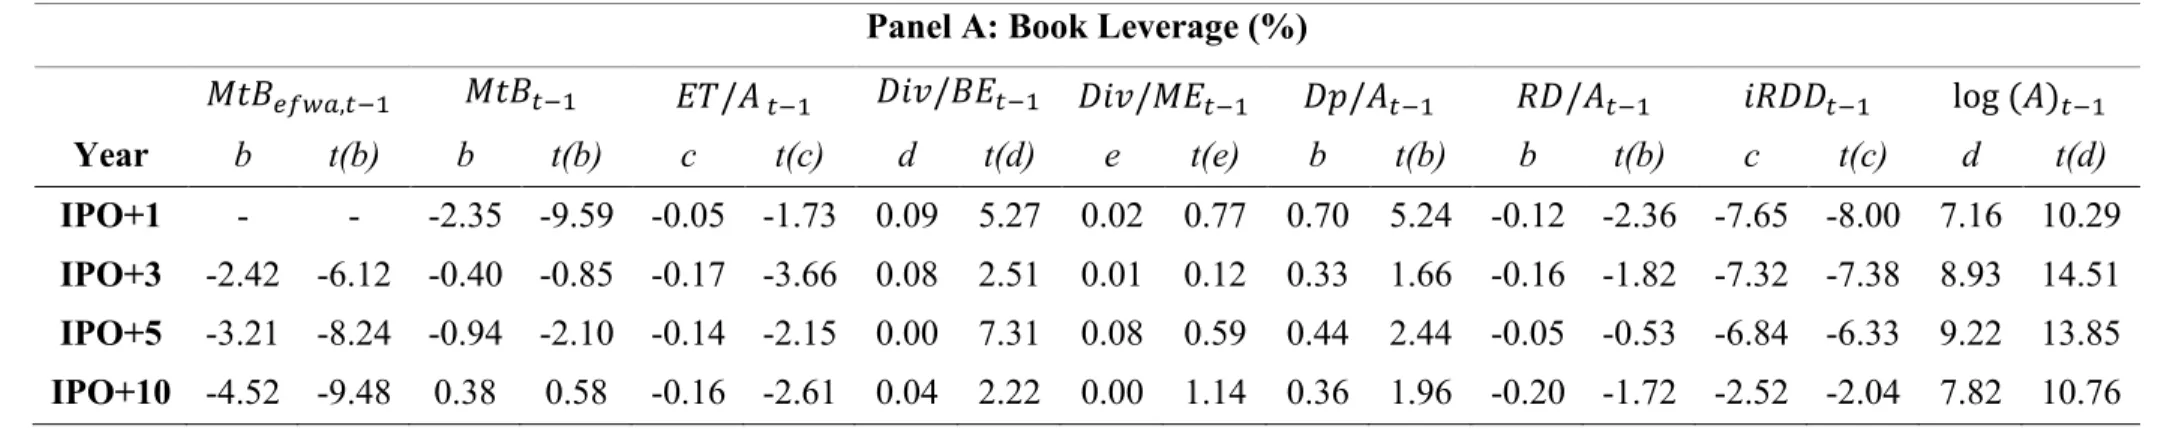
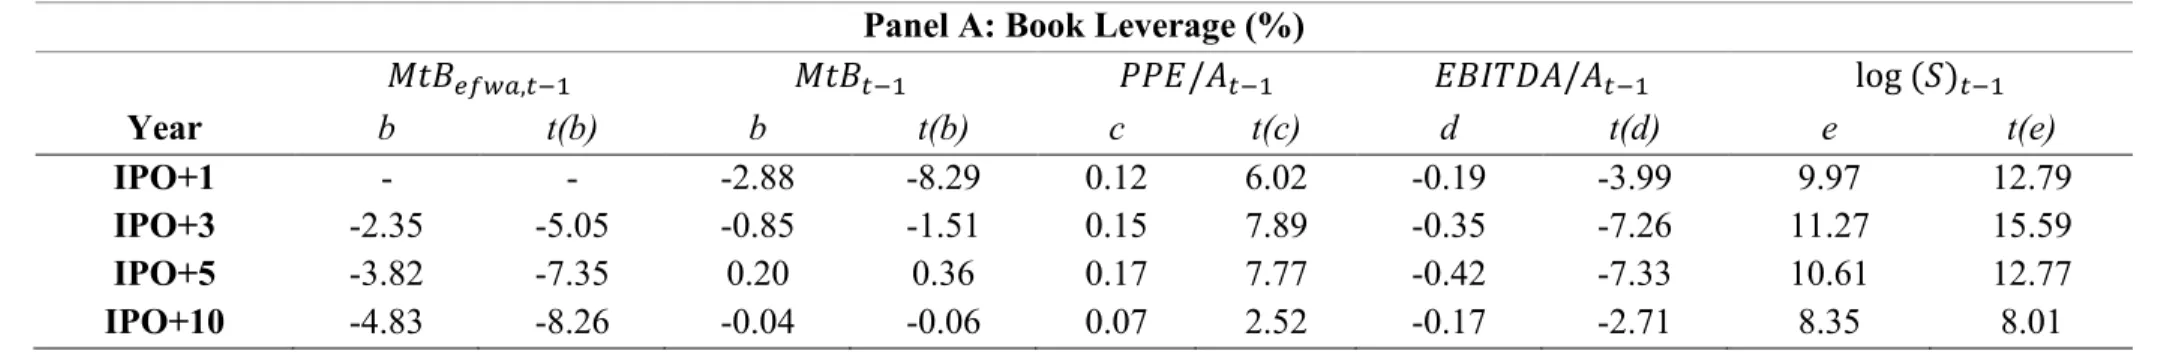
Table 4 demonstrates the regressions undertaken with the control variables suggested by Fama and French (2000). As previously stated, the aim in this case is to find out whether 𝑀/𝐵𝑒𝑓𝑤𝑎 is sensitive to changes in our control variables. The results of these regressions are
presented in the next table.
Similarly to previous results, the biggest change in our IPO+10 book and market leverage columns comes from the 𝑀/𝐵𝑒𝑓𝑤𝑎 ratio, while the second biggest change originates
from profitability. Table 4 also suggests that this ratio is not sensitive to changes in our control variables. Tables 3 and 4 further demonstrate that historical values possess a significant effect on leverage and in a different manner and magnitude to that previously reported within the literature. The last part of our results is related to persistence, with Table 5 representing the cumulative changes of leverage from the pre-IPO year.
The results of the coefficients and significance values in Table 5 do not differ much from Table 3. This concurrence serves to provide further data suggesting that valuations influence capital structure in a way that perseveres and accumulates over time. It further suggests that the average weighed ratio is unlikely to reflect an omitted variable that could possess an effect on initial leverage levels. Furthermore, and similarly to our previous results, a 1 unit increase in our 𝑀/𝐵𝑒𝑓𝑤𝑎 ratio leads to a decrease in the book and leverage ratio greater than that of any other independent variable.
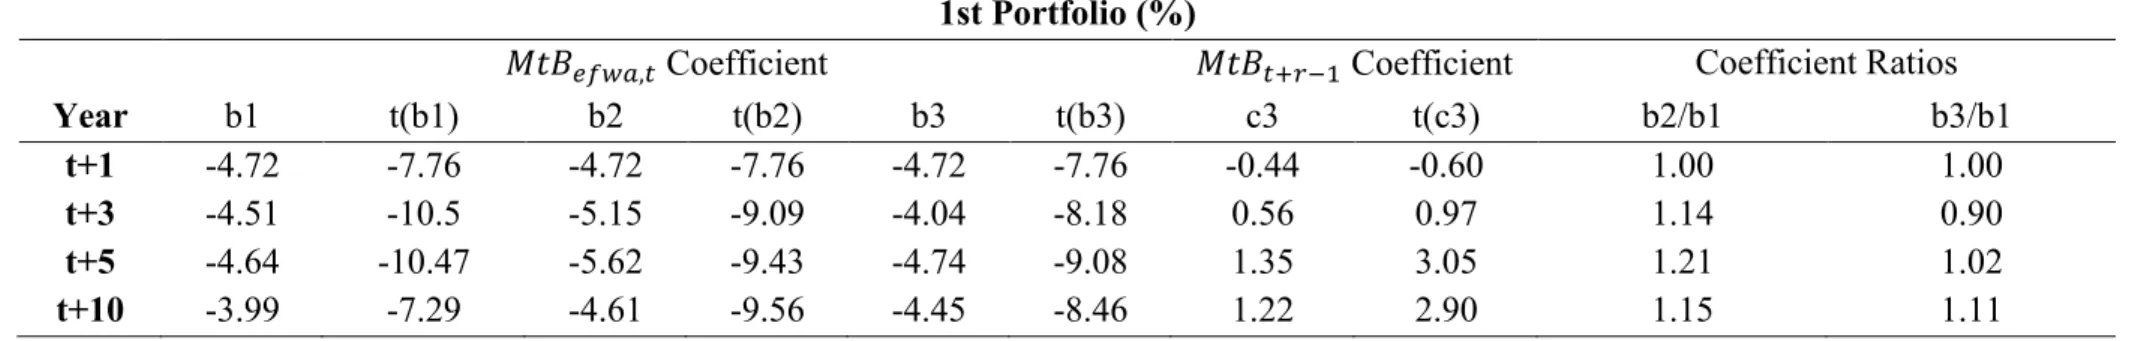
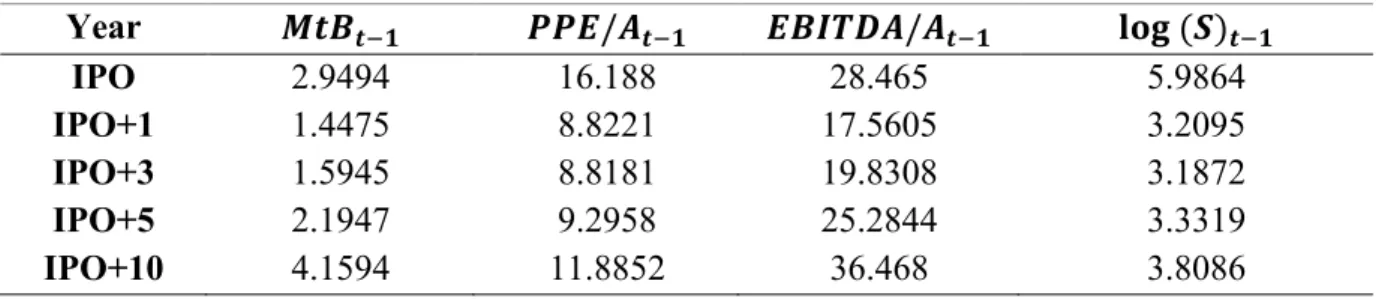
Table 6 tested the persistence of the market-to-book ratio in a different manner, applying Fama-Macbeth regressions for each year through a set of 3 regressions. These regressions contained only firms that survived 𝜏 years in order to ensure that coefficients represented a consistent sample of the same firms, resulting on a total of roughly 90 regressions alone, without the survival subsample regressions. These Fama-Macbeth regressions were performed with the aid of a Stata package which enables the application of different conditions on multiple regressions of this specific type.
Table 6 presents the different coefficients and t-stats gained from our performance of the Fama-Macbeth regressions, along with the 2 coefficient ratios. The ratios b2/b1 and b3/b1 will measure the effects in long-term oscillations in the market-to-book ratio.
Table 4: Factors of leverage – Different Control Variables (𝐷 𝐴)𝑡 = 𝑎 + 𝑏 ( 𝑀 𝐵)𝑒𝑓𝑤𝑎,𝑡−1+ 𝑐 ( 𝑀 𝐵)𝑡−1+ 𝑑 ( 𝐸𝑇 𝐴 )𝑡−1+ 𝑒 ( 𝐷𝑖𝑣 𝐵𝐸)𝑡−1+ 𝑓 ( 𝐷𝑖𝑣 𝑀𝐸)𝑡−1+ +𝑔 ( 𝐷𝑝 𝐴 )𝑡−1+ ℎ ( 𝑅𝐷 𝐴 )𝑡−1+ 𝑖 𝑅𝐷𝐷𝑡−1+ 𝑗 𝑙𝑜𝑔(𝐴)𝑡−1 + 𝑢𝑡
Ordinary least squared regression (already identified on the paper as 9) of changes in the book and market leverage ratio, the independent variables are variables suggested by Fama and French theirs 2000’s paper. Coefficients a is not reported. Book leverage is book debt divided by assets. Market leverage as book debt to assets plus market equity minus book equity. Market-to-book ratio is defined in 2 different methods. The first one is the external finance weighted average from t-1. The external finance of net debt and equity issues distribute the weights. When the external finance is negative the weight equals 0. The other t-1 market-to-book is assets plus market equity minus book equity everything divided by assets lagged for all years. Asset Tangibility equals PPE (net property, plant and equipment) divided by assets. Profitability is EBITDA divided by assets. Firm size is composed by the log of net sales. Common dividends is divided by book equity and market equity. Depreciation expense is divided by assets. R&D is divided by assets. RDD is a dummy variable that turns into 0 if a company did R&D expenses on the year in study. All independent variables are expressed in percentage terms except for both market-to-books, iRDD and firm size. EBIT is scaled to assets. Panel A shows the results for book leverage. Panel B shows the results for the market leverage dependent. The regressions are robust and t-stat values are presented by the columns t().
Panel A: Book Leverage (%)
𝑀𝑡𝐵𝑒𝑓𝑤𝑎,𝑡−1 𝑀𝑡𝐵𝑡−1 𝐸𝑇/𝐴 𝑡−1 𝐷𝑖𝑣/𝐵𝐸𝑡−1 𝐷𝑖𝑣/𝑀𝐸𝑡−1 𝐷𝑝/𝐴𝑡−1 𝑅𝐷/𝐴𝑡−1 𝑖𝑅𝐷𝐷𝑡−1 log (𝐴)𝑡−1 Year b t(b) b t(b) c t(c) d t(d) e t(e) b t(b) b t(b) c t(c) d t(d) IPO+1 - - -2.35 -9.59 -0.05 -1.73 0.09 5.27 0.02 0.77 0.70 5.24 -0.12 -2.36 -7.65 -8.00 7.16 10.29 IPO+3 -2.42 -6.12 -0.40 -0.85 -0.17 -3.66 0.08 2.51 0.01 0.12 0.33 1.66 -0.16 -1.82 -7.32 -7.38 8.93 14.51 IPO+5 -3.21 -8.24 -0.94 -2.10 -0.14 -2.15 0.00 7.31 0.08 0.59 0.44 2.44 -0.05 -0.53 -6.84 -6.33 9.22 13.85 IPO+10 -4.52 -9.48 0.38 0.58 -0.16 -2.61 0.04 2.22 0.00 1.14 0.36 1.96 -0.20 -1.72 -2.52 -2.04 7.82 10.76
Panel B: Market Leverage (%) 𝑀𝑡𝐵𝑒𝑓𝑤𝑎,𝑡−1 𝑀𝑡𝐵𝑡−1 𝐸𝑇/𝐴 𝑡−1 𝐷𝑖𝑣/𝐵𝐸𝑡−1 𝐷𝑖𝑣/𝑀𝐸𝑡−1 𝐷𝑝/𝐴𝑡−1 𝑅𝐷/𝐴𝑡−1 𝑖𝑅𝐷𝐷𝑡−1 log (𝐴)𝑡−1 Year b t(b) b t(b) c t(c) d t(d) e t(e) b t(b) b t(b) c t(c) d t(d) IPO+1 - - -5.59 -26.55 -0.09 -3.34 0.03 3.10 0.02 1.27 0.39 3.04 -0.26 -4.51 -6.51 -7.05 5.90 9.12 IPO+3 -2.70 -7.57 -5.08 -12.17 -0.16 -4.40 0.00 0.15 0.23 3.32 0.12 0.93 -0.30 -4.14 -6.67 -6.84 5.97 9.92 IPO+5 -6.03 -8.99 -5.37 -10.36 -0.16 -2.27 0.00 2.40 0.12 0.78 0.14 1.34 -0.27 -2.77 -6.89 -6.64 5.72 8.71 IPO+10 -10.13 -10.7 -6.24 -10.23 -0.27 -4.03 0.01 3.09 0.01 37.64 0.21 1.13 -0.31 -3.15 -4.40 -4.01 5.36 7.55
Table 5: Factors of leverage - Cumulative Changes from Pre-IPO (𝐷 𝐴)𝑡− ( 𝐷 𝐴)𝑝𝑟𝑒−𝐼𝑃𝑂 = 𝑎 + 𝑏 ( 𝑀 𝐵)𝑒𝑓𝑤𝑎,𝑡−1+ 𝑐 ( 𝑀 𝐵)𝑡−1+ 𝑑 ( 𝑃𝑃𝐸 𝐴 )𝑡−1+ 𝑒 ( 𝐸𝐵𝐼𝑇𝐷𝐴 𝐴 )𝑡−1+ 𝑓 𝑙𝑜𝑔(𝑆)𝑡−1+ 𝑔 ( 𝐷 𝐴)𝑝𝑟𝑒−𝐼𝑃𝑂+ 𝑢𝑡
Ordinary least squared regression (identified on the paper as 10) of cumulative changes in the book and market leverage ratio since pre-IPO, the independent variables are market-to-book ratios, asset tangibility, profitability and firm size. The coefficients of a and g are not reported. Book leverage is book debt divided by assets. Market leverage as book debt to assets plus market equity minus book equity. Market-to-book ratio is defined in 2 different methods. The first one is the external finance weighted average from t-1. The external finance of net debt and equity issues distribute the weights. When the external finance is negative the weight equals 0. The other t-1 market-to-book is assets plus market equity minus book equity everything divided by assets lagged for all years. Asset Tangibility equals PPE (net property, plant and equipment) divided by assets. Profitability is EBITDA divided by assets. Firm size is composed by the log of net sales. Asset tangibility and profitability are expressed in percentage terms except for firm size. Panel A shows the results for book leverage. Panel B shows the results for the market leverage dependent. The regressions are robust and t-stat values are presented by the columns t().
Panel A: Book Leverage (%)
𝑀𝑡𝐵𝑒𝑓𝑤𝑎,𝑡−1 𝑀𝑡𝐵𝑡−1 𝑃𝑃𝐸/𝐴𝑡−1 𝐸𝐵𝐼𝑇𝐷𝐴/𝐴𝑡−1 log (𝑆)𝑡−1 Year b t(b) b t(b) c t(c) d t(d) e t(e) IPO+1 - - -2.88 -8.29 0.12 6.02 -0.19 -3.99 9.97 12.79 IPO+3 -2.35 -5.05 -0.85 -1.51 0.15 7.89 -0.35 -7.26 11.27 15.59 IPO+5 -3.82 -7.35 0.20 0.36 0.17 7.77 -0.42 -7.33 10.61 12.77 IPO+10 -4.83 -8.26 -0.04 -0.06 0.07 2.52 -0.17 -2.71 8.35 8.01
Panel B: Market Leverage (%) 𝑀𝑡𝐵𝑒𝑓𝑤𝑎,𝑡−1 𝑀𝑡𝐵𝑡−1 𝑃𝑃𝐸/𝐴𝑡−1 𝐸𝐵𝐼𝑇𝐷𝐴/𝐴𝑡−1 log (𝑆)𝑡−1 Year b t(b) b t(b) c t(c) d t(d) e t(e) IPO+1 - - -6.17 -18.91 0.11 5.65 -0.19 -3.87 7.89 10.34 IPO+3 -2.53 -5.59 -6.63 -11.90 0.15 7.02 -0.24 -5.77 8.34 11.21 IPO+5 -6.33 -7.17 -5.53 -8.03 0.19 7.71 -0.30 -5.48 6.79 7.72 IPO+10 -11.33 -9.61 -7.04 -7.85 0.14 4.69 -0.20 -2.43 4.91 5.09