Revista Brasileira de
Engenharia Agrícola e Ambiental
Campina Grande, PB, UAEA/UFCG – http://www.agriambi.com.br
v.22, n.3, p.158-163, 2018
Water salinity, nitrogen and phosphorus on photochemical efficiency
and growth of west indian cherry
DOI: http://dx.doi.org/10.1590/1807-1929/agriambi.v22n3p158-163
Francisco V. da S. Sá
1, Hans R. Gheyi
2, Geovani S. de Lima
1,
Emanoela P. de Paiva
3, Rômulo C. L. Moreira
1& Luderlândio de A. Silva
1A B S T R A C T
The objective of this study was to evaluate the interaction between water salinity and doses of nitrogen and phosphorus on chlorophyll a fluorescence and on the growth of West Indian Cherry (‘acerola’) plants in the initial growth stage. The research was carried out in a protected environment, in lysimeters filled with Regolithic Neosol of loamy clay texture and low initial phosphorus content. The experiment was conducted in a randomized block design, arranged in a factorial scheme with two factors, five levels of electrical conductivity of the irrigation water - ECw (0.6, 1.4, 2.2, 3.0 and 3.8 dS m-1) and four proportions of the recommendation of phosphorus/nitrogen - P/N (100:100, 140:100, 100:140 and 140:140% P/N of recommendation), with three replicates, and each plot consisted of one plant. Water salinity above 2.2 dS m-1 decreases the quantum efficiency of photosystem II and the growth of west indian cherry plants. Increase in nitrogen and/or phosphorus supply improves the energy stability of west indian cherry plants by reducing the effects of salt stress on the quantum efficiency of photosystem II. The increase of 40% in the nitrogen dose increased the chlorophyll a fluorescence, but did not influence the plant growth.
Salinidade da água, nitrogênio e fósforo na eficiência
fotoquímica e crescimento da aceroleira
R E S U M O
Objetivou-se avaliar a interação entre salinidade da água e doses de nitrogênio e fósforo sobre a fluorescência da clorofila a e o crescimento das plantas de aceroleira na fase inicial de crescimento. A pesquisa foi realizada em ambiente protegido, em lisímetros preenchidos com Neossolo Regolítico de textura franco-argilosa e baixo teor inicial de fósforo. O experimento foi instalado em delineamento de blocos casualizados, arranjados em esquema fatorial com dois fatores, sendo cinco níveis de condutividade elétrica da água de irrigação - CEa (0,6; 1,4; 2,2; 3,0 e 3,8 dS m-1) e quatro proporções da recomendação de fósforo nitrogênio -P/N (100:100; 140:100; 100:140 e140:140% P/N da recomendação), com três repetições sendo cada parcela foi constituída de uma planta. Água de salinidade superior à 2,2 dS m-1 diminui a eficiência quântica do fotossitema II e o crescimento das plantas de aceroleira. O incremento no fornecimento de nitrogênio e/ou fósforo melhora a estabilidade energética das plantas de acerola, reduzindo os efeitos do estresse salino sobre a eficiência quântica do fotossitema II. O incremento de 40% na dose de nitrogênio aumentou a florescência da clorofila a das plantas de acerola, porém não influenciou o crescimento das plantas. Key words:
chlorophyll fluorescence saline stress
fertilization Malphigia emarginata
Palavras-chave:
fluorescência da clorofila estresse salino
adubação
Malphigia emarginata
1 Universidade Federal de Campina Grande/Centro de Tecnologia e Recursos Naturais/Unidade Acadêmica de Engenharia Agrícola. Campina Grande,
PB. E-mail: [email protected] - ORCID: 6585-8161 (Corresponding author); [email protected] - ORCID: 0000-0001-9960-1858; [email protected] - ORCID: 0000-0002-4079-4939; [email protected] - ORCID: 0000-0001-9496-5820
2 Universidade Federal do Recôncavo da Bahia/Núcleo de Engenharia de Água e Solo. Cruz das Almas, BA. E-mail: [email protected] - ORCID:
0000-0002-1066-0315
3 Universidade Federal Rural do Semi-Árido/Centro de Ciências Agrárias/Programa de Pós-Graduação em Fitotecnia. Mossoró, RN. E-mail:
[email protected] - ORCID: 0000-0003-4510-9205
Introduction
West indian cherry (Malpighia emarginata L.) is a tropical fruit crop whose fruits stand out for their high content of vitamin C, which varies from 1000 to 1800 mg 100g-1 (Cunha Neto et al., 2012). In Brazil, the crop is estimated to occupy an area of approximately 10,000 ha and the states with highest production are Bahia, Ceará, Paraíba and Pernambuco, responsible for 60% of the national production (Esashika et al., 2013).
Despite the expressive contribution of the west indian cherry crop to the Northeast region of the country, its yield is limited by numerous biotic and abiotic factors, particularly the availability and quality of water for irrigation, fertilization management, low rainfall and irregular rainfalls in semi-arid areas. The use of water with large amount of salts may inhibit plant growth and production, due to the reduction in the soil solution osmotic potential, possibly causing also ionic toxicity, nutritional imbalances or both, simultaneously, due to the excessive accumulation of chloride and sodium in the protoplasm (Munns & Tester, 2008; Syvertsen & Garcia-Sanchez, 2014; Sá et al., 2015). Another inconvenience is plant sensitivity to the salts, which varies according to the species, concentration and ionic nature of the salts, exposure period, phenological stage, availability of nutrients, such as N, P and K, and their interaction (Ashraf & Harris, 2004; Esteves & Suzuki, 2008).
Monitoring the effects of saline stress on plants becomes necessary to understand their physiological behavior under saline stress (Habibi & Amiri, 2013; Sá et al., 2015). In this context, there is also the importance of the interaction between water salinity and soil fertility. Given the above, this study aimed to evaluate the effect of water salinity and nitrogen/ phosphorus combination on chlorophyll a fluorescence during the initial growth of grafted west indian cherry plants.
Material and Methods
The experiment was carried out in a greenhouse at the Center of Technology and Natural Resources (CTRN) of the Federal University of Campina Grande (UFCG), located in the municipality of Campina Grande-PB, Brazil (7° 15’ 18’’ S; 35° 52’ 28’’ W; 550 m).
The experiment was installed in a randomized block design, in 5 x 4 factorial scheme, corresponding to five levels of irrigation water electrical conductivity (0.6, 1.4, 2.2, 3.0 and 3.8 dS m-1) and four proportions of the phosphorus/nitrogen (P/N) recommendation (100:100; 140:100; 100:140 and
140:140% P/N), with three replicates and one plant per plot. The recommendation corresponding to 100% of N fertilization (23.85 g of N plant year-1) and P fertilization (45.0 g P
2O5
plant year-1) was based on Musser (1995).
The experiment was installed in lysimeters with capacity for 250 dm3 whose bottom part was covered with Bidim geotextile and a 5 cm layer of type-1 crushed stone. The soil used to fill the lysimeters was classified as Regolithic Neosol with clay loam texture (0-30 cm layer), from the municipality of Esperança-PB, whose physical and chemical attributes (Table 1) were determined following methodologies proposed by Donagema et al. (2011)
West indian cherry seedlings, cv. BRS 366-Jaburu, grafted on a ‘Criolo’ rootstock, came from the clone garden of Embrapa Tropical Agroindustry, in Pacajus, CE. The obtained seedlings were 240 days old and, during this period, were irrigated using low-salinity water (0.6 dS m-1). Transplanting was performed 90 days after grafting and the water salinity treatments started 30 days after transplanting.
Solutions with lower electrical conductivity levels (ECw of 0.6 and 1.4 dS m-1) were obtained by diluting municipal public-supply water (ECw = 1.78 dS m-1) in rainwater, whereas the other treatments (ECw of 2.2, 3.0 and 3.8 dS m-1) were prepared by adding NaCl, CaCl2.2H2O and MgSO4.7H2O salts to the public-supply water, at equivalent proportion of 7:2:1, respectively, representing the average composition of the contents of ions present in waters used for irrigation in the semi-arid region of Northeast Brazil (Medeiros et al., 2003).
Irrigations using water according to the preestablished ECw levels were performed every 3 days, replacing the evapotranspired volume to increase soil moisture to close to the maximum water retention capacity (33.42 kPa). The volume applied in each irrigation was determined according to plant water demand, based on water balance in the root zone, obtained by the difference between the applied volume minus the volume drained in the previous irrigation. To avoid the accumulation of salts in the root zone, a leaching fraction of 0.10 was applied every 50 days (Ayers & Westcot, 1999).
Fertilizations with N and P were performed according to the preestablished treatments, using urea (45% N) as source of N and single superphosphate (18% P2O5, 18% Ca2+, 12% S) as source of P, based on the recommendation of Musser (1995), adding 19.8 g of K2O per plant, using potassium chloride (60% K2O). 250 and 350 g of single superphosphate were applied as basal fertilization in the treatments of 100 and 140% of P, respectively. N fertilization was split into 24 equal applications,
OM - Organic matter: Walkley-Black wet digestion; Ca2+ and Mg2+ extracted with 1 mol L-1 KCl at pH 7.0; Na+ and K+ extracted with 1 mol L-1 NH
4OAc at pH 7.0; CL - Clay loam; AW - Available
water; Da- Apparent density; Dp- Particle density; ECse - Electrical conductivity of the soil saturation extract
Chemical characteristics pH (H2O)
(1:2.5)
OM dag kg-1
P (mg kg-1)
K+ Na+ Ca2+ Mg2+ Al3+ H+ ECse
(dS m-1) (cmolckg-1)
5.63 1.83 18.20 0.21 0.17 3.49 2.99 0.00 5.81 0.61
Physical characteristics Granulometric fraction
Textural class
Moisture (kPa)
AW Total porosity m3m-3
Da Dp
Sand Silt Clay 33.42 1519.5
(kg dm-3)
g kg-1 dag kg-1
572.7 100.7 326.6 CL 12.68 4.98 7.70 0.5735 1.13 2.65
at 15-day intervals along the year, using 2.21 g of urea per plant in the treatment of 100%, and 3.09 g of urea per plant in the treatment of 140%. Potassium fertilization was divided into 12 equal applications, monthly performed, using 2.75 g of KCl per plant. Fertilization treatments started as seedlings were transplanted to the lysimeters. Pests, diseases and weeds were controlled according to the need.
Initial fluorescence (Fo), maximum fluorescence (Fm), variable fluorescence (Fv = Fm-Fo) and maximum quantum efficiency of photosystem II (Fv/Fm) were evaluated at 150 days after applying the salinity levels, using a hand-held pulse-modulated fluorometer (Model OS5p - Opti Science). The Fv/Fm protocol was used, as performed by Sá et al. (2015) in mandarin hybrids. Evaluations were performed after leaf adaptation to the dark for 30 min, using the dark-adaptation clip of the device, to guarantee that all primary acceptors were oxidized, i.e., the reaction centers were open.
West indian cherry growth was analyzed based on measurements of rootstock and scion diameter to obtain the absolute growth rate (AGR) and relative growth rate (RGR), for the period between 1 (t1) and 150 days (t2) after applying the salinity levels (DASL), and on the number of leaves (NL). Rootstock diameter (mm) was measured at 2 cm from the soil, whereas scion diameter was determined at 2 cm above the grafting point. These data were used to calculate AGR and RGR using Eqs.1 and 2, respectively (Benincasa, 2003).
Results and Discussion
There was significant interaction (p < 0.05) of water salinity x fertilization managements on initial fluorescence (Fo) and quantum efficiency of photosystem II (Fv/Fm) (Table 2). The absolute and relative growth rates in diameter of the rootstock and number of leaves responded to the isolated effects (p < 0.05) of irrigation water salinity, whereas maximum fluorescence and variable fluorescence were significantly influenced only by /P/N proportions (Table 2).
Initial fluorescence (Fo) of west indian cherry plants treated with the P/N proportions of 100:100% and 100:140% increased as water salinity increased, with sharp increment from the ECw levels of 1.06 and 0.96 dS m-1, respectively (Figure 1A). The values relative to plants under P/N proportions of 140:100% and 140:140% did not fit to any mathematical model, showing mean values of 196.8 and 195.3 electrons quantum-1, respectively. Initial fluorescence (Fo) explains the capacity of oxidation of the quinone (QA), primary receptor of electrons in the PSII (P680) reaction center; thus, increment in Fo indicates destruction of the PS (P680) reaction centers or reduction in the capacity of excitation energy transfer from the antenna to the PSII (P680), caused by the saline stress (Baker & Rosenqvst, 2004; Munns & Tester, 2008; Lucena et al., 2012; Sá et al., 2015). Increment of N dose in the P/N combinations stimulated maximum fluorescence (Fm) and variable fluorescence (Fv) in west indian cherry plants under 100:140% P/N, and these indices were 9.03 and 12.17% higher in the treatment 100:140 P/N compared with plants in the control treatment (100:100% P/N) (Figure 1B and C). The maximum intensity of fluorescence (Fm) refers to the state at which the PSII reaction centers reached their maximum capacity, evidencing the reduced condition of all quinone (QA) by the electrons transferred from the P680 (Baker & Rosenqvst, 2004; Mendonça et al., 2010; Silva et al., 2014). Fm directly influences the variable fluorescence, which is the potentially active energy in the PSII. Hence, the increments of Fv observed in plants of the treatment 100:140% P/N are related to the gains in variable fluorescence. Increment of fluorescence may be related to the higher chlorophyll content in the reaction centers of the treatments that received higher N doses, since N is crucial for the synthesis of the chlorophyll molecule (Taiz et al., 2017).
The increase of salinity did not significantly influence the Fv/Fm of plants fertilized with 100:140% and 140:140% P/N, which showed mean values of 0.71 and 0.73 (Figure 1D). For the treatments 100:100% P/N and 140:100% P/N,
AGR A A
t t
= −
−
2 1
2 1
RGR A A
t t
= −
−
ln 2 ln 1
2 1
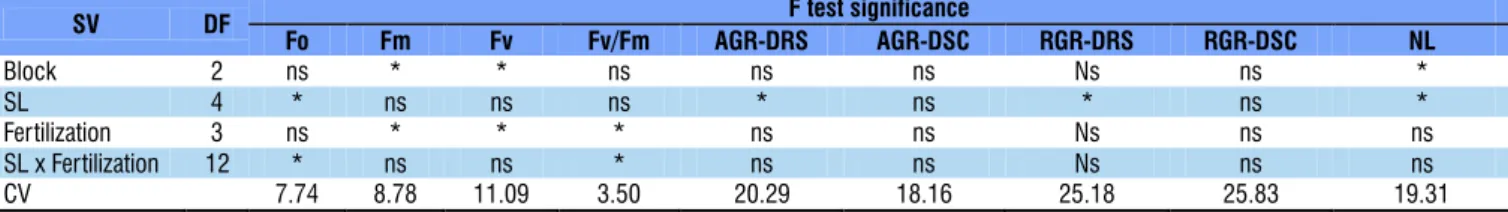
*Significant at 0.05 probability level; ns - Not significant; SL - Water salinity level; Fertilization - Proportions of P/N; CV - Coefficient of variation
SV DF F test significance
Fo Fm Fv Fv/Fm AGR-DRS AGR-DSC RGR-DRS RGR-DSC NL
Block 2 ns * * ns ns ns Ns ns *
SL 4 * ns ns ns * ns * ns *
Fertilization 3 ns * * * ns ns Ns ns ns
SL x Fertilization 12 * ns ns * ns ns Ns ns ns CV 7.74 8.78 11.09 3.50 20.29 18.16 25.18 25.83 19.31
Table 2. Summary of F test for the variables: initial fluorescence (Fo), maximum fluorescence (Fm), variable fluorescence (Fv), quantum efficiency of photosystem II (Fv/Fm), absolute growth rates in diameter of rootstock (AGR-DRS) and scion (AGR-DSC), relative growth rates in diameter of rootstock (RGR-DRS) and scion (RGR-DSC) and number of leaves (NL) of west indian cherry plants irrigated with saline water and fertilized with nitrogen and phosphorus
where:
A2 - variable under study, obtained at the end of the period, mm;
A1 - variable under study, obtained, at the beginning of the period, mm;
t2 - t1 - difference of time between the observations, days; and,
ln - natural logarithm.
Data were subjected to analysis of variance by F test; means of the P/N proportions were compared by Tukey test (p < 0.05) and means of the irrigation water salinity levels were subjected to regression analysis, using the software Sisvar, version 5.1 (Ferreira, 2011).
(1)
** and * - Significant at 0.01 and 0.05 probability levels, respectively; NS - Not significant. Same letters do not differ by Tukey test at 0.05 probability level
Figure 1. Initial fluorescence-Fo (A), maximum fluorescence-Fm (B), variable fluorescence-Fv (C) and quantum efficiency of PSII-Fv/Fm (D) of west indian cherry plants irrigated with saline water and fertilized with nitrogen and phosphorus doses
A.
B.
C.
D.
♦M1-100:100% P/N; ▲M2-140:100% P/N; ■M3-100:140% P/N;●M4-140:140% P/N ♦ŷ = 187.67 - 23.131NSx +10.863**x2R² = 0.97
■ŷ = 198.35 - 9.2798NSx + 4.8363**x2R² = 0.83
▲ŷ (mean) = 196.80 ●ŷ (mean) = 195.33
0 60 120 180 240 300
0.6 1.4 2.2 3.0 3.8
Fo
(el
ec
tr
on
s
quan
tum
-1)
Water salinity (dS m-1)
697 b 719 ab
760 a
727 ab
0 160 320 480 640 800
M1 M2 M3 M4
Fm
(elec
tr
on
s
qua
nt
um
-1)
P/N proportions
493 b 522 ab
553 a 532 ab
0 120 240 360 480 600
M1 M2 M3 M4
Fv
(el
ec
tr
on
s
qua
nt
um
-1)
P/N proportions
♦ŷ = 0.7515 + 0.0188NSx - 0.0111**x2R² = 0.91
■ŷ = 0.7178 + 0.0678NSx - 0.0265**x2R² = 0.97
▲ŷ (mean) = 0.71 ●ŷ (mean) = 0.73 0.00
0.16 0.32 0.48 0.64 0.80
0.6 1.4 2.2 3.0 3.8
Fv
/F
m
Water salinity (dS m-1)
the response was quadratic, with reduction in Fv/Fm from the ECw levels of 0.85 and 1.28 dS m-1, respectively, which coincided with the increment in Fo (Figure 1A and D). The increments in Fo at the highest salinity levels caused a reduction in the quantum efficiency of PSII (Fv/Fm), and this reduction was more noticeable in plants of the treatment 100:100% P/N, compared with the treatment 140:100% P/N, which may be associated with the energy compensation of the plants in the treatment 140:100%, caused by the increment in Fm (Figure 1A and B).
The reduction in quantum efficiency of photosystem II indicates alterations in the photosynthetic system caused by environmental and biotic stress factors (Baker & Rosenqvst, 2004). In general, plants subjected to the combination 100:100% P/N obtained Fv/Fm values lower than those relative to 140:100% P/N,100:140% P/N and 140:140% P/N under irrigation with water salinity above 2.2 dS m-1, which indicates inhibitory action of the saline stress on the chlorophyll a fluorescence of these plants from this level on (Figure 1D). Hence, it becomes evident that acerola
plants that received increment in the N and/or P doses were less affected by the saline stress, because they were with a better energy stability compared with the control treatment (100:100% P/N).
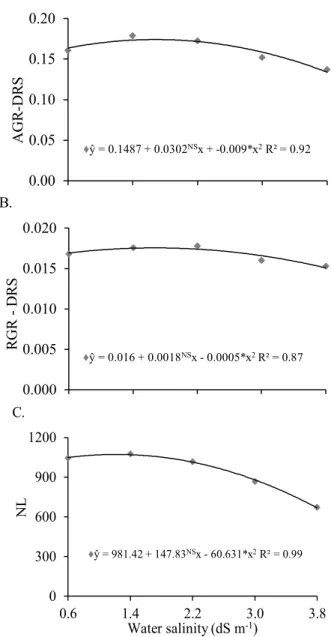
Absolute and relative growth rates of the rootstock and number of leaves of west indian cherry plants were influenced by the increase in irrigation water salinity, showing a quadratic behavior, in which the highest values of absolute growth, relative growth and number of leaves, 0.17 mm day-1, 0.018 mm mm-1 day-1 and 1,071 leaves, respectively, were obtained at ECw levels of 1.68, 1.80 and 1.22 dS m-1, respectively (Figure 2A, B and C).
Conclusions
1. Irrigation using water with electrical conductivity up to 2.2 dS m-1 is viable for west indian cherry cultivation; at higher levels, there is a reduction in quantum efficiency of photosystem II and plant growth.
2. Increment in nitrogen and/or phosphorus doses reduces the negative effects of the saline stress on the quantum efficiency of photosystem II of west indian cherry plants.
3. Increment of 40% in nitrogen dose increases chlorophyll a fluorescence of west indian cherry plants, but does not influence plant growth.
Acknowledgments
To the National Council for Scientific and Technological Development (CNPq) and the Coordination for the Improvement of Higher Education Personnel (Capes) for granting the scholarships and to the National Institute of Science and Technology in Salinity (INCTSal) for the financial aid.
Literature Cited
Ashraf, M.; Harris, P. J. C. Potential biochemical indicators of salinity
tolerance in plants. Plant Science, v.166, p.3-16, 2004. https://doi. org/10.1016/j.plantsci.2003.10.024
Ayers, R. S.; Westcot, D. W. Qualidade da água na agricultura. 2.ed. Campina Grande: UFPB, 1999. 153p. Estudos FAO: Irrigação e Drenagem, 29
Baker, N. R.; Rosenqvist, E. Aplication of chlorophyll fluorescence can improve crop production strategies: An examination of future possibilities. Journal of Experimental Botany, v.55, p.1607-1621, 2004. https://doi.org/10.1093/jxb/erh196
Benincasa, M. M. P. Análise de crescimento de plantas: Noções básicas.
Jaboticabal: FUNEP, 2003. 41p.
Brito, M. E. B.; Brito, K. S. A. de; Fernandes, P. D.; Gheyi, H. R.;
Suassuna, J. F.; Soares Filho, W. dos S.; Melo, A. S. de; Xavier,
D. A. Growth of ungrafted and grafted citrus rootstocks under
saline water irrigation. African Journal of Agricultural Research,
v.9, p.3600-3609, 2014.
Cavalcante, L. F.; Vieira, M. da S.; Santos, A. F. dos; Oliveira, W.M.
de; Nascimento, J. A. M. do. Água salina e esterco bovino líquido
na formação de mudas de goiabeira cultivar Paluma. Revista Brasileira de Fruticultura, v.32, p.251-261, 2010. https://doi. org/10.1590/S0100-29452010005000037
Cunha Neto, J.; Rabelo, M. C.; Bertini, C. H. C. de M.; Marques, G.
V.; Miranda, M. R. A. Caracterização agronômica e potencial antioxidantes de frutos de clones de aceroleira. Revista Ciência Agronômica, v.43, p.713-721, 2012. https://doi.org/10.1590/ S1806-66902012000400013
Donagema, G. K.; Campos, D. V. B.; Calderano, S. B.; Texeira, W. G.;
Viana, J. H. M. Manual de métodos de análise de solo. 2.ed. Rio de Janeiro, RJ: Embrapa Solos, 2011. 230p.
Esashika, T.; Oliveira, L. A. de; Moreira, F. W. Resposta da aceroleira a adubação orgânica, química e foliar num latossolo da Amazônia Central. Revista de Ciências Agrárias, v.36, p.399-410, 2013.
A.
♦ŷ = 0.1487 + 0.0302NSx + -0.009*x2R² = 0.92
0.00 0.05 0.10 0.15 0.20
AGR
-D
RS
B.
♦ŷ = 0.016 + 0.0018NSx - 0.0005*x2R² = 0.87
0.000 0.005 0.010 0.015 0.020
RG
R-DR
S
* and NS = Significant at 0.05 probability level and not significant, respectively
Figure 2. Absolute (AGR - mm day-1) and relative (RGR -mm
mm-1 day-1) growth rates in diameter of rootstock - DRS
from 1 to 150 days (A and B) and number of leaves (C) of west indian cherry plants irrigated with saline water and fertilized with nitrogen and phosphorus at 150 days after applying the salinity levels
C.
♦ŷ = 981.42 + 147.83NSx - 60.631*x2R² = 0.99
0 300 600 900 1200
0.6 1.4 2.2 3.0 3.8
NL
Water salinity (dS m-1)
be confirmed by the alterations observed in chlorophyll a fluorescence (Figures 1A and D).
Esteves, B. dos S.; Suzuki, M. S. Efeito da salinidade sobre as plantas. Oecologia Brasiliensis, v.12, p.662-679, 2008. https://doi. org/10.4257/oeco.2008.1204.06
Ferreira, D. F. Sisvar: A computer statistical analysis system. Ciência e Agrotecnologia, v.35, p.1039-1042, 2011. https://doi.org/10.1590/ S1413-70542011000600001
Habibi, F.; Amiri, M. E. Influence of in vitro salinity on growth, mineral uptake and physiological responses of two citrus
rootstocks. International Journal of Agronomy and Plant
Production, v.4, p.1320-1326, 2013.
Lucena, C. C. de; Siqueira, D. L. de; Martinez, H. E. P.; Cecon, P. R. Salt stress change chlorophyll fluorescence in mango. Revista Brasileira de Fruticultura, v.34, p.1245-1255, 2012. https://doi. org/10.1590/S0100-29452012000400034
Medeiros, J. F. de; Lisboa, R.de A.; Oliveira, M. de; Silva Júnior, M. J. da; Alves, L. P. Caracterização das águas subterrâneas usadas
para irrigação na área produtora de melão da Chapada do Apodi. Revista Brasileira de Engenharia Agrícola e Ambiental, v.7, p.469-472, 2003. https://doi.org/10.1590/S1415-43662003000300010
Mendonça, A. V. R.; Carneiro, J. G. de A.; Freitas, T. A. S. de; Barroso,
D. G. Características fisiológicas de mudas de Eucalyptus spp.
submetidas a estresse salino. Ciência Florestal, v.20, p.255-267, 2010. https://doi.org/10.5902/198050981850
Munns, R.; Tester, M. Mechanism of salinity tolerance. Annual Review of Plant Biology, v.59, p.651-681, 2008. https://doi.org/10.1146/ annurev.arplant.59.032607.092911
Musser, R. S. Tratos culturais na cultura da acerola. In: São José, A. R.;
Alves, R. E. (ed.). Acerola no Brasil: Produção e mercado. Vitória da Conquista: DFZ/UESB, 1995. Cap.3, p.47-52.
Sá, F. V. da S.; Brito, M. E. B.; Silva, L. de A.; Moreira, R. C. L.; Fernandes, P. D.; Figueiredo, L. C. Fisiologia da percepção do estresse salino em híbridos de tangerineira - Sunki Comum sob solução hidropônica salinizada. Comunicata Scientiae, v.6, p.463-470, 2015. https://doi.org/10.14295/cs.v6i4.1121
Silva, L. de A.; Brito, M. E. B.; Sá, F. V. da S.; Moreira, R. C. L. M.; Soares Filho, W. dos S.; Fernandes, P. D. Mecanismos fisiológicos em híbridos de citros sob estresse salino em cultivo hidropônico. Revista Brasileira de Engenharia Agrícola e Ambiental, v.18, p.S1-S7, 2014. https://doi.org/10.1590/1807-1929/agriambi. v18nsupps1-s7
Souto, A. G. de L.; Cavalcante, L. F.; Nascimento, J. A. M.do; Mesquita, F. de O.; Lima Neto, A. J. de. Comportamento do noni
à salinidade da água de irrigação em solo com biofertilizante bovino. Irriga, v.18, p.442- 453, 2013. https://doi.org/10.15809/ irriga.2013v18n3p442
Syvertsen, J. P.; Garcia-Sanchez, F. Multiple abiotic stresses occurring
with salinity stress in citrus. Environmental and Experimental Botany, v.103, p.128-137, 2014. https://doi.org/10.1016/j. envexpbot.2013.09.015