http://dx.doi.org/10.1590/1519-6984.166333 Original Article
Brazilian Journal of Biology
ISSN 1519-6984 (Print) ISSN 1678-4375 (Online)
Braz. J. Biol., 2018 , vol. 78, no. 3, pp. 397-407 397/407 397
A characterization of ecosystem services, drivers and values of
two watersheds in São Paulo State, Brazil
N. A. Periotto
a* and J. G. Tundisi
baUniversidade Federal de São Carlos – UFSCar, Rodovia Washington Luís, s/n, CEP 13565-905, São Carlos, SP, Brazil bInstituto Internacional de Ecologia – IIE, Rua Bento Carlos, 750, CEP 13560-660, São Carlos, SP, Brazil
*e-mail: [email protected]
Received: July 7, 2016 – Accepted: March 8, 2017 – Distributed: October 31, 2018 (With 6 figures)
Abstract
The evaluation of ecosystem services is a tool to raise awareness about benefits of ecosystem functions for human well-being. In Brazil, few studies and reports assess ecosystem services in a watershed context. The aim of this paper is to fill this gap by assessing ecosystem services of Jacaré-Guaçu and Jacaré-Pepira Watersheds (São Paulo State, Brazil) in a temporal scale of 10 years. Land cover and uses’ capacity to provide ecosystem services and drivers were assessed as a result of mapping these areas. Economic values were estimated based on literature information. Results showed that cultivated and managed terrestrial areas stands out over other areas and then, regulation and maintenance services are reduced in these areas. Wetlands and natural vegetation, with smaller areas, are important for the supply of regulation and maintenance services of both watersheds and economic values indicate the magnitude of degradation or maintenance/restoration.
Keywords: Jacaré-Guaçu, Jacaré-Pepira, wetlands, native vegetation, ecosystem services.
Caracterização dos serviços do ecossistema, valores e forçantes de duas
bacias hidrográficas no estado de São Paulo, Brasil
Resumo
A avaliação dos serviços do ecossistema é uma ferramenta utilizada na conscientização sobre os benefícios das funções e serviços dos ecossistemas para o bem-estar humano, bem como a importância da sua conservação. No Brasil, existem poucos estudos que avaliam serviços ecossistêmicos no contexto das bacias hidrográficas. O objetivo deste trabalho é preencher esta lacuna por meio da avaliação dos serviços ecossistêmicos das bacias hidrográficas dos Rios Jacaré-Guaçu e Jacaré-Pepira (estado de São Paulo, Brasil) em uma escala temporal de 10 anos. A capacidade da cobertura e uso da terra em prover serviços ecossistêmicos e as forçantes foram avaliadas como resultado do mapeamento destas áreas. Valores econômicos foram estimados com base em dados de literatura científica. Os resultados mostraram que as áreas terrestres cultivadas e manejadas se destacam em relação aos outros usos e por isto, os serviços de regulação e manutenção são diminuídos nestas áreas. Áreas alagadas e de vegetação nativa, com áreas menores, têm papel fundamental no suprimento dos serviços de regulação e manutenção e, portanto, devem ser recuperadas e protegidas. Demografia e atividades econômicas na bacia foram identificadas como as principais forçantes que atuam sobre os serviços do ecossistema das áreas de vegetação nativa e áreas alagadas. Os valores econômicos estimados mostram, independente dos valores de base adotados, a magnitude dos impactos antrópicos que modificam estes ecossistemas, e dos ganhos referentes à recuperação e conservação dos mesmos.
Palavras-chave: Jacaré-Guaçu, Jacaré-Pepira, áreas alagadas, vegetação nativa, serviços do ecossistema.
1. Introduction
The evaluation of ecosystem services and drivers that influence their supply for society, as well as estimates of their economic values, are tools to raise awareness about the benefits of ecosystem functions for human well-being and the importance of protecting and restoring native ecosystems.
highlighted the influence of drivers on ecosystem services changes. Other influential publications proposed typologies of classification and frameworks to assess ecosystem services (Groot et al., 2002; Freeman et al., 2003; Stern, 2007; Wallace, 2007; Costanza et al., 2016). Haines-Young
and Potschin (2013), proposed the Common International
Classification of Ecosystems Services (CICES), which unifies all existing typologies to enhance the quality of comparisons between worldwide assessments.
In Brazil, researches have been carried out primarily on local and regional identification of effects of intensifying agriculture in ecosystem services provided by biodiversity (Borner et al., 2007; Foley et al., 2007; Galetti et al., 2010; Balvanera et al., 2012), but few studies evaluate ecosystem services in a watershed context (Seidl and Moraes, 2000; Agostinho et al., 2010; Periotto and Tundisi, 2013; Tundisi and Matsumura-Tundisi, 2016). In addition, although overall environmental, social and economic situation of hydrographic basins is annually reported by watershed committees, there is lack of publications regarding ecosystem services in these management units. This paper attempts to fill this this gap in the literature by making an overall assessment of ecosystem services of Jacaré-Guaçu and Jacaré-Pepira Watersheds (São Paulo State, Brazil) in a temporal scale of 10 years.
2. Methods
2.1. Study area description
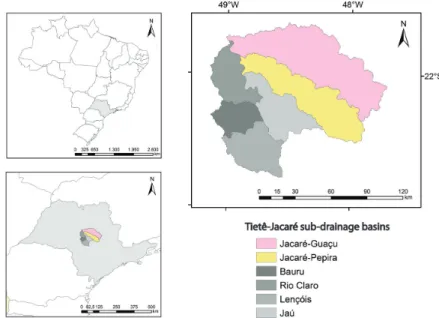
Jacaré-Guaçu and Jacaré-Pepira Watersheds are located in the middle of São Paulo State, Brazil. They compose two of the six sub basins and comprise the three main
rivers of the Tietê-Jacaré Hydrographic Basin (Figure 1):
(a) Jacaré-Guaçu River, which runs through Jacaré-Guaçu Watershed, is born where Feijão River joins Lobo River, below Carlos Botelho (Lobo/Broa) Reservoir (Itirapina Municipality);
(b) Pepira River, which runs through Jacaré-Pepira Watershed, is born in Itaqueri Mountain, between Brotas and São Pedro Municipalities; (c) Tietê River, which passes through both basins.
Its waterway, Tietê-Paraná, is very important for national economy for the transport and distribution of agricultural production.
Both watersheds cover 22 municipalities. Jacaré-Guaçu Watershed encompasses Analândia, Araraquara, Gavião Peixoto, Ibaté, Matão, Nova Europa, São Carlos, Tabatinga. Jacaré-Pepira Watershed covers Bariri, Bocaina, Dois Córregos, Itaju, Jaú, Torrinha and São Pedro. Some municipalities are located in both watersheds as Ibitinga, Boa Esperança do Sul, Trabijú, Dourado, Ribeirão Bonito, Brotas and Itirapina. Among the mentioned municipalities, Ibitinga, Tabatinga, Matão, Araraquara, Ibaté, São Carlos, Analândia, Itirapina, São Pedro, Torrinha, Dois Córregos, Jaú, Bocaina, Bariri and Itajú are not totally inserted in the watersheds boundaries.
Three dams for hydroelectric power generation are present. Ibitinga Hydroelectric Power Plant (UHE), UHE Bariri and UHE Carlos Botelho (Lobo/Broa). UHE Ibitinga is owned by AES Tietê S/A, an independent energy producer, with generating capacity of 131,490 MW (ANEEL, 2013). It is located at the middle portion of Tietê River, between Ibitinga and Iacanga Municipalities, downstream UHE Bariri. UHE Bariri is also owned by AES Tietê S/A, with generating capacity of 136,8 MW (ANEEL, 2013). It is located upstream UHE Ibitinga and downstream UHE Barra Bonita. Carlos Botelho (Lobo Broa) UHE is located in Jacaré-Guaçú Watershed. It is a small scale energy producer, owned by Aratu Geração S/A, with generating capacity of 2 MW (Matos, 2012).
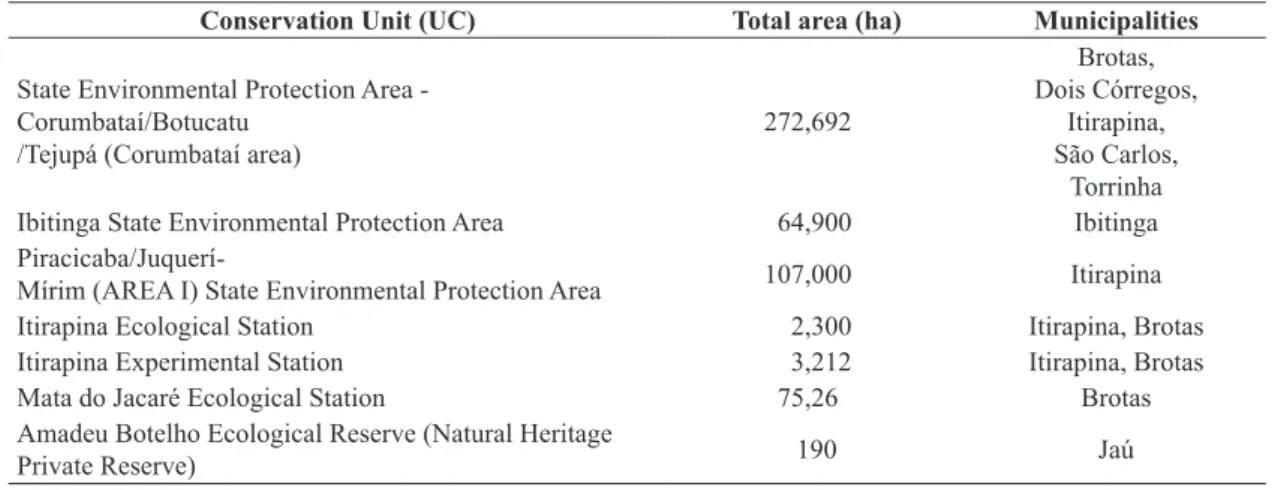
There are important Conservation Units in Jacaré-Guaçu
and Jacaré-Pepira Watersheds (Table 1). Ibitinga Environmental
Ecosystem services of Jacaré-Guaçu and Jacaré-Pepira Watersheds
Braz. J. Biol., 2018 , vol. 78, no. 3, pp. 397-407 399/407 399
Protection Area protects two large wetlands of Jacaré-Guaçú and Jacaré-Pepira Rivers. Corumbataí/Botucatú-Tejupá Environmental Protection Area also protects important wetlands of Lobo Stream and Itaqueri Stream.
2.2. Identification of land cover and use
In order to evaluate ecosystem services and drivers of change in 2004 and 2014, land cover and uses were identified for the areas of the 22 municipalities inserted in the watersheds boundaries.
For this purpose, orthorectified images were downloaded from United States Geological Service (USGS, 2016a, b) (Table 2). The compositions of spectral band used were 3B-4G-5R for images of sensor TM (Landsat 5) and 4B-5G-6R for images of sensor OLI (Landsat 8).
The classification of land cover and use was carried out using manual mode of vectorization of the USGS images,
with ArcGis software (ESRI, 2014). SIRGAS 2000 Datum
and UTM zone 22 S projection were applied to the maps.
2.3. Evaluation of ecosystems services and drivers of change
The identification of land cover and uses enabled the organization of a matrix of land cover and uses capacity to provide ecosystem services, based on Burkhard et al. (2009) and the Common International Classification of
Ecosystems Services (CICES) (Haines-Young and Potschin,
2013). Values were assigned for each land capacity with the
following criteria: (0) no relevant capacity, (1) low relevant capacity, (2) relevant capacity, (3) high relevant capacity. Values were attributed based on scientific knowledge on ecological processes in each land cover and use. From this
matrix, the main drivers of change of ecosystem services were assessed.
2.4. Estimates of ecosystem services values of wetlands and native vegetation
Due to the contribution of wetlands and native vegetation in providing water quality and quantity for the population of Jacaré-Guaçu and Jacaré-Pepira Watersheds, estimates of values were made by value transfer method based on literature about the valuation of these ecosystems. Native vegetation values were calculated according to “forest” values of Costanza et al. (2014) and wetlands values were based on Seidl and Moraes (2000), Carvalho (2007) and
Costanza et al. (2014) (Table 3). All base values from different
years were equalized by multiplication for Consumer Price Index (CPI) conversion factor equal to 1,38 (referring to
the year of 2007), as used by Costanza et al. (2014).
3. Results and Discussion
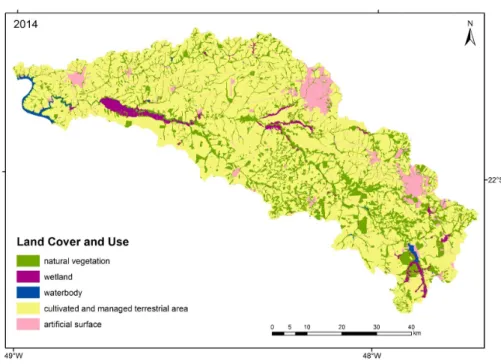
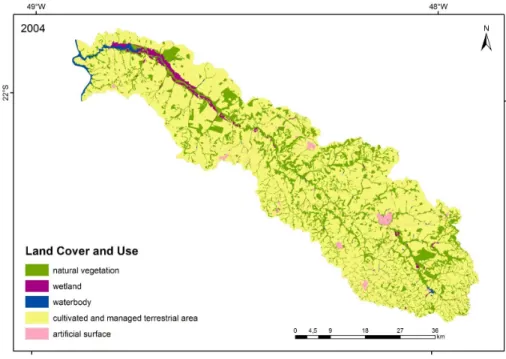
3.1. Land cover and use
Land cover and uses identified are shown in Figures 2 to 5. All land cover and uses identified were grouped into 5 categories (adapted from Di Gregorio and Jansen, 2005) and are displayed in Table 4.
It can be observed in 2004 and 2014 a predominance of cultivated and managed terrestrial areas over other categories in both watersheds. Tables 5 and 6 show approximate changes, in hectares and percentage, in land cover areas in 2004 and 2014. Although native vegetation (the second largest land cover area) occupies almost 20% of each watershed area, it can be observed in land cover maps (Figures 2 to 5) that it is fragmented, possibly negatively impacting biodiversity and ecosystem services of these areas.
There were increases in native vegetation (2.2%) and wetlands (13.6%) areas, as well as in artificial surfaces (15.6%) in Jacaré-Guaçu Watershed. In Jacaré-Pepira Watershed, there were also increases in native vegetation (1.6%) and artificial surfaces (18.0%). Decreases observed
Table 1. Conservation Units in Jacaré-Guaçu and Jacaré-Pepira Watersheds. Total area (ha) corresponds to the total area of the Conservation Unit, which includes areas in adjacent watersheds.
Conservation Unit (UC) Total area (ha) Municipalities
State Environmental Protection Area -Corumbataí/Botucatu
/Tejupá (Corumbataí area) 272,692
Brotas, Dois Córregos,
Itirapina, São Carlos,
Torrinha
Ibitinga State Environmental Protection Area 64,900 Ibitinga
Piracicaba/Juquerí-Mírim (AREA I) State Environmental Protection Area 107,000 Itirapina
Itirapina Ecological Station 2,300 Itirapina, Brotas
Itirapina Experimental Station 3,212 Itirapina, Brotas
Mata do Jacaré Ecological Station 75,26 Brotas
Amadeu Botelho Ecological Reserve (Natural Heritage
Private Reserve) 190 Jaú
Table 2. Date of acquisition of orthorectified images (day/month/year).
Orbit/point Landsat 5 Landsat 8
220/75 30/08/2004 11/09/2014
220/76 30/08/2004 11/09/2014
Table 3. Reference values (US$.ha.year-1) for ecosystem services estimates.
Carvalho (2007) Seidl and Moraes (2000)
Costanza et al. (2014) Costanza et al.
(1997)
Groot et al. (2012)
Native vegetation - - 1,338.00 3,800.00
Wetland 1,600.00 5,839.72 20,404.00 140,174.00
Figure 2. Land cover and use in Jacaré-Guaçu Watershed, in 2004.
Ecosystem services of Jacaré-Guaçu and Jacaré-Pepira Watersheds
Braz. J. Biol., 2018 , vol. 78, no. 3, pp. 397-407 401/407 401
Figure 4. Land cover and use in Jacaré-Pepira Watershed in 2004.
Figure 5. Land cover and use in Jacaré-Pepira Watershed in 2014.
Table 4. Categories of classification of land cover and use identified in Jacaré-Guaçu and Jacaré-Pepira Watersheds.
Categories Land cover and use
Native vegetation Semidecidual Seasonal Forest and Cerrado
Wetland Floodplain area
Cultivated and managed terrestrial area Pasture, annual crop, permanent crop, exposed soil, forestry and mining
Artificial surface Industry, urban fabric, rural infrastructure and road network
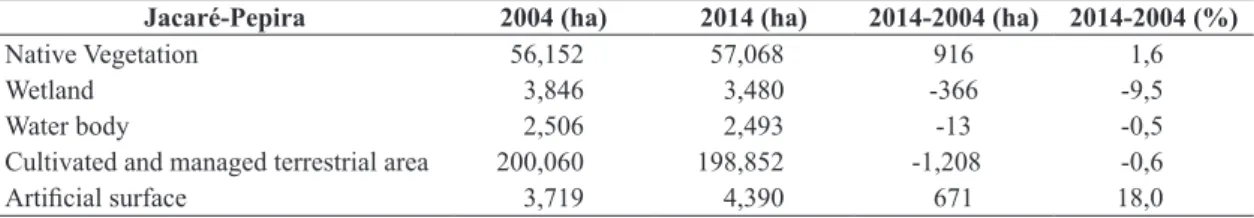
in Jacaré-Pepira wetlands areas may be due to a decline in annual rainfall in 2014 (1,117.7 mm) compared to 2004 (1,615.6 mm) (INMET, 2016).
3.2. Ecosystems services and drivers of change
Land cover and use maps made possible the assessment of ecosystem services. Identifying ecosystem services is a good approach to list the contribution of ecosystems to society. As both watersheds presented similar land cover and uses in both years, a single preliminary matrix of provision capacities was organized (Table 7). Twenty-nine (29) ecosystem services were identified and values of capacity (from 0 to 3) were assigned based on scientific knowledge on the functioning of the studied ecosystems.
Native vegetation, wetlands and water bodies were land covers with the greatest capacities of providing different ecosystem services. Cultivated and managed terrestrial areas had high scores in provisioning services, while artificial surfaces showed the lowest scores of all land covers ad uses.
Regulation and maintenance services, although being of indirect use, was the ecosystem service group with the highest score, mainly in native vegetation, wetlands and water body areas. However, some land covers did not punctuate in this group, for instance, artificial surfaces. On the other hand, all land cover and uses punctuated in
cultural services, showing the importance of nonmaterial benefits of these areas.
Although the qualitative results of this matrix are preliminary, they may help in planning and decision-making of land management. They also give an overview of the dependence of some components of artificial surfaces on natural and managed ecosystems. In this context, not only temporal scale must be taken into account, but also spatial scale, as well as the relationships among ecosystem services (Bennett et al., 2009). An urban region requires a much
larger land area than its borders to supply residents with ecosystem goods and services (Rees, 1992), then increases in artificial surface - which includes urban areas – and in population number may indicate that there might have been increases in human pressures over goods and services of adjacent ecosystems, for example, in the form of higher demands of drinking water and disposal of wastewater.
To supply higher demands, ecosystems that provide water and wastewater treatment, such as natural vegetation and wetlands, respectively, must be conserved or even restored. It can be observed in Figures 2 to 5 that riparian forests in Jacaré-Guaçu and Jacaré-Pepira Watersheds are in inadequate size to guarantee quality and quantity of water for
the municipalities’ population. Rodrigues-Filho et al. (2015)
reported that riparian forests widths in Lobo Watershed (a subbasin of Jacaré-Guaçu Watershed) are in reduced size and additional losses in riparian areas would compromise ecosystem services and the quality of waterbodies, which
were already classified as mesotrophic by Lamparelli
(2004). Matheus and Tundisi (1988) found that riparian
vegetation density directly influences chemical parameters of waterbodies in Itaqueri and Lobo Watersheds (inside Jacaré-Guaçu Watershed). Therefore, it is evident that ecosystem services provided by riparian vegetation are crucial for water quality and that there is urgency to recover and protect these areas in both watersheds.
Further, non-punctual disposal of nutrients along the watersheds, coming from agricultural practices, for instance, may overload wetlands capacity to recycle nutrients (biogeochemical cycles) and buffer freshwater chemical condition. Protecting/recovering natural vegetation and wetlands maintain/improve all ecosystem services linked to the hydrological cycle, for human well-being (Bullock and Acreman, 2003; Tundisi and Matsumura-Tundisi, 2010). This includes availability of water for abiotic services as hydropower generation in both watersheds.
Table 5. Approximate changes in land cover areas (ha and %) of Jacaré-Guaçu Watershed, between 2004 and 2014. Negative
values represent losses in area.
Jacaré-Guaçu 2004 (ha) 2014 (ha) 2014-2004 (ha) 2014-2004 (%)
Native Vegetation 77.585 79.313 1.728 2.2
Wetland 7.948 9.031 1.083 13.6
Water body 4.025 3.829 -196 -4.8
Cultivated and managed terrestrial area 305.460 299.476 -5.984 -1.9
Artificial surface 21.531 24.900 3.369 15.6
Table 6. Approximate changes in land cover areas (ha and %) of Jacaré-Pepira Watershed, between 2004 and 2014. Negative
values represent losses in area.
Jacaré-Pepira 2004 (ha) 2014 (ha) 2014-2004 (ha) 2014-2004 (%)
Native Vegetation 56,152 57,068 916 1,6
Wetland 3,846 3,480 -366 -9,5
Water body 2,506 2,493 -13 -0,5
Cultivated and managed terrestrial area 200,060 198,852 -1,208 -0,6
Ecosystem services of Jacaré-Guaçu and Jacaré-Pepira W atersheds
Braz. J. Biol., 2018 , vol. 78, no. 3, pp. 397-407 403/407
403
T
able 7.
Matrix of land cover and uses capacities to provide ecosystem services in Jacaré-Guaçu and Jacaré-P
epira W atersheds. Land Cover and Use Provisioning Services Crops
Reared animals and their outputs
Wild animals and their outputs
Animals from in-situ aquaculture
Surface water
Fibers and other materials from plants and animals for direct use or processing
Genetic materials for all biota
Renewable abiotic energy sources Abiotic materials
Regulation and Maintenance Services
Filtration/sequestration/storage/accumulation by ecosystems
Dilution by freshawater ecosystems
Mass stabilisation and control of erosion rates
Buffering and attenuation of mass flows
Mediation of smell/noise/visual impacts
Hydrological cycle and water flow maintenance
Flood protection
Pollination and seed dispersal
Maintaining nursery populations and habitats
Pest control
Soil formation and composition
Decomposition and fixing processes (biogeochemical cycling) Maintenance/buffering of freshwater chemical conditions
Global climate regulation by reduction of greenhouse gas concentrations
Regulation of local and regional climate
Cultural Services
Physical interaction - recreation
Scientific and educational
Aesthetic Existence Transportation TOTAL Native V egetation Semidecidual Seasonal
Forest and Cerrado
9 0 0 3 0 0 3 3 0 0 39 3 0 3 0 3 3 3 3 3 3 3 3 3 3 3 12 3 3 3 3 0 60 W etland Floodplain areas 11 0 0 3 0 2 3 3 0 0 43 3 3 3 3 1 3 3 3 3 3 3 3 3 3 3 12 3 3 3 3 0 66 Cultivated and Managed T err estrial Ar ea Pasture 4 0 3 0 0 0 0 1 0 0 3 2 0 1 0 0 0 0 0 0 0 0 0 0 0 0 5 1 3 1 0 0 12 Annual crops 7 3 0 0 0 0 3 1 0 0 10 2 0 1 0 1 1 1 1 1 0 0 0 0 1 1 4 0 3 1 0 0 21 Perennial crops 7 3 0 0 0 0 3 1 0 0 10 2 0 1 0 1 1 1 1 1 0 0 0 0 1 1 4 0 3 1 0 0 21 Exposed soil 1 0 0 0 0 0 0 1 0 0 3 2 0 0 0 0 0 0 1 0 0 0 0 0 0 0 3 0 3 0 0 0 7 Forestry 5 0 0 1 0 0 3 1 0 0 12 2 0 1 0 3 1 1 1 1 0 0 0 0 1 1 4 0 3 1 0 0 21 Mining 3 0 0 0 0 0 0 0 0 3 0 0 0 0 0 0 0 0 0 0 0 0 0 0 0 0 3 0 3 0 0 0 6 Artificial Surface Industry 0 0 0 0 0 0 0 0 0 0 0 0 0 0 0 0 0 0 0 0 0 0 0 0 0 0 3 0 3 0 0 0 3 Urban fabric 0 0 0 0 0 0 0 0 0 0 0 0 0 0 0 0 0 0 0 0 0 0 0 0 0 0 6 3 3 0 0 0 6 Rural infrastructure 0 0 0 0 0 0 0 0 0 0 0 0 0 0 0 0 0 0 0 0 0 0 0 0 0 0 3 0 3 0 0 0 3 Road network 0 0 0 0 0 0 0 0 0 0 0 0 0 0 0 0 0 0 0 0 0 0 0 0 0 0 3 0 0 0 0 3 3 W aterbody
Rivers, reservoirs and
other water bodies
18 0 0 3 3 3 3 3 3 0 30 3 3 0 2 0 3 3 3 3 0 0 3 3 1 3 15 3 3 3 3 63 T OT AL 65 6 3 10 3 5 18 14 3 3 150 19 6 10 5 9 12 12 13 12 6 6 9 9 10 12 77 13 36 13 9 6
0=no relevant capacity; 1=low relevant capacity; 2=relevant capacity; 3=high relevant capacity
Cultivated and managed terrestrial areas, with conventional cropping systems in Jacaré-Guaçu and Jacaré-Pepira Watersheds, are planned to maximize the production of provisioning services, characterized mainly by annual crops (sugar cane) and perennial crops (orange plantations), as observed in field trips and satellite images. On the other hand, it is noted in Table 7 that this optimization may cause declines in regulation and maintenance services that would be crucial for its self-maintenance. As a result, agricultural inputs as fertilizers, soil correctives and pesticides, are needed to sustain the crops. Alternative plantation techniques, such as green fertilizing (Ambrosano et al., 2011), by crop rotation with legumes, would improve sugar cane production (provisioning services) and restore some regulation and maintenance services in these areas, since legumes would replace exposed soil during between-harvest periods and enrich soil. Such alternative practice may also protect wetlands and waterbodies’ ecosystem services by preventing runoff of nutrients and sediments into these systems. Enhancing and protecting ecosystem services in both managed and natural areas leads to a “win-win situation” with ecological, economic and social benefits
(Groot et al., 2010).
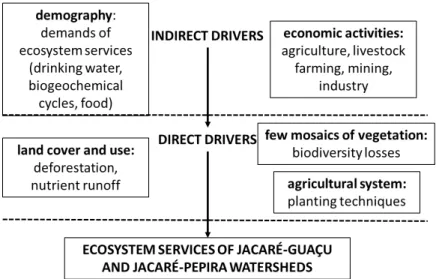
In light of this context, main direct and indirect drivers of change on ecosystem services identified are summarized in Figure 6. Increases in demography may lead to changes in demands of ecosystem services and then, intensification of economic activities. As a result, intensive uses of land, with conventional planting techniques, for example, may cause massive deforestation and runoff of nutrients and sediments into waterbodies. Massive deforestation may also causes losses in biodiversity needed to sustain ecosystem services in the watersheds.
Besides identifying services and their drivers, valuing is also an effective tool to raise awareness about the magnitude of the benefits that ecosystem services provide to human beings and to capture these values in decision-making
processes. Also, economic values reflect gains and losses in ecosystem services caused by drivers.
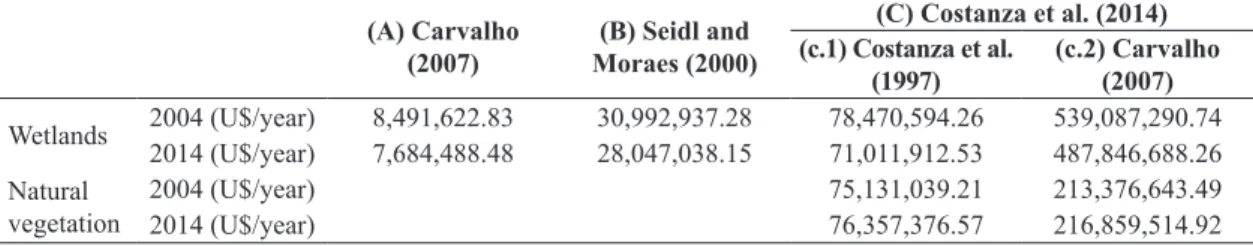
Economic values of wetlands and natural vegetation’s ecosystem services are shown in Tables 8 and 9. The first column shows values based on Carvalho (2007), who considers two methodologies that reflect individual choices (Willingness to Pay) and income (Travel Costs). The second column with values based on Seidl and Moraes (2000), refers to a local re-estimative of Costanza et al. (1997) values in a Brazilian wetland area. Third and fourth columns indicate values found in Costanza et al. (2014) who updates values of global values of ecosystems services found in Costanza et al. (1997) and Groot et al. (2012).
Increases in values of wetlands and natural vegetation’s ecosystem services from 2004 to 2014 are observed as a consequence of (1) increases in total areas of these systems, with exception of wetlands in Jacaré-Pepira Watershed, according to our land use results; (2) base values used in value transfer estimates, resulted from application of different methodologies, considering few ecosystem services and individual perception of value (Tables 8 and 9, A), or a greater number of ecosystem services applied locally (Tables 8 and 9, B) and globally (Tables 8 and 9, C); and (3) base values resulting from new updated values resulted from extensive studies with more precise quantification (Tables 8 and 9, c.1 and c.2).
The decrease in economic values of wetlands in Jacaré-Pepira Watershed may be due to the abnormal drought period in 2014 that probably reduced wetlands area in this watershed. Drops in values indicate losses in the flux of ecosystem services for society in this period.
Values in Tables 8 and 9 clearly demonstrate the potential economic value of the remaining natural vegetation and wetlands of both watersheds, independently of base values used. It is evident that these values could rise if riparian vegetation and mosaics of natural vegetation were recovered and more protection areas were created.
Ecosystem services of Jacaré-Guaçu and Jacaré-Pepira Watersheds
Braz. J. Biol., 2018 , vol. 78, no. 3, pp. 397-407 405/407 405
4. Conclusions
The main land cover and use of Jacaré-Guaçu and Jacaré-Pepira Watersheds in 2004 and 2014 are cultivated and managed terrestrial areas, which are designed to supply society with provisioning services, but provide few regulation and maintenance services, crucial for human well-being. Regulation and maintenance services are mostly found in native vegetation, wetlands and waterbodies, but they may be affected by drivers as demography and economic activities. Alternative management of land uses may enhance regulation and maintenance services in cultivated and managed terrestrial areas and protect ecosystem services of native areas.
Economic values demonstrate the potential economic value of the remaining native vegetation and wetlands of Jacaré-Guaçu and Jacaré-Pepira Watersheds and the magnitude of gains and losses if these ecosystems are protected/recovered or degraded.
Results highlight that the management of Jacaré-Guaçu and Jacaré-Pepira Watersheds must consider the interrelations between social and environmental aspects. While there is high anthropic demand on provisioning ecosystem services, there is also the urgency to restore and protect native vegetation components that provide indirect use services, such as regulation and maintenance ones that guarantee the continuity of provisioning services. Consequently, it is relevant to recover and protect native vegetation in both watersheds, mainly in riparian areas, which guarantees water availability that sustain provisioning services (crops). It is also important to implement alternative land management practices in the surrounding areas of wetlands, since current agricultural practices directly impact in a negative way the flux and provision of ecosystem services.
Acknowledgements
The research for this paper was financially supported by The São Paulo Research Foundation (FAPESP), process number 2012/12991-9. We thank Camila Francisco Gonçalves and Rômulo Theodoro Costa for assistance with land cover and use mapping.
References
AGÊNCIA NACIONAL DE ENERGIA ELÉTRICA – ANEEL,
2013 [viewed 5 April 2013]. Capacidade de geração do Brasil: usinas do tipo UHE em operação [online]. Brasília. Available from: http://www.aneel.gov.br/aplicacoes/capacidadebrasil/
GeracaoTipoFase.asp?tipo=1&fase=3
AGOSTINHO, F., AMBRÓSIO, L.A. and ORTEGA, E., 2010. Assessment of a large watershed in Brazil using Emergy Evaluation
and Geographical Information System. Ecological Modelling, vol. 221, pp. 1209-1220.
AMBROSANO, E.J., CANTARELLA, H., AMBROSANO,
G.M.V., SCHAMMAS, E.A., DIAS, F.L.F., ROSSI, F., TRIVELIN, P.C.O., MURAOKA, T., SACHS, R.C.C. and AZCÍN, R., 2011.
Produtividade da cana-de-açúcar após o cultivo de leguminosas.
Bragantia, vol. 70, no. 4, pp. 810-818.
BALVANERA, P., URIARTE, M., ALMEIDA-LEÑERO, L., ALTESOR, A., DECLERCK, F., GARDNER, T., HALL, J., LARA, A., LATERRA, P., PEÑA-CLAROS, M., SILVA MATOS, D.M., VOGL, A.L., ROMERO-DUQUE, L.P., ARREOLA, L.F., CARO-BORRERO, Á.P., GALLEGO, F., JAIN, M., LITTLE, C., DE OLIVEIRA XAVIER, R., PARUELO, J.M., PEINADO, J.E., POORTER, L., ASCARRUNZ, N., CORREA, F.,
CUNHA-SANTINO, M.B., HERNÁNDEZ-SÁNCHEZ, A.P. and VALLEJOS, M., 2012. Ecosystem services research in Latin America: the state of the art. Ecosystem Services, vol. 2, pp. 56-70. http://dx.doi.
org/10.1016/j.ecoser.2012.09.006.
Table 8. Economic values of wetland and natural vegetation of Jacaré-Guaçu Watershed. Values are in 2007 American
dollars.
(A) Carvalho (2007)
(B) Seidl and Moraes (2000)
(C) Costanza et al. (2014) (c.1) Costanza et al.
(1997)
(c.2) Groot et al. (2012)
Wetlands 2004 (U$/year)2014 (U$/year) 17,550,198.13 64,055,151.89 162,180,363.52 1,114,167,333.64 19,940,614.68 72,779,753.97 184,270,064.26 1,265,921,975.45 Natural
vegetation
2004 (U$/year) 103,808,532.61 294,822,439.41
2014 (U$/year) 106,120,336.99 301,388,102.06
Table 9. Economic values of wetland and natural vegetation of Jacaré-Pepira Watershed. Values are in 2007 American
dollars.
(A) Carvalho (2007)
(B) Seidl and Moraes (2000)
(C) Costanza et al. (2014) (c.1) Costanza et al.
(1997)
(c.2) Carvalho (2007)
Wetlands 2004 (U$/year)2014 (U$/year) 8,491,622.83 30,992,937.28 78,470,594.26 539,087,290.74 7,684,488.48 28,047,038.15 71,011,912.53 487,846,688.26 Natural
vegetation
2004 (U$/year) 75,131,039.21 213,376,643.49
BENNETT, E.M., PETERSON, G.D. and GORDON, L.J., 2009. Understanding the relationship among multiple ecosystem services. Ecology Letters, vol. 12, no. 12, pp. 1394-1404. PMid:19845725.
http://dx.doi.org/10.1111/j.1461-0248.2009.01387.x.
BORNER, J., MENDOZA, A. and VOSTI, S.A., 2007. Ecosystem services, agriculture, and rural poverty in the Eastern Brazilian Amazon: interrelationships and policy prescriptions. Ecological Economics, vol. 64, no. 2, pp. 356-373. http://dx.doi.org/10.1016/j. ecolecon.2007.03.001.
BULLOCK, A. and ACREMAN, M., 2003. The role of wetlands in the hydrological cycle. Hydrology and Earth System Sciences, vol. 73, no. 3, pp. 358-389. http://dx.doi.org/10.5194/hess-7-358-2003. BURKHARD, B., KROLL, F., MÜLLER, F. and WINDHORST,
W., 2009. Landscape’s capacity to provide ecosystem services:
a concept for land-cover assessments. Landscape Online, vol. 15, pp. 1-22.
CARVALHO, A.R., 2007. An ecological economics approach to
estimate the value of a fragmented wetland in Brazil (Mato Grosso do Sul state). Brazilian Journal of Biology = Revista Brasileira de Biologia, vol. 67, no. 4, pp. 663-671. PMid:18278318. http:// dx.doi.org/10.1590/S1519-69842007000400011.
COSTANZA, R., D’ARGE, R., GROOT, R., FARBER, S.,
GRASSO, M., HANNON, B., LIMBURG, K., NAEEM, S.,
O’NEILL, R.V., PARUELO, J., RASKIN, R.G., SUTTON, P. and
VAN DEN BELT, M., 1997. The value of the world’s ecosystem
services and natural capital. Nature, vol. 387, no. 6630, pp. 253-260. http://dx.doi.org/10.1038/387253a0.
COSTANZA, R., GROOT, R., SUTTON, P., VAN DER PLOEG, S., ANDERSON, S.J., KUBISZEWSKI, I., FARBER, S. and
TURNER, R.K., 2014. Changes in the global value of ecosystem services. Global Environmental Change, vol. 26, pp. 152-158.
http://dx.doi.org/10.1016/j.gloenvcha.2014.04.002.
COSTANZA, R., HOWARTH, R.B., KUBISZEWSKI, I., LIU, S., MA, C., PLUMECOCQ, G. and STERN, D.I., 2016. Influential publications in ecological economics revisited. Ecological Economics, vol. 123, pp. 68-76. http://dx.doi.org/10.1016/j.
ecolecon.2016.01.007.
DI GREGORIO, A. and JANSEN, L.J.M., 2005. Land cover classification system: classification concepts and user manual.
Rome: Food and Agriculture Organization of the United Nations.
ESRI, 2014 [viewed 5 April 2013]. ArcGis. Version 10.2 [software]. Available from: http://www.esri.com
FOLEY, J.A., ASNER, G.P., COSTA, M.H., COE, M.T., DEFRIES, R., GIBBS, H.K., HOWARD, E.A., OLSON, S., PATZ, J.,
RAMANKUTTY, N. and SNYDER, P., 2007. Amazonia revealed: forest degradation and loss of ecosystem goods and services in the Amazon Basin. Frontiers in Ecology and the Environment, vol. 5, no. 1, pp. 25-32. http://dx.doi.org/10.1890/1540-9295(2007)5[25:AR FDAL]2.0.CO;2.
FREEMAN, A.M., HERRIGES, J.A. and KLING, C.L., 2003. The measurement of environmental and resource values: theory and methods. Washington: RFF Press. 478 p.
GALETTI, M., PARDINI, R., DUARTE, J.M.B., SILVA, V.M.F., ROSSI, A. and PERES, C.A., 2010. Mudanças no Código Florestal e seu impacto na ecologia e diversidade dos mamíferos no Brasil. Biota Neotropica, vol. 10, no. 4, pp. 47-52. http://dx.doi. org/10.1590/S1676-06032010000400006.
GROOT, R.; BRANDER, L.; VAN DER PLOEG, S.; COSTANZA, R.; BERNARD, F.; BRAAT, L.; CHRISTIE, M.; CROSSMAN,
N.; GHERMANDI, A.; HEIN, L.; HUSSAIN, S.; KUMAR, P.; MCVITTIE, A.; PORTELA, R.; RODRIGUEZ, L.V.; TEN
BRINK, P.; VAN BEUKERING, P. 2012. Global estimates of the value of ecosystems and their services in monetary units. Ecosystem Services, vol. 1, no. 1, pp. 50-61.
GROOT, R.S., WILSON, M.A. and BOUMANS, M.J., 2002. A typology for the classification, description and valuation of ecosystem functions, goods and services. Ecological Economics, vol. 41, no. 3, pp. 393-408.
http://dx.doi.org/10.1016/S0921-8009(02)00089-7.
GROOT, R.S., ALKEMADE, R., BRAAT, L., HEIN, L. and
WILLEMEN, L., 2010. Challenges in integrating the concept of ecosystem services and values in landscape planning, management and decision making. Ecological Complexity, vol. 7, no. 3, pp. 260-272. http://dx.doi.org/10.1016/j.ecocom.2009.10.006.
HAINES-YOUNG, R.; POTSCHIN, M., 2013. Common International Classification of Ecosystem Services (CICES): 2011 Update. Nottingham: European Environment Agency. EEA
Framework Contract no. EEA/IEA/09/003.
INSTITUTO NACIONAL DE METEOROLOGIA – INMET, 2016
[viewed 15 March 2016]. Dados históricos [online]. Available from: http://www.inmet.gov.br
LAMPARELLI, M.C., 2004. Grau de trofia em corpos d’água do estado de São Paulo: avaliação dos métodos de monitoramento.
São Paulo: Instituto de Biociências, Universidade de São Paulo,
238 p. Tese de Doutorado.
MATHEUS, C.E. and TUNDISI, J.G., 1988. Estudo físico
químico e ecológico dos rios da bacia hidrográfica do Ribeirão e represa do Lobo. In: J.G. TUNDISI, ed. Limnologia e ecologia de represas. São Paulo: ACIESP; FAPESP; CNPq; UNEP; UNCRD, pp. 419-472. Série Monografias em Limnologia,
vol. 1, tomo 1.
MATOS, A.S., 2012. Melhoras qualitativas na modelagem de levantamentos batimétricos em reservatórios por meio da ferramenta computacional “CAV-NH”. São Carlos: Escola de Engenharia de São Carlos, Universidade de São Paulo, 137 p.
Tese de Doutorado em Ciências da Engenharia Ambiental. MILLENNIUM ECOSYSTEM ASSESSMENT – MEA, 2005.
Ecosystems and human well-being: synthesis. Washington: Island Press. 155 p.
PERIOTTO, N.A. and TUNDISI, J.G., 2013. Ecosystem
Services of UHE Carlos Botelho (Lobo/Broa): a new approach
for management and planning of dams multiple-uses. Brazilian Journal of Biology = Revista Brasileira de Biologia, vol. 73, no. 3, pp. 471-482. PMid:24212686. http://dx.doi.org/10.1590/ S1519-69842013000300003.
REES, W.E., 1992. Ecological footprints and appropriated carrying capacity: what urban economics leaves out. Environment and Urbanization, vol. 4, no. 2, pp. 121-130. http://dx.doi.org/10.11 77/095624789200400212.
RODRIGUES-FILHO, J.L., DEGANI, R.M., SOARES, F.S., PERIOTTO, N.A., BLANCO, F.P., ABE, D.S.,
MATSUMURA-TUNDISI, T., TUNDISI, J.E. and TUNDISI,
J.G., 2015. Alterations in land uses based on amendments
Ecosystem services of Jacaré-Guaçu and Jacaré-Pepira Watersheds
Braz. J. Biol., 2018 , vol. 78, no. 3, pp. 397-407 407/407 407
SEIDL, A.F. and MORAES, A.S., 2000. Global valuation of
ecosystem services: application to the Pantanal da Nhecolandia,
Brazil. Ecological Economics, vol. 33, no. 1, pp. 1-6. http://dx.doi.
org/10.1016/S0921-8009(99)00146-9.
STERN, N.H., 2007. The economics of climate change: the stern review. Cambridge: Cambridge University Press. 692 p.
TUNDISI, J.G. and MATSUMURA-TUNDISI, T., 2010. Impactos
potenciais das alterações do Código Florestal nos recursos
hídricos. Biota Neotropica, vol. 10, no. 4, pp. 67-76. http://dx.doi. org/10.1590/S1676-06032010000400010.
TUNDISI, J.G. and MATSUMURA-TUNDISI, T., 2016. Integrating ecohydrology, water management, and watershed economy: case
studies from Brazil. Ecohydrology and Hydrobiology, vol. 16, no. 2, pp. 83-91. http://dx.doi.org/10.1016/j.ecohyd.2016.03.006.
U.S. Geological Survey – USGS, 2016a [viewed 12 April 2016].
Produtos de reflectância de superfície [online]. Available from: http:// landsat.usgs.gov/documents/provisional_lasrc_product_guide.pdf
U.S. Geological Survey – USGS, 2016b [viewed 12 April 2016].