ABSTRACT: Studies addressing the physiological and anatomical responses of plants under different light intensities normally are performed in short term. Thus, the present study includes a long term analysis. This study aims to verify whether the phenotypic variability off attributes in two woody tropical specieis, Paquira aquatica and Sterculia foetida, are compatible both under short term
exposure to different light availability levels (full-light and half-light local irradiance) and long-term exposure in the same conditions. The study was developed in two phases: phase I (short term) and phase II (long term). The variables measured were referent to CO2 assimilation responses to light intensity, chlorophyll a fluorescence, chlorophyll content, morpho-anatomical attributes and phenotypic variability. In phase I, P. aquatica had differences between treatments in Amax (maximum net photosynthesis) and LCP (light compensation point), without differences in these attributes in phase II. S. foetida
BASIC AREA -
Article
Changes in phenotypic variability of two tropical
woody species due to short and long-term
exposure to different irradiances
Silvia Pereira, Gabriella Frosi*, Marciel Teixeira de Oliveira, Bruno Melo Lustosa, Emília Pereira Arruda, Mauro Guida Santos
Universidade Federal de Pernambuco - Departamento de Botânica - Laboratório de Fisiologia Vegetal - Recife (PE), Brazil.
*Corresponding author: [email protected] Received: Jul. 12, 2017 – Accepted: Nov. 14, 2017
plants had differences only in phase I in Amax. In anatomical attributes, P. aquatica had a higher palisade and spongy parenchyma and mesophyll thickness compared to S. foetida plants, without differences between light treatments. In S. foetida, the aforementioned cell layers were thicker in full-light treatment. Both species showed a higher phenotypic variability in the same physiological attributes in phase I and similar attributes for mesophyll thickness of the abaxial epidermis in phase II. The species showed different anatomical and physiological strategies, however with plastic responses in similar attributes, only observable after a longer period of exposure. The results indicated the importance of lengthy exposure to light, mainly in tropical species, wich are naturally exposed to elevated irradiance levels for an extended period of time in the field.
Key words: chlorophyll a fluorescence, gas exchange, plastic
INTRODUCTION
Plants can alter physiological and anatomical attributes to fit the environment under different light conditions (Oguchi et al. 2003). The acclimation process in the leaf photosynthetic metabolism has a particular pattern under different light availability (Hallik et al. 2012). Plant species can adapt, both through natural selection or by modifying their physiology, morphology, and anatomy via phenotypic plasticity (Valladares 2008) in order to maintain stable growth. Furthermore, studies on phenotypic plasticity using variation coefficient are relevant to characterize species performance under environmental changes (Valladares et al. 2006).
Studies have shown the relationship between photosynthetic metabolism and light availability in herbaceous and shrubs (Oguchi et al. 2003) and tree species (Hallik et al. 2012; Kitao et al. 2016). However, most studies on light acclimation have been conducted over a short term period of exposure, not reflecting real field conditions, especially for tree species, which normally exhibit slower development.
In Brazilian Northeastern region, solar radiation is high from early morning onward (Frosi et al. 2013; Oliveira et al. 2014). In this region, most species are submitted to over double the radiation quantities needed to saturate photosynthetic machinery. In this study, we used two tropical woody species, Pachira aquatica and Sterculia foetida, which are natural to Brazilian’s Northeast flora. Due to the high oil content in their seeds (Oliveira et al. 2000), the aforementioned species are important in recovery efforts in degraded areas by deforestation (Meli and Carrasco-Carballido, 2008; Santos et al. 2004). Furthermore, studies by Frosi et al. (2017) report that both species had drought tolerance and by Lustosa et al. (2017) also pointed that
S. foetida possesses tolerance to NaCl contents on soil. Thus, the use of these species is feasible as economic and ecological alternative in the cultivation of semiarid regions. In light of this conclusion, this study aims at verifying whether phenotypic variability attributes remained the same in both species when exposed to short (phase I) and long term (phase II) different light conditions. Moreover, this study attempts to identify whether both woody species show variations in the same attributes over time, due to belonging to the same family. We hypothesized that the attributes with high phenotypic variability of physiological
and anatomical attributes are the more important to light acclimation. Furthermore, these attributes are the same among phases I and II and are similar in both species.
MATERIAL AND METHODS
Characterization of species
Pachira aquatica Aubl. and Sterculia foetida L. belong to the Malvaceae family. P. aquatica is native to the area from southern Mexico to northern South America, and is often found in flooded areas and riparian forests. It is an evergreen tree with a dense canopy, measuring 6-14 m in height and easily adapting to different edaphic conditions (Peixoto and Escudeiro 2002). S. foetida is native to the area from East Africa to North Australia and well adapted to tropical and sub-tropical climates. It is large, straight, and can grow up to 40 m in height (Vipunngeun and Palanuvej 2009).
Plant material and growth conditions
The experiment was conducted in a greenhouse (8°08’58’’S, 34°56’55’’W) in the northeast region of Brazil. The design for the experiment was completely randomized in a factorial arrangement of 2 light levels [full-light and half-light] × 2 species [Pachira aquatica and Sterculia foetida], totaling 4 treatments: P. aquatica under full and half light; S. foetida under full and half light, with three plants for each treatment. Exclusively for density epidermal cell and epidermal thickness, we also were considering the leaf surface (abaxial and adaxial) as factor.
among 132 to 153 days. After these measurements, the plants continued under these conditions (full and half-light) until 417 days of exposure, characterizing phase II (long term). In phase II, measurements were performed among 390 to 417 days.These intervals were determined to verify whether changes in physiological attributes remain the same over time, whereas most studies have only analyzed short time periods in order to verify acclimation strategies.
The vapor pressure deficit (VPD) was calculated according to Campbell and Norman (1998). It was obtained using temperature and relative air humidity, measured with a digital thermal hygrometer (Termo-Higro SH 122, J Prolab., São José dos Pinhais, BR) in each light condition. For full-lightand half-light irradiance, the VPD average was 2.4 kPa.
Plant water status
The leaf water potential (Ψl) was measured at the end of
phases I and II in 5 plants per treatment, at predawn, using a pressure chamber (model 3035, Soil Moisture Equipment Corp., Santa Barbara, CA, USA).
Gas exchange and chlorophyll fluorescence
Gas exchange and chlorophyll fluorescence measurements were performed in 5 replicates in one third of each expanded leaf. The measurements were recorded from 9 h to 10 h 30 min with an infrared gas analyser (IRGA, LI-COR, model LI – 6400XT, Lincoln, NE, US) in a leaf chamber fluorometer (6400–40) during phase I and phase II for each treatment. The chamber had an area of 2 cm2 and a
gas flow of 400 mmol·s–1. The PPFD of 2,000 µmol·m–2·s–1
was used for the full-light treatment and 1,000 µmol·m–2·s–1
for the half-light treatment. The VPD leaf average under full-lightand half-light irradiance was 4 and 3 kPa, respectively. Net photosynthetic rate (A), stomatal conductance (gs),
and transpiration rate (E), were measured.
For the chlorophyll a fluorescence variable, the leaves were adapted to the dark for 30 min to determine minimal fluorescence from a dark-adapted leaf (Fo). Maximum
fluorescence from a dark-adapted leaf (Fm) was calculated
after a saturation pulse of ~7000 μmol·m-2·s-1. Fluorescence
emission from a light-adapted leaf (F') and maximum fluorescence from a light-adapted leaf (Fm') were determined
for light-adapted leaves undergoing stable photosynthesis.
The data was used to calculate the maximum quantum efficiency of PSII photochemistry (Fv/Fm), electron transport
rate (ETR), PSII operating efficiency (Fq'/Fm'), photochemical
quenching (qP), and nonphotochemical quenching (NPQ) (Baker, 2008).
CO2 assimilation responses to light intensity
(A-PPFD)
The A-PPFD curves were obtained by varying PPFD values from 20 to 2,000 µmol·m–2·s–1 with an infrared gas
analyzer (IRGA, LI–COR, model LI–6400XT, Lincoln, NE, US) in 3 plants from each species per treatment. The curves were designed in a controlled environment (temperature: 25°C; relative humidity: 68%) where the plants were exposed at 153 (phase I) and 410 days (phase II) of light availability.
The A-PPFD curve was obtained using the Prado and Moraes (1997) as illustrated by Eq. 1:
A = Amax (1 – e
–k(PPFD – LCP)) (1)
where A = net photosynthetic rate (µmol·m–2·s–1), A max =
maximum net photosynthesis (µmol·m–2·s–1), e = Euler
constant, k = constant of proportionality, PPFD = Photosynthetic photon flux density (µmol·m–2·s–1), and
LCP = light compensation point (µmol·m–2·s–1). From
the curves, the maximum net photosynthesis (Amax), light compensation point (LCP), light saturation point (LSP), and dark respiration rate (RD) of the plants were calculated.
RD was calculated by attributing a zero value for PPFD. LSP was found at 90% of Amax in the adjusted PPFD curve by using Eq. 1. The rate of CO2 production by photorespiration (PR) can then be calculated as described in Franco and Lüttge (2002) on Eq. 2:
PR = [αL (ETRsat) – 4(Asat +RD)]/12 (2)
where αL = light absorbance of leaves of each species [however, typical values are in the range of 0.8 (Long et al. 1993), and this value was used in this study], ETR = electron transport rate at light saturation point, Asat = net
photosynthesis at light saturation point, and RD = dark
Chlorophyll content
Chlorophyll (Chl) content and leaf anatomical analyses were performed in 3 replicates from each treatment with the same leaves used in the gas exchange and chlorophyll fluorescence measures. Chl a and b contents were analyzed in phase I and phase II of each treatment in both species by macerating 80 mg of leaf tissue in 2 mL of acetone (80%) with CaCO3 to prevent chlorophyllase activity, according
to Lichtenthaler and Buschmann (2001). The absorbance was measured at 470.0, 646.8, 663.2, and 710 nm using a double beam spectrophotometer (Genesys 10S UV-Vis, Thermo Scientific, Madison, Wisconsin, USA).
Leaf anatomical analyses
The anatomical attributes were evaluated by the end of phase II. Leaf samples exposed to different light availabilities were collected from 3 replicates and fixed in FAA 50 for 48 h and stored in 70% ethanol. The samples were dehydrated in an ethanol-butanol series, embedded in paraffin, and transversely sectioned using a 10 μm Zeiss rotary microtome (model HYRAX M55). The sections were stained using 1% Alcian blue and 1% safranin and placed on semi-permanent slides using Canada balsam (Purvis et al. 1964). The dissociation of the epidermis was performed in S. foetida with a hydrogen peroxide and acetic acid 1:1 solution (Franklin 1945), and in P. aquatica with a 50% sodium hypochlorite solution, washed in distilled water and stained with safranin (1%). The semi-permanent slides were mounted in 50% glycerin (Purvis et al. 1964), and the structures were recorded using a Leica digital imaging system (LAS EZ Version 2.0.0 ICC 50) attached to a Leica photomicroscope (model DM500). The images were analyzed using the ImageJ software version 1.47r. Stomatal and epidermal cell densities, epidermal thickness, and leaf palisade and spongy parenchyma thickness were measured in 20 randomly selected microscopic fields obtained from three leaves per plant, and the stomatal index was calculated according to Salisbury (1928).
Phenotypic variability measures
A general coefficient of variation for physiological (gas exchange and chlorophyll a fluorescence) and anatomic attributes was calculated using data from both phases
(phase I and II) for each species (Valladares 2006) as described in Eq. 3:
%CV = SD/TotalAv × 100 (3)
where SD is the standard deviation of TotalAv, and TotalAv is the average of each characteristic in each phase for each species.
The confidence interval was calculated using the Bootstrap confidence interval tool in the R program and using 999 randomizations (Version 0.99.486 – 2009-2015 RStudio, Inc.).
Statistical analyses
The data for gas exchange, chlorophyll a fluorescence, stomatal density, stomatal index mesophyll thickness and the palisade and the spongy parenchyma were submitted to the factorial ANOVA, comparing light availability conditions (full-light and half-light) and species (P. aquatica
and S. foetida).
Density epidermal cells and epidermal thickness (anatomical attributes) were subjected to a factorial ANOVA, comparing light availability conditions (full-light and half-light), leaf surface (abaxial and adaxial) and species (P. aquatica and
S. foetida). For these attributes, the leaf surface is the important factor, mainly in different light conditions, since the leaves are very plastic. When significant differences were observed, the means were compared using the Student Newman Keuls test at a 5% probability. In analyses, all the prerequisites (normality and homogeneity) were respected.The data was analyzed using the Statistica 7.0 software (StatSoft. Inc., Tulsa, OK, USA).
RESULTS
Plant water status
The plant water status (Ψl) at predawn did not differ in phases I and II among treatments for both species. The Ψl at predawn was –0.27 MPafor P. aquatica and –0.34 MPa for S. foetida (data not shown).
CO2 assimilation responses to light intensity
(A-PPFD)
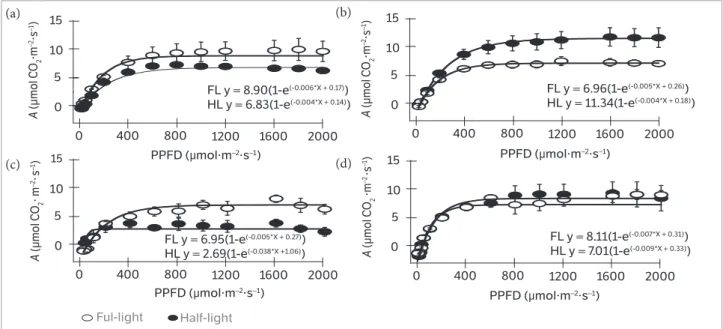
under half-light irradiance compared to full-light treated plants, while S. foetida plants exhibited opposite behaviour, with reduction above 30% (Figure1 and Table 1). LCP
did not differ in S. foetida; however, it was 60% lower in
P. aquatica plants under full-light irradiance compared to the half-light treatment.
Figure 1. Light response curves of net photosynthesis (A) in function of photosynthetic photon flux density (PPFD) of Pachira aquatica (a,c) and Sterculia foetida (b,d) plants at 153 (phase I – a,b) and 410 days (phase II – c,d) under controlled conditions (constant temperature at 25°C
and relative humidity at 68%) exposed to 1,000 (half-light - HL) and 2,000 μmol·m-2·s-1 (full-light - FL) irradiance (n = 3 ± SE)
Table 1. Maximum net photosynthesis (Amax), light compensation point (LCP), light saturation point (LSP), dark respiration (RD ), photorespiration
(PR) and chlorophyll (Chl) in the leaves of young plants from Pachira aquatica and Sterculia foetida grown under different light availability
(full-light and half-light of irradiance) after 150 (phase I) and 365 (phase II) days of exposure in treatments. Values represent the mean values of experimental replicates (n = 3 ± SE).
Pachira aquatica Sterculia foetida
Full-light Half-light Full-light Half-light
Phase I
Amax 9.83 ± 1.88A 6.88 ± 0.41B 6.99 ± 0.62B 11.37 ± 1.69A
LCP 22.85 ± 0.78C 56.58 ± 0.05A 48.33 ± 4.80AB 41.41 ± 3.96B
LSP 565.91 ±113.07NS 485.92 ± 45.58 489.52 ± 23.71 598.52 ± 23.71
RD –0.50 ± 0.25NS –1.25 ± 0.40 –1.34 ± 0.20 –1.35 ± 0.20
PR 2.78 ± 0.52NS 2.46 ± 0.12 2.31 ± 0.14 3.42 ± 0.34
Chl a 2.15 ± 0.02C 1.88 ± 0.10C 4.36 ± 0.15B 4.75 ± 0.15A
Chl b 0.70 ± 0.01C 0.57 ± 0.02C 1.25 ± 0.05B 1.44 ± 0.06A
Phase II
Amax 6.60 ± 1.10AB 3.31 ± 0.79B 8.10 ± 1.18A 6.72 ± 0.08AB
LCP 71.81 ± 3.93A 54.39 ± 6.75A 34.40 ± 8.59B 45.76 ± 3.20B
LSP 603.27 ± 77.96A 186.83 ± 15.36B 313.08 ±131.92AB 323.96 ± 2.36AB
RD –1.06 ± 0.12NS –2.39 ± 0.11 –1.93 ± 0.52 –1.65 ± 0.67
PR 4.57 ± 0.38A 1.26 ± 0.25B 2.05 ± 0.33B 2.34 ± 0.26B
Chl a 1.76 ± 0.22A 1.75 ± 0.27A 0.96 ± 0.14B 1.12 ± 0.21B
Chl b 0.44 ± 0.02A 0.43 ± 0.06A 0.22 ± 0.01B 0.36 ± 0.04B
*Different letters in lines denote significant differences between treatments (full and half-light) and species (P. aquatica and S. foetida) by Newman Keuls test (P < 0.05) in each phases (phase I and II).
0 400 0
5 10 15
800 1200 PPFD (µmol·m–2·s–1)
Half-light Ful-light
A
(µmol C
O2
·m
–2·s –1)
1600 2000
0 400 0
5 10
15
800 1200 PPFD (µmol·m–2·s–1)
A
(µmol C
O2
· m
–2·
s
–1)
1600 2000
0 400 0
5 10 15
800 1200 PPFD (µmol·m–2·s–1)
A
(µmol C
O2
·m
–2·s –1)
1600 2000
0 400 0
5 10 15
800 1200 PPFD (µmol·m–2·s–1)
A
(µmol C
O2
·
m
–2·s –1)
1600 2000 FL y = 8.90(1-e(-0.006*X + 0.17))
HL y = 6.83(1-e(-0.004*X + 0.14))
FL y = 6.96(1-e(-0.005*X + 0.26))
HL y = 11.34(1-e(-0.004*X + 0.18))
FL y = 8.11(1-e(-0.007*X + 0.31))
HL y = 7.01(1-e(-0.009*X + 0.33))
FL y = 6.95(1-e(-0.005*X + 0.27))
HL y = 2.69(1-e(-0.038*X +1.06)) (a)
(c)
(b)
Amax did not differ in phase II for both species.
P. aquatica showed higher LCP than S. foetida. P. aquatica
showed higher LSP under full-light compared to the half-light treatment. P. aquatica plants showed higher Pr under full-light compared to half-light irradiance and S. foetida
plants (Figure1 and Table 1).
Chlorophyll content
Chlorophyll content differed between treatments and species in phase I. P. aquatica plants had lower concentration of Chl a and Chl b than S. foetida. However, S. foetida plants had higher chlorophyll concentration under half-light irradiance when compared to full-light treatment (Table 1).
In phase II, P. aquatica plants showed higher concentrations of Chl a and Chl b than S. foetida (Table 1).
Leaf anatomical attributes
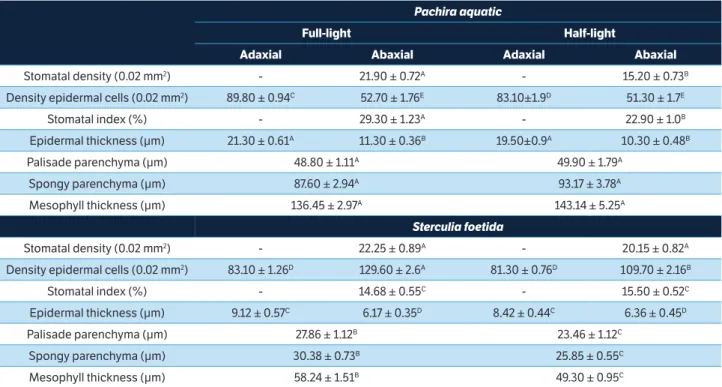
Both species had stomata only on abaxial side. Pachira aquatica showed lower stomatal index under half-light irradiance when compared to samples under full-light
irradiance. S. foetida showed no difference of stomatal index between treatments. However, P. aquatica showed the highest index values (Table 2).
Density of epidermal cells was higher on adaxial face of
P. aquatica, while S. foetida showed higher density on abaxial face under full-light treatment for both species (Table 2). Epidermal thickness differed between species and sides, being thicker in P. aquatica plants than S. foetida plants. The highest values were obtained on adaxial faces of both species under both light treatments (Table 2).
P. aquatica plants showed thicker palisade and spongy parenchyma and mesophyll than S. foetida. These attributes differed in S. foetida plants between treatments, with higher values under full-light treatment than half-light irradiances (Table 2).
Phenotypic variability
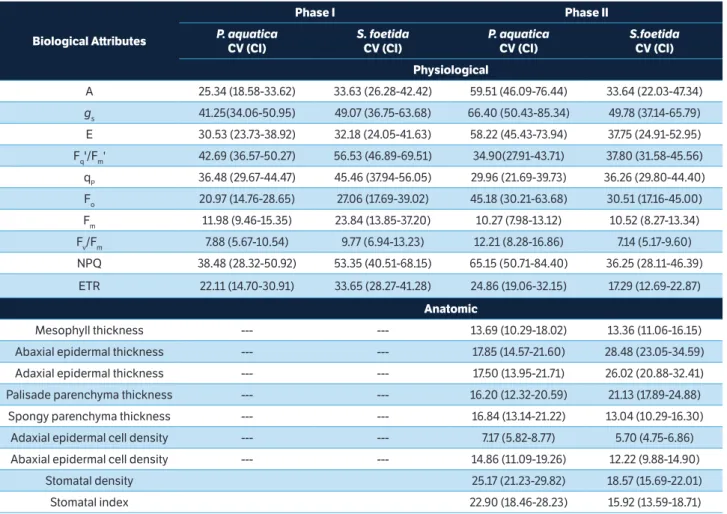
S. foetida and P. aquatica showed similar phenotypic variability for all physiological attributes in phase I (Table 3), with greater variability in Fq'/Fm', gs, NPQ and qP. In phase
II, P. aquatica showed greater variability in gs, NPQ, A, E
Table 2. Anatomical attributes in the leaves of young plants from Pachira Aquatica and Sterculia foetida under different light availability (full-light and half-(full-light of irradiance) after 365 days of exposure (phase II). Values represent the mean values of experimental replicates (n = 3 ± SE)
Pachira aquatic
Full-light Half-light
Adaxial Abaxial Adaxial Abaxial
Stomatal density (0.02 mm2) - 21.90 ± 0.72A - 15.20 ± 0.73B
Density epidermal cells (0.02 mm2) 89.80 ± 0.94C 52.70 ± 1.76E 83.10±1.9D 51.30 ± 1.7E
Stomatal index (%) - 29.30 ± 1.23A - 22.90 ± 1.0B
Epidermal thickness (μm) 21.30 ± 0.61A 11.30 ± 0.36B 19.50±0.9A 10.30 ± 0.48B
Palisade parenchyma (μm) 48.80 ± 1.11A 49.90 ± 1.79A
Spongy parenchyma (μm) 87.60 ± 2.94A 93.17 ± 3.78A
Mesophyll thickness (μm) 136.45 ± 2.97A 143.14 ± 5.25A
Sterculia foetida
Stomatal density (0.02 mm2) - 22.25 ± 0.89A - 20.15 ± 0.82A
Density epidermal cells (0.02 mm2) 83.10 ± 1.26D 129.60 ± 2.6A 81.30 ± 0.76D 109.70 ± 2.16B
Stomatal index (%) - 14.68 ± 0.55C - 15.50 ± 0.52C
Epidermal thickness (μm) 9.12 ± 0.57C 6.17 ± 0.35D 8.42 ± 0.44C 6.36 ± 0.45D
Palisade parenchyma (μm) 27.86 ± 1.12B 23.46 ± 1.12C
Spongy parenchyma (μm) 30.38 ± 0.73B 25.85 ± 0.55C
Mesophyll thickness (μm) 58.24 ± 1.51B 49.30 ± 0.95C
and Fo, while S. foetida presented greater variability in gs,
Fq'/Fm', E, qP, NPQ and A. Furthermore, P. aquatica showed
greater variability only in NPQ compared to S. foetida. In phase II, P. aquatica had greater variability in A, E, and Fo,
while S. foetida showed decreased variability of Fq'/Fm', Fm,
and ETR, compared to phase I.
In anatomical attributes, P. aquatica showed the greatest variability of stomatal density, stomatal index, and abaxial and adaxial epidermal thickness. Abaxial and adaxial epidermis and palisade parenchyma were thicker in
S. foetida. Furthermore, S. foetida showed greater variability of abaxial epidermis thickness than P. aquatica.
DISCUSSION
Net photosynthetic rate changed during experimental period in P. aquatica and S. foetida, demonstrating the
Table 3. Coefficient of variation (CV) and confidence intervals (CI) of biological attributes of Pachiraaquatica and Sterculia foetida plants under different light availability (full-light and half-light of irradiance) after 150 (phase I) and 365 (phase II) days of exposure.
Biological Attributes
Phase I Phase II
P. aquatica
CV (CI)
S. foetida
CV (CI)
P. aquatica
CV (CI)
S.foetida
CV (CI)
Physiological
A 25.34 (18.58-33.62) 33.63 (26.28-42.42) 59.51 (46.09-76.44) 33.64 (22.03-47.34)
gs 41.25(34.06-50.95) 49.07 (36.75-63.68) 66.40 (50.43-85.34) 49.78 (37.14-65.79)
E 30.53 (23.73-38.92) 32.18 (24.05-41.63) 58.22 (45.43-73.94) 37.75 (24.91-52.95)
Fq'/Fm' 42.69 (36.57-50.27) 56.53 (46.89-69.51) 34.90(27.91-43.71) 37.80 (31.58-45.56)
qP 36.48 (29.67-44.47) 45.46 (37.94-56.05) 29.96 (21.69-39.73) 36.26 (29.80-44.40)
Fo 20.97 (14.76-28.65) 27.06 (17.69-39.02) 45.18 (30.21-63.68) 30.51 (17.16-45.00)
Fm 11.98 (9.46-15.35) 23.84 (13.85-37.20) 10.27 (7.98-13.12) 10.52 (8.27-13.34)
Fv/Fm 7.88 (5.67-10.54) 9.77 (6.94-13.23) 12.21 (8.28-16.86) 7.14 (5.17-9.60)
NPQ 38.48 (28.32-50.92) 53.35 (40.51-68.15) 65.15 (50.71-84.40) 36.25 (28.11-46.39)
ETR 22.11 (14.70-30.91) 33.65 (28.27-41.28) 24.86 (19.06-32.15) 17.29 (12.69-22.87)
Anatomic
Mesophyll thickness --- --- 13.69 (10.29-18.02) 13.36 (11.06-16.15)
Abaxial epidermal thickness --- --- 17.85 (14.57-21.60) 28.48 (23.05-34.59)
Adaxial epidermal thickness --- --- 17.50 (13.95-21.71) 26.02 (20.88-32.41)
Palisade parenchyma thickness --- --- 16.20 (12.32-20.59) 21.13 (17.89-24.88)
Spongy parenchyma thickness --- --- 16.84 (13.14-21.22) 13.04 (10.29-16.30)
Adaxial epidermal cell density --- --- 7.17 (5.82-8.77) 5.70 (4.75-6.86)
Abaxial epidermal cell density --- --- 14.86 (11.09-19.26) 12.22 (9.88-14.90)
Stomatal density 25.17 (21.23-29.82) 18.57 (15.69-22.01)
Stomatal index 22.90 (18.46-28.23) 15.92 (13.59-18.71)
acclimation capacity of these woody species. In phase I,
P. aquatica and S. foetida had differences in Amax, while
P. aquatica showed differences in LSP and Pr in phase II,
which were higher under full-light treatment. Results suggest that fully expanded leaves of trees could change photosynthetic activity when more mature, showing a dynamic pattern (Hallik et al. 2012).
PR may represent strong electron drain in C3 plants related
to protection mechanisms (Silva et al. 2015), which could be stimulated by excess light energy, as observed in P. aquatica
under full-light irradiance during phase II. Allocation of high excitation energy to PR could mitigate deleterious effects
of excessive irradiance, such photoinhibition (Guan and Gu 2009; Osmond and Grace 1995). This alteration of PR
of photodamage and photooxidative stress in chloroplasts (Bonifacio et al. 2011; Silva et al. 2010). Furthermore,
P. aquatica plantshad higher concentration of Chl a and b
in phase II compared to S. foetida. Chlorophyll also could act as alternative electron drain promoting photoprotection of photosynthetic machinery combined with PR and NPQ.
Light adaptation involves both structural and functional differences, as adaptation of pigment levels (Lichtenthaler 2007; Urban et al. 2007). In most cases, these traits promote advantages to light interceptions and would support photosynthetic machinery activity (Lichtenthaler et al. 2013).
Foliar anatomical aspects also revealed strategies used by species, which may have influenced gas exchange directly (Yang et al. 2014). P. aquatica plants showed the highest values in palisade and spongy parenchyma and mesophyll thickness in both irradiances, followed by S. foetida under full-light irradiance. Furthermore, full-light irradiance stimulated higher epidermal cell density on the adaxial and abaxial surface of P. aquatica and S. foetida plants, respectively. Parenchyma and mesophyll thickness are crucial for providing more space to chloroplasts position (Terashima et al. 2001). Thus, mesophyll thickness is very important to achieve high A values under different light availability (Oguchi et al. 2003).
Other traits with influence on gas exchange are stomatal density and stomatal index which varied between light treatments, being higher under full-light treatment in
P. aquatica plants. Stomatal development can be affected by several environmental variables; stomatal index of dicot plants increased with light intensity (Lake et al. 2001; Schoch et al. 1980). Indeed, stomatal densities are higher in plants grown under full sunlight or high light intensities than those in plants grown under low light irradiance (Willmer and Fricker 1996). We observed such a behavior only in P. aquatica plants. Thus, leaf morphological traits, including stomatal density and distribution, may affect gas exchange and relationships with environmental factors, such as light intensity (Nilson and Assmann 2007).
Coefficient of variation (CV) analysis can be a useful tool for exploring phenotypic variability and alternative to estimate phenotypic plasticity (Valladares et al. 2006). Higher CV values correspond to greater trait variability, allowing a practical measure of relative phenotypic variation as an indicator of plasticity. Phenotypic variability showed that both species changed all physiological and anatomical attributes. In this study, physiological attributes showed
greater variation compared to anatomic attributes (Table 3).
P. aquatica plants increased variability in the same physiological attributes in both phases of light exposure, such as photosynthesis, while S. foetida had reduced variability in phase II, mainly in photochemical attributes. This distinct behaviour shows that degrees of response could modify over a long period of exposure to different irradiances in this species. Increased variability of P. aquatica at phase II reduced differences between treatments, especially photosynthesis, indicating this species acclimatization. Reduced variability ofphotochemical attributes in S. foetida suggests this species already acclimated in terms of photosynthetic machinery to different light conditions over short exposure time to different irradiances. Results indicated that both species had different plastic responses under a long time of exposure to different light conditions.
Therefore, our initial hypothesis was partly corroborated. Some attributes, more variable in phase I, occurred in both species in phase II, such as gs and NPQ in P. aquatica and gs,
Fq'/Fm', qP and NPQ in S. foetida. Furthermore, both species
exhibited plastic responses in the same attributes in both phases. Fq'/Fm', gs, NPQ and qP varied in both species in phase
I, while Fq'/Fm', qP and Fo, and stomatal density as stomatal
index were observed in phase II (Table 3). Furthermore, the high phenotypic variability was important to initial acclimation to light conditions. However, after some time, a reduction of this variability may occur, indicating acclimatization, as observed in S. foetida in some attributes in phase II.
CONCLUSION
ORCID IDs
S. Pereira
https://orcid.org/0000-0003-0966-1246
G. Frosi
http://orcid.org/0000-0003-2538-4787
M. T. Oliveira
http://orcid.org/0000-0001-9706-5625
B. M. Lustosa
https://orcid.org/0000-0002-8313-5060
E. P. Arruda
https://orcid.org/0000-0002-1422-2486
M. G. Santos
http://orcid.org/0000-0001-5146-4591
REFERENCES
Baker, N. R. (2008). Chlorophyll fluorescence: a probe of photosynthesis in vivo. Annual Review of Plant Biology, 59, 89-113.
http://dx.doi.org/10.1146/annurev.arplant.59.032607.092759.
Bonifacio, A., Martins, M. O., Ribeiro, C. W., Fontenele, A. V., Carvalho, F. E. L., Margis- Pinheiro, M. and Silveira, J. A. G. (2011). Role of peroxidases in the compensation of cytosolic ascorbate peroxidase knockdown in rice plants under abiotic stress. Plant, Cell & Environment, 34, 1705-1722. http://dx.doi.
org/10.1111/j.1365-3040.2011.02366.x.
Campbell, G. S. and Norman, J. M. (1998). An introduction to environmental biophysics. New York: Springer-Verlag.
Franco, A. C. and Lüttge, U. (2002). Midday depression in savanna trees: coordinated adjustments in photochemical efficiency, photorespiration, CO2 assimilation and water use efficiency. Oecologia, 131, 356-365. http://dx.doi.org/10.1007/
s00442-002-0903-y.
Franklin, G. L. (1945). Preparation of thin sections of synthetic resins and wood-resin composites, and a new macerating method for wood. Nature, 155, 51. http://dx.doi.org/10.1038/155051a0.
Frosi, G., Harand, W., Oliveira, M. T., Pereira, S., Cabral, S. P., Montenegro, A. A. A. and Santos, M. G. (2017). Different physiological responses under drought stress result in different recovery abilities of two tropical woody evergreen species. Acta Botanica Brasilica, 31, 153-160. http://dx.doi.
org/10.1590/0102-33062016abb0375.
Frosi, G., Oliveira, M. T., Almeida-Cortez, J. and Santos, M.G. (2013). Ecophysiological performance of Calotropis
procera: an exotic and evergreen species in Caatinga, Brazilian semiarid. Acta Physiologie Plantarum, 35, 335-344. http://
dx.doi.org/10.1007/s11738-012-1076-x.
Guan, X. and Gu, S. (2009). Photorespiration and photoprotection of grapevine (Vitis vinifera L. cv. Cabernet Sauvignon) under waters tress. Photosynthetica, 47, 37-44. http://dx.doi.
org/10.1007/s11099-009-0067-7.
Hallik, L., Niinemets, Ü. and Kull, O. (2012). Photosynthetic acclimation to light in woody and herbaceous species: a comparison of leaf structure, pigment content and chlorophyll fluorescence characteristics measured in the field. Plant Biology, 14, 88-99. http://dx.doi.org/10.1111/j.1438-8677.2011.00472.x.
Kitao, M., Hida, T., Eguchi, N., Tobita, H., Utsugi, H., Uemura, A., Kitaoka, S. and Koike, T. (2016). Light compensation points in shade-grown seedlings of deciduous broadleaf tree species with different successional traits raised under elevated CO2. Plant Biology, 18, 22-27. http://dx.doi.org/10.1111/plb.12400.
Lake, J. A., Quick, W. P., Beerling, D. J. and Woodward, E. I. (2001). Plant development. Signals from mature to new leaves. Nature, 411, 154. http://dx.doi.org/10.1038/35075660.
Lichtenthaler, H. K. (2007). Biosynthesis, accumulation and emission of carotenoids, a-tocopherol, plastoquinone and isoprene in leaves under high photosynthetic irradiance. Photosynthesis Research, 92, 163-179. http://dx.doi.
org/10.1007/s.11120-007-9204-y.
Lichtenthaler, H. K., Babani, F., Navrátil, M. andBuschmann, C. (2013). Chlorophyll kinetics, photosynthetic activity, and pigment composition of blue-shade and half-shade leaves as compared to sun and shade leaves of different trees. Photosynthesis Research, 177, 355-366. http://dx.doi.org/10.1007/s11120-013-9834-1.
Long, S. P., Postl, W. F. and Bolhdr-Nordenkampf, H. R. (1993). Quantum yields for uptake of carbon dioxide in C3 vascular plants of contrasting habitats and taxonomic groupings. Planta, 189, 226-234. http://dx.doi.org/10.1007/BF00195081.
Lustosa, B. M., Souza, L. G. F., Frosi, G., Falcão, H. M., Pereira, S., Oliveira, M. T. and Santos, M. G. (2017). Strategies of two tropical woody species to tolerate salt stress. Brazilian Journal of Forestry Research, 37, 63-72. http://dx.doi.org/10.4336/2017.
pfb.37.89.1332.
Meli P. and Carrasco-Carballido V. (2008). Environmental Restoration in a Tropical Rainforest in Mexico. Ecological Restoration, 26, 294-295. http://dx.doi.org/10.3368/er.26.4.294.
Nilson S. E. and Assmann S. M. (2007). The control of transpiration. Insights from Arabidopsis. Plant Physiology, 143, 19-27. http://dx.doi.org/10.1104/pp.106.093161.
Oguchi, R., Hikosaka, K. and Hirose, T. (2003). Does the photosynthetic light-acclimation need change in leaf anatomy? Plant, Cell & Environment, 26, 505-512. http://
dx.doi.org/10.1046/j.1365-3040.2003.00981.x.
Oliveira, J. T. A., Vasconcelos, I. M., Bezerra, L. C. N. M., Silveira, S. B., Monteiro, A. C. O. and Moreira, R.A. (2000).Composition and nutritional properties of seeds from Pachira aquatica
Aubl, Sterculia striata St Hil et Naud and Terminalia catappa
Linn. Food Chemistry, 70, 185-191. http://dx.doi.org/10.1016/
S0308-8416(00)00076-5.
Oliveira, M. T., Dias, C. M., Frosi, G. and Santos, M. G. (2014). Different mechanisms drive the performance of native and invasive woody species in response to leaf phosphorus supply during periods of drought stress and recovery. Plant Physiology and Biochemistry, 82, 62-75. http://dx.doi.org/10.1016/j.
plaphy.2014.05.006.
Osmond, C.B. and Grace, S.C. (1995). Perspectives on photoinhibition and photorespiration in the field: quintessential inefficiencies of the light and dark reactions of photosynthesis? Journal of Experimental Botany, 46, 1351-1362. https://doi.
org/10.1093/jxb/46.special_issue.1351.
Prado, C. H. B. A. and Moraes, J. A. P. V. (1997). Photosynthetic capacity and specific leaf mass in twenty woody species of Cerrado vegetation under field conditions. Photosynthetica, 33, 103-112. http://dx.doi.org/10.1023/A:1022183423630.
Peixoto, A. L. and Escudeiro, A. (2002). Pachira quática
(Bombacaceae) na obra “História dos animais e árvores do Maranhão” de Frei Cristóvão de Lisboa. Rodriguésia, 53, 123-130.
Purvis, M., Collier, D. and Walls, D. (1964). Laboratory techniques in botany. London: Butterworths.
Salisbury, E. J. (1928). On the causes and ecological significance of stomatal frequency, with special reference to the woodland flora. Philosophical Transactions of the Royal Society of London, 216, 1-65.
Santos T. O., Morais T. G. O. and Matos V. P (2004). Escarificação mecânica em sementes de chihá (Sterculia foetida L.). Revista Árvore, 28, 1-6.
Schoch, P. G., Zinsou, C. and Sibi, M. (1980). Dependence of the stomatal index on environmental factors during stomatal differentiation in leaves of Vigna sinensis L.: 1. Effect of light intensity. Journal of Experimental Botany, 31, 1211-1216.
Silva, E. N., Ferreira-Silva, S. L., Fontenele, A. V., Ribeiro, R. V., Viégas, R. A. and Silveira, J. A. G. (2010). Photosynthetic changes and protective mechanisms against oxidative damage subjected to isolated and combined drought and heat stresses in Jatropha curcas plants. Journal of Plant Physiology, 167, 1157-1164.http://dx.doi.org/10.1016/j.jplph.2010.03.005.
Silva, E. N., Silveira, J. A. G., Ribeiro, R. V. and Vieira, A. S. (2015). Photoprotective function of energy dissipation by thermal processes and photorespiratory mechanisms in
Jatropha curcas plants during different intensities of drought and after recovery. Environmental and Experimental Botany, 110, 36-45. http://dx.doi.org/10.1016/j.envexpbot.2014.09.008.
Terashima, I., Miyazawa, S.I. and Hanba, Y. T. (2001). Why are sun leaves thicker than shade leaves? Consideration based on analyses of CO2 diffusion in the leaf. Journal of Plant Research, 114, 93-105. http://dx.doi.org/10.1007/PL00013972.
Urban, O., Koscvancova, M., Marek, M. V. and Lichtenthaler, H. K. (2007). Induction of photosynthesis and importance of limitations during the induction phase in sun and shade leaves of five tree species from the temperate zone. Tree Physiology, 27, 1207-1215.
Valladares, F., Sanchez-Gomez, D. and Zavala, M. A. (2006). Quantitative estimation of phenotypic plasticity: bridging the gap between the evolutionary concept and its ecological applications. Journal of Ecology, 94, 1103-1116. http://dx.doi.
org/10.1111/j.1365-2745.2006.01176.x.
Vipunngeun, N. and Palanuvej, C. (2009). Fatty acids of Sterculia foetida seed oil. Journal of Health Research, 23, 157.
Willmer, C. and Fricker, M. (1996). Stomata, 2. ed., Chapman & Hall, London