Differential expression of the
KLK2
and
KLK3
genes in peripheral blood
and tissues of patients with prostate cancer
Juliana Meola
1, Luiz R. Goulart
1, Jaqueline D.D. Oliveira
1, Adriana F. Neves
1, Waldesse P. Oliveira Jr.
1,
Ana C.M. Saraiva
1, Andréia C. Capaneli
1, Alexandra M. Cardoso
1, Lindolfo D. Prado
2,
Sebastião A. Borba
2and Heyder D. Silva
31
Universidade Federal de Uberlândia, Instituto de Genética e Bioquímica, Uberlândia,
Minas Gerais, Brazil.
2
Universidade Federal de Uberlândia,Escola de Medicina, Uberlândia, Minas Gerais, Brazil.
3Universidade Federal de Uberlândia, Instituto de Matemática, Uberlândia, Minas Gerais, Brazil.
Abstract
We used the multiplex semi-quantitative reverse-transcriptase PCR (RT-PCR) to investigate kallikrein 2 and 3 (KLK2
andKLK3) mRNA levels in prostate tissue from 42 prostate cancer patients, 33 of whom were also assessed for
pe-ripheral bloodKLK2expression by qualitative semi-nested RT-PCR. We found thatKLK2was an important tissue
biomarker for distinguishing between prostate cancer patients and those with benign prostatic hyperplasia, particu-larly whenKLK2expression was > 60% of that of theβ2-microglobulin constitutive gene. Patients with an average
relative expression value≥0.6 (cutoff value) had an eleven-fold higher chance of having prostate cancer. When one or two tissues samples were evaluated forKLK2expression using the cutoff value the estimated chance of having
prostate cancer was increased by seven times for one positive sample and 45 times for two positive samples. There was no significant correlation betweenKLK3gene expression and prostate cancer diagnosis. Logistic regression for
blood and tissueKLK2expression successfully detected 92% of the prostate cancer cases. The detection ofKLK2in
blood showed a sensitivity of 59% and a specificity of 82%. This study indicates that theKLK2gene may be a useful
molecular marker for the diagnosis of prostate cancer and that analysis ofKLK2expression in blood and tissues
could provide a novel approach for the clinical investigation of this type of cancer.
Key words:kallikrein II, molecular markers, prostate cancer, PSA, semi-quantitative RT-PCR. Received: April 25, 2005; Accepted: September 21, 2005.
Introduction
Prostate cancer (PCa) has become one of the most common diseases among elderly men. Prostate-specific antigen (PSA) is a glycoprotein found in normal, hyper-plasic and tumoral prostate tissues, seminal liquid and the blood of patients with prostate cancer (Wanget al., 1979). Although PSA is not exclusive to the prostate (Diamandis and Yu, 1997), extra-prostatic protein has little or no interference on the clinical analysis of pros-tate cancer (Rittennhouseet al., 1998).
As with PSA, high levels of the prostatic kallikrein hK2 have also been found only in the prostate (Blacket al., 2000) and Lyonet al.(1995) have associated hK2
ac-tivity with prostate cancer invasion and metastasis. In ad-dition, hK2 shows physiological synergism in the regulation of PSA activation through its ability to con-vert the pre-PSA form into mature PSA (Takayamaet al., 1997).
The search for molecular markers that could be used for the early diagnosis of prostate cancer has be-come one of the most important objectives in clinical in-vestigation, particularly because the current methods are invasive, show low specificity and require additional procedures for therapeutic decisions. During the work described in this paper we examined the expression of the KLK2 and KLK3 genes in prostate tissue and the expression of theKLK2gene in the peripheral blood of patients diagnosed with prostate cancer and benign pros-tatic hyperplasia (BPH) and assessed the potential use of these genes as biomarkers in the clinical diagnosis of prostate cancer.
www.sbg.org.br
Send correspondence to Luiz Ricardo Goulart. Universidade Fede-ral de Uberlandia, Instituto de Genética e Bioquímica, Laboratório de Genética Molecular, Campus Umuarama, Bloco 2E, Sala 24, 38400-902 Uberlandia, MG, Brazil. E-mail: [email protected].
Patients and Methods
Patients, sampling and clinical classification
This study was carried out in 2002 to 2003 in the Mo-lecular Genetics Laboratory of the Federal University of Uberlândia (UFU), in collaboration with the Urology Ser-vice of the University Hospital and was approved by the UFU Ethics Research Committee (protocol number 005/2001) which included informed consent by the pa-tients. Forty-two patients (median age 69, range 49 to 87 years) were assessed by two pathologists and histologically classified as follows: 14 with BPH, 15 with organ-confined prostate cancer (pT1a to pT2c), and 13 with extra-capsular invasion prostate cancer (pT3a to pT4b) that will be consid-ered for analysis purposes as a metastatic group. Patients presenting prostate intraepithelial neoplasia (PIN) and/or prostatitis were excluded from the investigation. Most BPH patients were submitted to transurethral resection of the prostate (TURP), the exception being 2 patients that under-went open prostatectomy. All prostate cancer patients were submitted to radical prostatectomy after being selected based on the following criteria: Gleason score for the bi-opsy of less than 8, negative X-rays and bone scan analyses and a rectal examination compatible with organ confined cancer. Two samples of fresh prostate tissue from different regions of the organ of each patient were carefully selected using histological examination to investigate KLK2 and KLK3genes expression levels. In 11 BPH and 22 prostate cancer patients, a peripheral blood sample was collected before surgery. Sera total PSA (tPSA) concentrations were detected using the IMMULITE® chemiluminescent immunoassay system (Diagnostic Product Corporation, Los Angeles, USA).
Total RNA extraction and reverse transcription
Total RNA was extracted from peripheral blood leu-kocytes and macerated prostate tissue using the Trizol reagent according to the manufacturer’s instructions (Invitrogen, Inc.). Reverse transcription (RT) was accom-plished by adding 1µg of total RNA from the individual blood or tissue samples to a final volume of 20µL (com-pleted with diethylpyrocarbonate (DEPC) treated water) containing 10 units of RNase inhibitor, 40 units of MMLV reverse transcriptase (RT), 1x MMLV-RT buffer, 200µM of each dNTP and 6µM of random hexamer primers and the solution incubated at 37 °C for 1 h and then 95 °C for 5 min.
Multiplex semi-quantitative RT-PCR of the prostate tissue samples
The cDNA was PCR co-amplified using two different primer pairs for the target genes, according to their Gen-Bank accession sequence numbers. For theKLK2gene (ac-cession number AF1188747) the primers were: sense 5’-CAGCATCGAACCAGAGGAGT-3’, nucleotide
posi-tion 490-509, and antisense 5’-ACTAGAGGTAGGGG TGGGAC-3’, nucleotide position 810-829. For theKLK3 gene (accession number X05332) the primers were: sense 5’-TCCAATGACGTGTGTGCGCA-3’, nucleotide posi-tion 581-600, and antisense 5’-CCTTGATCCACTTCCG GTAA-3’, nucleotide position 787-806. The constitutive beta2-microglobulin gene (β-2M): 5’-AGCAGAGAATG GAAAGTCAAA-3’ and 5’-TGTTGATGTTGGATAAG AGAA-3’) was used as an internal positive control to nor-malize the products of the amplification reactions. To check for genomic DNA contamination PCR reactions were also performed using total RNA as template, but no amplification was observed demonstrating that the samples had no contaminant genomic DNA. Additionally, primers were designed for selective amplification of RNA, in which both primer ends (5’ and 3’) belonged to two adjacent exons.
Amplification was carried out by adding 2µL of pri-mary cDNA to a 25µL PCR mixture consisting of 200µM of each dNTP, 0.4µM of the primer pair for KLK2 or KLK3, 0.96 µM of the primer pair for β-2M, 2.0 mM MgCl2, 1.5 unit of Taq DNA polymerase and 1x buffer.
The reactions were incubated at 95 °C for 3 min, followed by 29 cycles at 95 °C for 30 s, 59 °C for 40 s and 72 °C for 40 s, with a final extension of 10 min at 72 °C. The ideal number of PCR cycles (29) was determined when the co-amplification of both genes reached the exponential phase.
Semi-nested RT-PCR of peripheral blood
For these amplifications 2µL of cDNA was added to a 25µL PCR mixture containing 200µM of each dNTP, 0.4 mM of the same primer pair used to amplifyKLK2in the tissue samples, 1.5 mM MgCl2, 1.5 units of Taq DNA
polymerase and 1x buffer. The reaction conditions con-sisted of 95 °C for 3 min, followed by 25 cycles at 95 °C for 30 s, 66 °C for 40 s and 72 °C for 40 s, with a final extension of 10 min at 72 °C. All of the samples were co-amplified with theβ-2Mgene as described above.
In the next step, 2µL the first PCR amplification was added to a 25µL mixture containing 200µM of each dNTP, 0.4 mM of the semi-nested pair of primers for theKLK2 gene (accession number AF1188747: sense 5’-AGTTCTT GCGCCCCAGGAGT-3’, nucleotide position 507-526, and antisense 5’-ACTAGAGGTAGGGGTGGGAC-3’, nucleotide position 810-829), 1.5 mM MgCl2, 1.5 units of
Relative levels of gene expression as assessed by densitometry
TheKLK2,KLK3andβ-2Mgene amplicons obtained were analyzed and quantified based on the staining intensi-ties of the corresponding bands as assessed using the ImageMaster VDS software program, version 2.0 (Amer-sham Biosciences). The relative levels ofKLK2andKLK3 were obtained for each sample by normalizing the densito-metric readings using the ratio target mRNA/β-2MmRNA, where target mRNA represents theKLK2orKLK3values.
Statistical analysis
All the statistical analyses were performed using the Statistica 99 Edition software (Anon, 1999). Normality of the data was verified using the Shapiro-Wilk test. Logistic regression was applied to the relative mRNA levels of the blood and tissue sample in order to determine whether the target genes were able to detect prostate cancer and also to distinguish between organ confined and metastatic disease. A logistic regression of the combined blood and tissue data from the same patient was used to estimate the diagnostic value of these markers. The Kruskal-Wallis test was used to compare the relative levels of expression of both genes be-tween samples at a probability level of 5%. Pearson’s corre-lations were applied to all clinical laboratory parameters. Odds ratios were also calculated for each marker to deter-mine the chance of having prostate cancer. The accuracy (A), sensitivity (S), specificity (E), positive predictive va-lue (PPV) and negative predictive vava-lue (NPV) of both mo-lecular markers in diagnosing prostate cancer and BPH were compared with the pathological findings.
Results
The semi-quantitative analyses performed for both markers (Figure 1) in the two prostate tissues of some pa-tients have shown different mRNA expression levels, which may indicate the heterogeneous nature of the pros-tate cancer, and suggesting that tissues are under different disease stages.
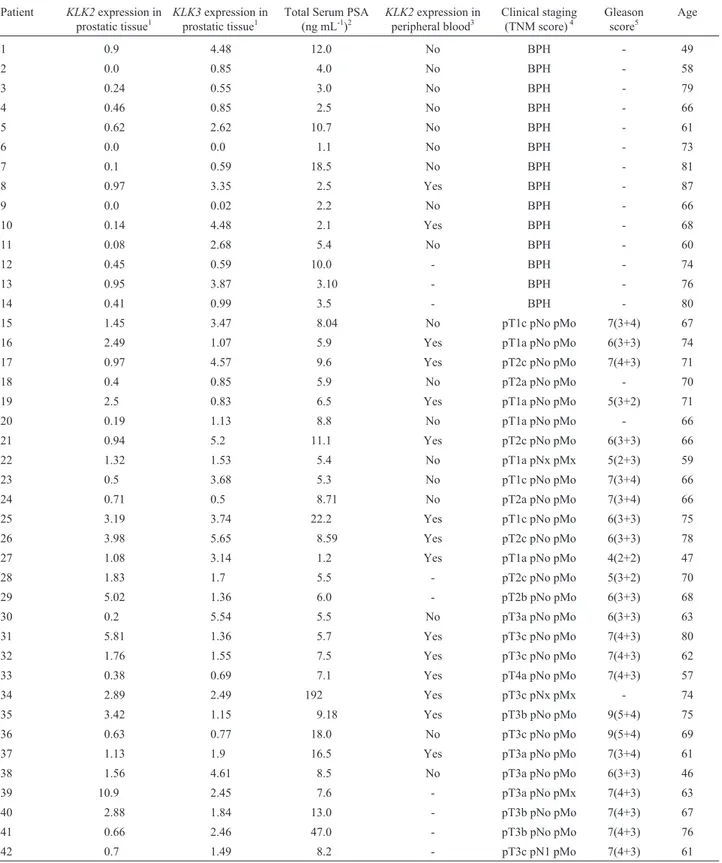
There was a significant correlation (r = 0.476; p < 0.04) between tissue and peripheral bloodKLK2 ex-pression and the clinical parameters tPSA, Gleason score, TNM (Tumor, lymph Node and Metastasis) classification and age, but theKLK3andβ-2Mmarkers showed no corre-lation. The alternative splicing form of the KLK2 gene (present as a very low intensity 378-bp band) was observed in all patients but with no differences between samples, and was therefore not included in the analysis. A significant correlation (r = 0.55; p < 0.01) was also observed between TNM classification and Gleason score (Table 1).
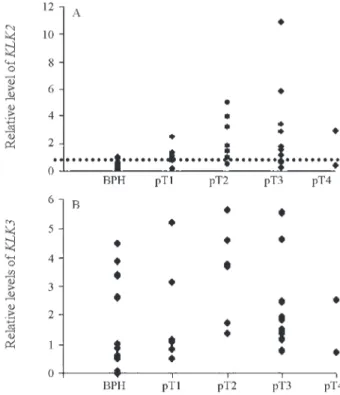
The relative expression levels of KLK2 and KLK3 (Table 1) were not normally distributed (p < 0.01) and lo-gistic regression analysis of the relative levels ofKLK2and KLK3in prostate tissue showed that onlyKLK2was a good
marker for predicting prostate cancer (KLK2, p = 0.00001; KLK3, p = 0.298). Furthermore,KLK2expression in pros-tate tissue was associated with the disease staging while KLK3expression was highly variable within stages (KLK2, p = 0.00053;KLK3, p = 0.47) (Figure 2).
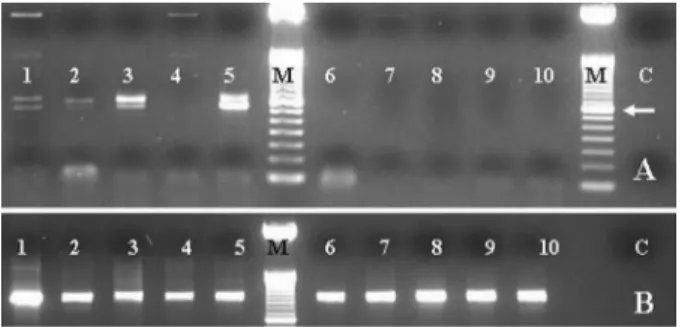
Figure 1- Semi-quantitative multiplex RT-PCR forKLK2gene expres-sion analysis of two samples of prostate tissues from patients with (A) prostate cancer (PCa) or (B) benign prostatic hyperplasia (BPH). We show the results for four PCa and five BPH patients each represented by two samples (lanes a and b) produced from tissue from independent pros-tate regions. The samples were analyzed in a multiplex reaction with a 534-bp positive fragment of theβ-2Mconstitutive gene. C = negative con-trol reaction for DNA contamination. M = 50-bp ladder molecular marker. The white arrow indicates the 341-bpKLK2gene fragment. The faint band (378 bp) over the 341-bp fragment is the alternative splicing of the
KLK2gene.
Table 1- Clinical parameters and laboratory data for expression analyses of theKLK2andKLK3genes in prostatic tissues and peripheral blood.
Patient KLK2expression in prostatic tissue1
KLK3expression in prostatic tissue1
Total Serum PSA (ng mL-1)2
KLK2expression in peripheral blood3
Clinical staging (TNM score)4
Gleason score5
Age
1 0.9 4.48 12.0 No BPH - 49
2 0.0 0.85 4.0 No BPH - 58
3 0.24 0.55 3.0 No BPH - 79
4 0.46 0.85 2.5 No BPH - 66
5 0.62 2.62 10.7 No BPH - 61
6 0.0 0.0 1.1 No BPH - 73
7 0.1 0.59 18.5 No BPH - 81
8 0.97 3.35 2.5 Yes BPH - 87
9 0.0 0.02 2.2 No BPH - 66
10 0.14 4.48 2.1 Yes BPH - 68
11 0.08 2.68 5.4 No BPH - 60
12 0.45 0.59 10.0 - BPH - 74
13 0.95 3.87 3.10 - BPH - 76
14 0.41 0.99 3.5 - BPH - 80
15 1.45 3.47 8.04 No pT1c pNo pMo 7(3+4) 67
16 2.49 1.07 5.9 Yes pT1a pNo pMo 6(3+3) 74
17 0.97 4.57 9.6 Yes pT2c pNo pMo 7(4+3) 71
18 0.4 0.85 5.9 No pT2a pNo pMo - 70
19 2.5 0.83 6.5 Yes pT1a pNo pMo 5(3+2) 71
20 0.19 1.13 8.8 No pT1a pNo pMo - 66
21 0.94 5.2 11.1 Yes pT2c pNo pMo 6(3+3) 66
22 1.32 1.53 5.4 No pT1a pNx pMx 5(2+3) 59
23 0.5 3.68 5.3 No pT1c pNo pMo 7(3+4) 66
24 0.71 0.5 8.71 No pT2a pNo pMo 7(3+4) 66
25 3.19 3.74 22.2 Yes pT1c pNo pMo 6(3+3) 75
26 3.98 5.65 8.59 Yes pT2c pNo pMo 6(3+3) 78
27 1.08 3.14 1.2 Yes pT1a pNo pMo 4(2+2) 47
28 1.83 1.7 5.5 - pT2c pNo pMo 5(3+2) 70
29 5.02 1.36 6.0 - pT2b pNo pMo 6(3+3) 68
30 0.2 5.54 5.5 No pT3a pNo pMo 6(3+3) 63
31 5.81 1.36 5.7 Yes pT3c pNo pMo 7(4+3) 80
32 1.76 1.55 7.5 Yes pT3c pNo pMo 7(4+3) 62
33 0.38 0.69 7.1 Yes pT4a pNo pMo 7(4+3) 57
34 2.89 2.49 192 Yes pT3c pNx pMx - 74
35 3.42 1.15 9.18 Yes pT3b pNo pMo 9(5+4) 75
36 0.63 0.77 18.0 No pT3c pNo pMo 9(5+4) 69
37 1.13 1.9 16.5 Yes pT3a pNo pMo 7(3+4) 61
38 1.56 4.61 8.5 No pT3a pNo pMo 6(3+3) 46
39 10.9 2.45 7.6 - pT3a pNo pMx 7(4+3) 63
40 2.88 1.84 13.0 - pT3b pNo pMo 7(4+3) 67
41 0.66 2.46 47.0 - pT3b pNo pMo 7(4+3) 76
42 0.7 1.49 8.2 - pT3c pN1 pMo 7(4+3) 61
As explained above, the relative levels ofKLK2and KLK3expression were obtained for each sample by nor-malizing the densitometric readings using the ratio target mRNA/β-2MmRNA, where target mRNA represents the KLK2orKLK3values. The relativeKLK2expression levels were significantly higher in prostate cancer tissues than in BPH (p = 0.0001). A cutoff value of 0.6, representing 60% of theKLK2expression in relation to theβ-2Mgene, was calculated by logistic regression and maximized the clini-cal classification of patients as having prostate cancer or BPH. Individuals with an averageKLK2gene expression level ≥ 0.6 (considered positive for prostate cancer) had eleven times (95% CIKLK2= 2.5 to 52.0) higher chance of having a tumor. The estimated chance of occurrence was seven times higher (95% CIKLK2= 1.3 to 43.0) when one tis-sue sample was independently positive, and was 45 times higher (95% CIKLK2= 4.0 to 500) when two tissue samples were independently positive forKLK2gene expression.
Of the 42 patients whose prostate tissues were screened by semi-quantitative RT-PCR, 27 were positive (four BPH, 12 organ-confined prostate cancer and 11 meta-static prostate cancer) based on aKLK2cutoff value of 0.6. The Table 2 is showing the clinical performance parame-ters (accuracy, sensitivity, specificity, positive predictive value, and negative predictive value) as calculated based on the detection limit of gene transcripts (cutoff value) in tis-sue samples.
Peripheral blood analyses showed that theKLK2and tPSA markers were reliable indicators (KLK2, p = 0.02; tPSA, p = 0.01) of prostate cancer as compared to BPH (Figure 3).
Since the peripheral blood levels of KLK2 mRNA were higher in patients with prostate cancer than those with BPH, we standardized the semi-nested RT-PCR cycles to detectKLK2 expression in the circulating blood cells of most prostate cancer patients. Of 33 blood samples ana-lyzed, 15 gave a positive reaction (two BPH, 7
organ-confined prostate cancer and 6 metastatic prostate cancer). Based on the TNM disease stage, the frequency of false negatives was 50% for the pT1 stage (four patients), 40% for pT2 (two patients), 37.5% for pT3 (three patients) and 0% for pT4.
The detection ofKLK2mRNA in the circulation was associated with a 6.5-fold greater chance of having prostate cancer (95% CIKLK21.12 to 37.48). The qualitative results ofKLK2detection in peripheral blood were also analyzed to determine its clinical performance (Table 2).
Logistic regression of the combined results forKLK2 expression in blood and tissue samples from prostate can-cer and BPH patients successfully identified 92% of all prostate cancer cases, with 59% being true positive blood samples and 33% true positive biopsy samples. Of the 41% false negative blood samples, 79% were correctly identi-fied using the same biomarker in prostate tissue (PPV = 87%).
Discussion
To determine the potential usefulness ofKLK2and KLK3as biomarkers in the diagnosis of prostate cancer we used multiplex semi-quantitative RT-PCR to detect mRNA in prostate tissues and semi-nested RT-PCR to detect mRNA in peripheral blood cells. The use of hexamer prim-ers allowed normalization of the RNA amplification prod-ucts and ensured that there were corrections for variation between reactions.
It is important to emphasize that quantitative analysis of mRNA can be achieved by several RT-PCR approaches, which can be divided into comparative and absolute quanti-tative PCR (Q-PCR), both of which can use either competi-tive PCR or real time PCR with fluorescent probes/primers. Competition assays can be used to compare expression lev-els of the same gene in different samples, while the absolute Q-PCR technologies can use standard curves to estimate the specific amount of a specific target (Rose’ Meyeret al., 2003). Determination of cycle threshold (CT) in real time thermocyclers uses a similar approach to that used in semi-quantitative analysis in conventional multiplex PCR, for which values are calculated based on an endogenous stan-dard which is usually a housekeeping gene such as the
Table 2- Calculation of clinical performance parameters of total serum prostate-specific antigen (tPSA) and the molecular markersKLK2and
KLK3 in peripheral blood and prostate tissues for prostate cancer diagnostics.
Clinical performance parameters
KLK2tissue KLK2blood KLK3tissue
Accuracy 79% 67% 74%
Sensitivity 82% 59% 82%
Specificity 71% 82% 57%
Positive predictive value 85% 87% 79%
Negative predictive value 67% 50% 62%
Figure 3- Expression ofKLK2andβ-2 microglobulin (β-2M)mRNA in peripheral blood of prostate cancer and benign prostatic hyperplasia (BPH) patients. A: semi-nested RT-PCR forKLK2gene expression. Col-umns 1 to 5 represent prostate cancer patients, and colCol-umns 6 to 10 are BPH patients. M = 50-bp ladder (molecular marker) and the arrow a 350-bp marker. C = negative control reaction (without template). The
β-2M gene. The use of this endogenous standard in the RT-PCR assay provides a direct comparison between mul-tiple samples and has several other advantages. Firstly, its detection after RT and PCR indicates the success of these two steps. Secondly, the amount of cDNA corresponding to the endogenous marker is an indicator of the degree of deg-radation and purity of the sample. Thirdly, the internal con-trol compensates for the inherent inter-assay variability of RT-PCR. In fact due to the exponential nature of PCR, a small variation in amplification efficiency dramatically af-fects the yield of amplification product (Pernas-Alonsoet al., 1999).
It has been shown that results of absolute Q-PCR data analysis have validated the results of comparative data analysis that used an internal control, which means, the copy number of mRNA molecules correlated significantly with comparative data. Therefore, a comparative analysis is an adequate and consistent procedure to investigate gene expression levels and is not dependent upon absolute levels of expression (Rose’ Meyeret al., 2003).
In selecting a technique or biomarker to analyze a molecular event, it is essential to know of the existence of post-transcriptional or post-translational alterations (Favre et al., 1997). An understanding of these events is an impor-tant step in the selection of potential biomarkers for the early diagnosis of prostate cancer and for disease staging by looking for differential gene expression during tumor de-velopment.
We found thatKLK2mRNA expression was greater in prostate cancer tissue compared to BPH tissue, whereas there were no differences inKLK3expression. Indeed, the detection ofKLK3gene expression in prostatic tissue is a controversial issue, with the levels being greater in benign than in malignant tissue (Magklaraet al., 2000; Herralaet al., 2001). However, lowKLK3expression in tumoral tis-sues may be associated with the development of more ag-gressive tumors (Stege et al., 2000), while others have found no differences inKLK3gene expression in prostate cancer and BPH tissues (Henttuet al., 1990). Larger con-centrations of PSA have been observed in tumor tissues compared to BPH tissues, based on immunohistochemical analyzes using monoclonal and polyclonal antibodies (Dar-sonet al., 1999).
The expression ofKLK2is also a matter of contro-versy, with some authors (Herralaet al., 1998; Herralaet al., 2001) having conducted immunohistochemical studies which detected overexpression of theKLK2gene in pros-tate cancer, while, in contrast, Magklaraet al. (2000) re-portedKLK2expression to be higher in BPH as compared to prostate cancer, whereas Henttuet al.(1990) found no differences inKLK2expression between BPH and prostate cancer. Such discrepancies between results are most likely to be due to a variety of factors, including different antibod-ies being used in different studantibod-ies, variation in the
technolo-gies and equipment used and the operators, and the heterogeneous nature of the cancer and tissues.
We found that the 0.6 cutoff forKLK2tissue expres-sion efficiently distinguished prostate cancer from BPH, with the chance of a reliable clinical diagnosis being greater as the amount of tissue used increased.
The tissue samples used by us were obtained during radical prostatectomy and not from biopsies, hence it is possible that gene expression was underestimated since the tissues were not obtained by microdissection. However, this does not invalidate the clinical use ofKLK2as a marker since tumors are generally heterogeneous and multifocal, and microdissection would not provide a very representa-tive histological analysis.
As shown in this paper, peripheral blood can be used instead of tissue samples in preliminary analysis. Since the KLK2andKLK3genes occur almost exclusively in pros-tatic epithelial cells (Rittennhouseet al., 1998), any release of these cells into the circulation as a result of glandular re-arrangements can be detected by the sensitive methods de-scribed here. The greater the tissue trauma, the greater the number of prostatic cells released into the blood.
However, false negatives can also be observed, and a possible explanation for this result in peripheral blood could be that, in the early stages of the tumor, malignant cells may be masked by the greater number of normal cells released into the circulation, thereby apparently diminish-ing the levels ofKLK2expression. On the other hand, in more advanced tumors, some cell lines may be transformed from being hormonal dependent to being hormonal inde-pendent, thus inhibitingKLK2andKLK3expression. This could explain the overexpression of these genes in prostate dependent tumor cells compared to androgen-independent cells (Blacket al., 2000; Vaaralaet al., 2000).
Serum total PSA values of < 4 ng mL-1do not guaran-tee the absence of tumors since 22% of patients with or-gan-confined disease have tPSA values below this level (Catalonaet al., 1997). In addition, the 4 ng mL-1 cutoff limit for tPSA used as an indicator for a prostate biopsy pro-cedure has been shown in the literature to have a positive predictive value of 31 to 54% (Brawer and Kirby, 1998). In our data, theKLK2biomarker in blood had a positive pre-dictive value of 87%, suggesting that our proposed proce-dure would prevent unnecessary biopsies by reducing from 46% to 13%.
The lack of agreement between the pathological find-ings andKLK2detection may reflect the fact that prostate cancer is multifocal and multifactorial, and that different KLK2 expression patterns may exist in different pheno-types and clinical stages of the disease.
We propose the use of theKLK2biomarker in blood, together with the quantification of serum tPSA levels, in or-der to improve the investigation of the clinical status of pa-tients. Further studies should be carried on to demonstrate its true value as marker for disease staging.
Acknowledgments
The authors thank the Urology Division of the Uni-versity Hospital of Uberlândia for providing the biological samples.
References
Anon (1999) Statistica 99 Edition. Statistica for Windows (Com-puter program manual). Kernel release 5.5 A. Tulsa, OK. StatSoft Inc.
Black MA, Magklara A, Obiezu C, Levesque MA, Sutherland DJA, Tindall DJ, Young CYF, Sauter ER and Diamandis EP (2000) Expression of a prostate-associated protein human glandular kallikrein (hK2), in breast tumors and in normal breast secretions. Br J Cancer 82:361-367.
Brawer MK and Kirby R (1998) Prostate specific antigen. In: Brawer MK and Kirby R (eds) Prostate Specific Antigen. 2nd ed. Abingdon, Health Press Limited, pp 30-35. Catalona WJ, Smith DS and Ornstein DK (1997) Prostate cancer
detection in men with serum PSA concentrations of 2.6 to 4.0 ng/mL and benign prostate examination: Enhancement of specificity with free PSA measurements. JAMA 277:1452-1455.
Darson MF, Pacelli A, Roche P, Rittenhouse HG, Wolfert RL, Saeid MS, Young CYF, Klee GG, Tindall DJ and Bostwick DG (1999) Human glandular kallikrein 2 expression in pros-tate adenocarcinoma and lymph node metastases. Urology 53:939-944.
Diamandis EP and Yu H (1997) Nonprostatic sources of pros-tate-specific antigen. Urol Clin N Am 2:275-282.
Diamandis EP, Yousef GM, Luo LY, Magklara A and Obiezu CV (2000) The new human kallikrein gene family: Implications in carcinogenesis. Trends Endocrinol Metab 11:54-60. Favre N, Bordmann G and Rudin W (1997) Comparison of
cyto-kine measurements using ELISA, ELISPOT and RT-PCR. J Immunol Methods 204:57-66.
Henttu P, Lukkarinen O and Vihko P(1990) Expression of the gene coding for human prostate-specific antigen and related hGK-1 in benign and malignant tumors of the human pros-tate. Int J Cancer 45:654-660.
Herrala A, Kurkela R, Vihinen M, Kalkkinen N and Vihko P (1998) Androgen-sensitive human prostate cancer cells, LNCaP, produce both N-terminally mature and truncated prostate-specific antigen isoforms. Eur J Biochem 255:329-235.
Herrala AM, Porvari KS, Kyllönen AP and Vihko PT (2001) Comparison of human prostate specific glandular kallikrein 2 and prostate-specific antigen gene expression in prostate with gene amplification and overexpression of prostate spe-cific glandular kallikrein 2 in tumor tissue. Cancer 92:2975-2984.
Lyon PB, See WA, Xu Y and Cohen MB (1995) Diversity and modulation of plasminogen activator activity in human pros-tate carcinoma cell lines. Prospros-tate 27:179-186.
Magklara A, Scorilas A, Stepha C, Kristiansen GO, Hauptmann S, Jung K and Diamandis EP (2000) Decreased concentrations of prostate-specific antigen and human glandular kallikrein 2 in malignant vs.nonmalignant prostatic tissue. Urology 56:527-532.
Pernas-Alonso R, Morelli F, Porzio U and Perrone-Capano C (1999) Multiplex semi-quantitative reverse transcriptase-polymerase chain reaction of low abundance neuronal mRNAs. Brain Research Protocols 4:395-406.
Rittennhouse HG, Finlay JA, Mikolajczyk SD and Partin AW (1998) Human kallikrein 2 (hK2) and prostate-specific anti-gen (PSA): Two closely related, but distinct, kallikreins in the prostate. Crit Rev Clin Lab Sci 35:275-368.
Rose’ Meyer RB, Mellick AS, Garnham BG, Harrison GJ, Massa HM and Griffiths LR (2003) The measurement of adenosine and estrogen receptor expression in rat brains following ovariectomy using quantitative PCR analysis. Brain Re-search Protocols 11:9-18.
Stege R, Grande M, Carlstrom K, Tribukait B and Pousette A (2000) Prognostic significance of tissue prostate-specific antigen in endocrine-treated prostate carcinomas. Clin Can-cer Res 6:160-165.
Takayama TK, Fujikawa K and Davie EW (1997) Characteriza-tion of the precursor of prostate-specific antigen: ActivaCharacteriza-tion by trypsin and by human glandular kallikrein. J Biol Chem 272:21582-21588.
Vaarala MH, Porvari K, Kyllönen AP and Vihko P (2000) Differ-entially expressed genes in two LNCaP prostate cancer cell lines reflecting changes during prostate cancer progression. Lab Invest 8:1259-1268.
Wang MC, Valenzuela LA, Murphy GP and Chu TM (1979) Puri-fication of a human prostate-specific antigen. Invest Urol 17:159-163.