Kallikrein-2 Gene (KLK2) with Susceptibility of Prostate
Cancer: A Meta-Analysis
Lishan Wang1,2., Weidong Zang2., Yunxia Sang3., Dongli Xie2
, Li Wei2, Weidong Ji1,4,5, Yaosheng Pan1,4,5, Zhiqiang Li1, Jiawei Shen1, Yongyong Shi1,4,5*
1Bio-X Institutes, Key Laboratory for the Genetics of Developmental and Neuropsychiatric Disorders (Ministry of Education), Shanghai Jiao Tong University, Shanghai, P.R. China,2FengHe (ShangHai) Information Technology Co., Ltd, Shanghai, P.R. China,3College of Pharmacy, Shanghai Jiao Tong University, Shanghai, P.R. China,4Shanghai Changning Mental Health Center, Shanghai, P.R. China,5Institute of Neuropsychiatric Science and Systems Biological Medicine, Shanghai Jiao Tong University, Shanghai, P.R. China
Abstract
Objectives:To assess the association of polymorphism rs198977 in the human kallikrein-2 gene (KLK2) and risk of prostate cancer (PCa).
Methods:Two investigators independently searched the PubMed, Elsevier, EMBASE, Web of Science, Wiley Online Library and Chinese National Knowledge Infrastructure (CNKI). Pooled odds ratios (ORs) and 95% confidence intervals (95% CIs) for rs198977 and PCa were calculated in a fixed-effects model (the Mantel-Haenszel method) and a random-effects model (the DerSimonian and Laird method) when appropriate.
Results: Six studies met the inclusion criteria in this meta-analysis, which included 5859 PCa cases and 4867 controls. Overall, rs198977 was associated with the PCa risk (TT+CT vs. CC, pooled OR = 1.163, 95% CI = 1.076–1.258, P-value,0.0001). When stratified by ethnicity, significant association was observed in Caucasian samples under both allele comparison (T vs. C, pooled OR = 1.152, 95% CI = 1.079–1.229, P-value,0.0001) and dominant model (TT+CT vs. CC, pooled OR = 1.197, 95%
CI = 1.104–1.297, P-value,0.0001). In the overall analysis, a comparably significant increase in the frequency of allele T for rs198977 was detected between cases and controls in Caucasian.
Conclusion:This meta-analysis suggests that rs198977 of KLK2 was associated with susceptibility of PCa in Caucasian and the allele T might increase the risk of PCa in Caucasian.
Citation:Wang L, Zang W, Sang Y, Xie D, Wei L, et al. (2013) Association of Polymorphism rs198977 in Human Kallikrein-2 Gene (KLK2) with Susceptibility of Prostate Cancer: A Meta-Analysis. PLoS ONE 8(6): e65651. doi:10.1371/journal.pone.0065651
Editor:Rui Medeiros, IPO, Inst Port Oncology, Portugal
ReceivedDecember 29, 2012;AcceptedApril 26, 2013;PublishedJune 18, 2013
Copyright:ß2013 Wang et al. This is an open-access article distributed under the terms of the Creative Commons Attribution License, which permits unrestricted use, distribution, and reproduction in any medium, provided the original author and source are credited.
Funding:No current external funding sources for this study.
Competing Interests:The authors named Lishan Wang, Weidong Zang, Dongli Xie and Li Wei are employed by Fenghe (ShangHai) Information Technology Co., whose company provided funding towards this study. There are no patents, products in development or marketed products to declare. This does not alter the authors’ adherence to all the PLOS ONE policies on sharing data and materials.
* E-mail: [email protected]
.These authors contributed equally to this work.
Introduction
Prostate cancer (PCa) is the most commonly diagnosed visceral malignancy accounting for more than one-third of all incident cancers and is the second-leading cause of cancer deaths in men in the United States and the western world [1] [2]. Prostate-specific antigen (PSA) has been used for detecting PCa since 1994 [3]. The wide availability of total PSA revolutionized PCa screening and ushered in the PSA era resulting in a decrease of PCa metastasis and death. Several novel blood-based biomarkers, such as human glandular kallikrein 2 (hK2) may also help PCa diagnosis, staging, prognostication, and monitoring [4].
There is considerable evidence for a genetic basis underlying risks for PCa [5], and it is among the most heritable of the common cancers with a heritability of 42% estimated from a twin study [6].The kallikrein (KLK) gene family, consisting of 15 genes
Moreover, hK2 is expressed at higher level in poorly differentiated cancers and is a likely candidate for prostate carcinogenesis [16]. All of these observations strongly implicate KLK2 as a plausible candidate gene involved in PCa susceptibility. During this decade, a number of studies have assessed the association between polymorphism rs198977 in KLK2 and risk of PCa in different populations; however, the results are inconsistent and inconclusive [17] [18]. Different methodologies have been used, and in particular, samples are collected from all over the world. Therefore, it is not surprising that there has been a lack of replication in different studies. By using all the available published data to increase the statistical power, it was hypothesized that a meta-analysis might allow plausible candidate genes to be excluded and causative genes to be identified with reliability. To confirm whether the polymorphism rs198977 in KLK2 is associated with susceptibility of PCa, we have taken a meta-analysis in which all the published case-control studies are processed.
Materials and Methods
Literature Search
Published reports assessing the association between polymor-phism of KLK2 and risk of PCa were collected through a comprehensive search of six databases, including PubMed, Elsevier, EMBASE, Web of Science, Wiley Online Library and Chinese National Knowledge Infrastructure (CNKI). The search terms were as follows: (‘KLK2’ OR ‘kallikrein-2’ OR ‘hK2’) AND (‘prostate cancer’). Searching was completed on Nov 1, 2012. Publication date and publication language were not restricted in our search. Meanwhile, reference lists were examined manually to further identify potentially relevant studies. Unpublished reports were not considered. If more than one article was published by the same author using the same case series, the one investigating the most individuals was selected.
Inclusion and Exclusion Criteria
Abstracts of all citations and retrieved studies were reviewed. Studies meeting the following criteria were included: (1) Using a case–control design; (2) Detecting the relationship between the polymorphism rs198977 and PCa; (3) Providing available geno-type data of rs198977. Studies were excluded if one of the following existed: (1) The design was based on family or sibling pairs; (2) The genotype frequency of rs198977 was not reported; (3) The association of rs198977 with susceptibility of PCa (e.g.
cancer progression and mortality) was not detected, or (4) There was insufficient information for extraction of data.
Data Extraction
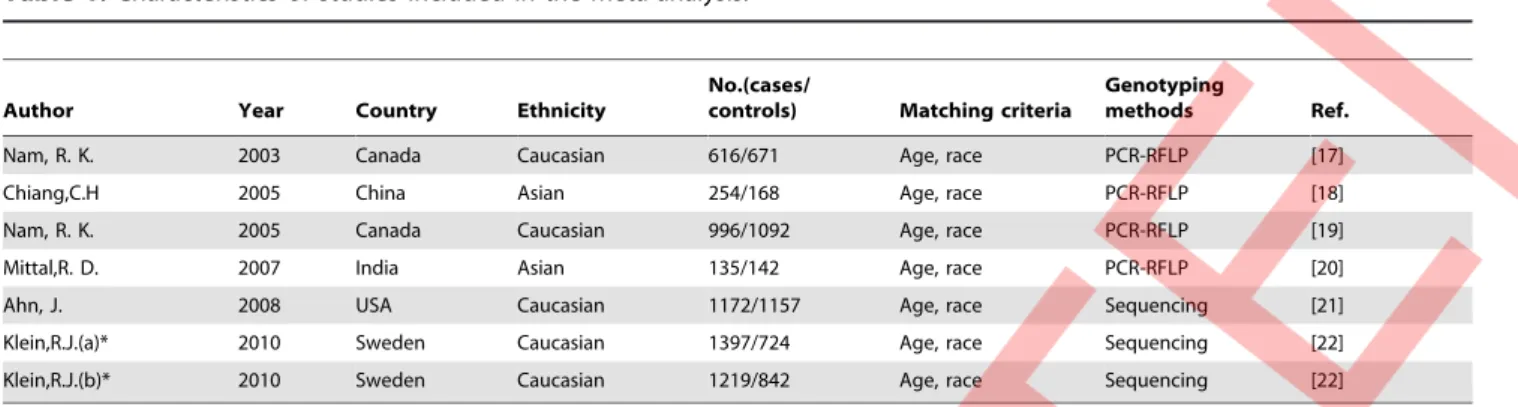
All data were extracted independently by two reviewers (lishan wang and weidong zang) according to the inclusion criteria listed above. The results were compared and disagreements were discussed and resolved with consensus. Evaluation was based on title and abstract whenever available. Full text articles of potentially relevant studies were obtained and re-evaluated for inclusion. The following characteristics were collected from each study using an Excel data extraction form: first author, year of publication, country of sample, ethnicity, numbers of cases and controls, main background of samples, and genotyping methods (Table 1).
Statistical Analysis
The statistical analysis was conducted using STATA 11.0 (Stata Corp LP, College Station, TX, United States); P-value,0.05 was considered statistically significant. Hardy-Weinberg equilibrium (HWE) in the controls was tested by the chi-square test for goodness of fit, and a P –value,0.05 was considered as significant disequilibrium. Pooled odds ratio (ORs) were calculated for allele comparison (T vs. C), dominant model (TT+CT vs. CC), and recessive model (TT vs. CC+CT), respectively. The significance of Table 1.Characteristics of studies included in the meta-analysis.
Author Year Country Ethnicity
No.(cases/
controls) Matching criteria
Genotyping
methods Ref.
Nam, R. K. 2003 Canada Caucasian 616/671 Age, race PCR-RFLP [17]
Chiang,C.H 2005 China Asian 254/168 Age, race PCR-RFLP [18]
Nam, R. K. 2005 Canada Caucasian 996/1092 Age, race PCR-RFLP [19]
Mittal,R. D. 2007 India Asian 135/142 Age, race PCR-RFLP [20]
Ahn, J. 2008 USA Caucasian 1172/1157 Age, race Sequencing [21]
Klein,R.J.(a)* 2010 Sweden Caucasian 1397/724 Age, race Sequencing [22]
Klein,R.J.(b)* 2010 Sweden Caucasian 1219/842 Age, race Sequencing [22]
*Klein’s study included two separate groups of samples, data was extracted according to the groups (a and b) as they were independent with each other and analyzed respectively in the initial study. PCR-RFLP: Polymerase chain reaction-restriction fragment length polymorphism.
doi:10.1371/journal.pone.0065651.t001
Figure 1. Flow chart of selection of studies and specific reasons for exclusion from the meta-analysis.
pooled ORs was determined by Z-test and P-value ,0.05 was considered as statistically significant.
The OR and 95% CI were estimated for each study in a random-effects model or in a fixed-effects model. Heterogeneity among studies was examined with thex2-based Q testing andI2
statistics [19]. P-value,0.1 was considered significant for thex2
-based Q testing and I2was interpreted as the proportion of total variation contributed by between-study variation. If there was a significant heterogeneity (P-value ,0.1), we selected a random-effects model (the DerSimonian and Laird method) to pool the data. If not, we selected a fixed-effects model (the Mantel-Haenszel method) to pool the data. Heterogeneity was also quantified using theI2metric (I2,25%, no heterogeneity;I2= 25–50%, moderate heterogeneity; I2.50%, large or extreme heterogeneity) [25]. Publication bias was examined with funnel plots and with the Egger’s tests [20] [21]. If there is evidence of publication bias, the funnel plot is noticeably asymmetric. For the Egger’s tests the significance level was set at 0.05.
Results
Study Characteristics
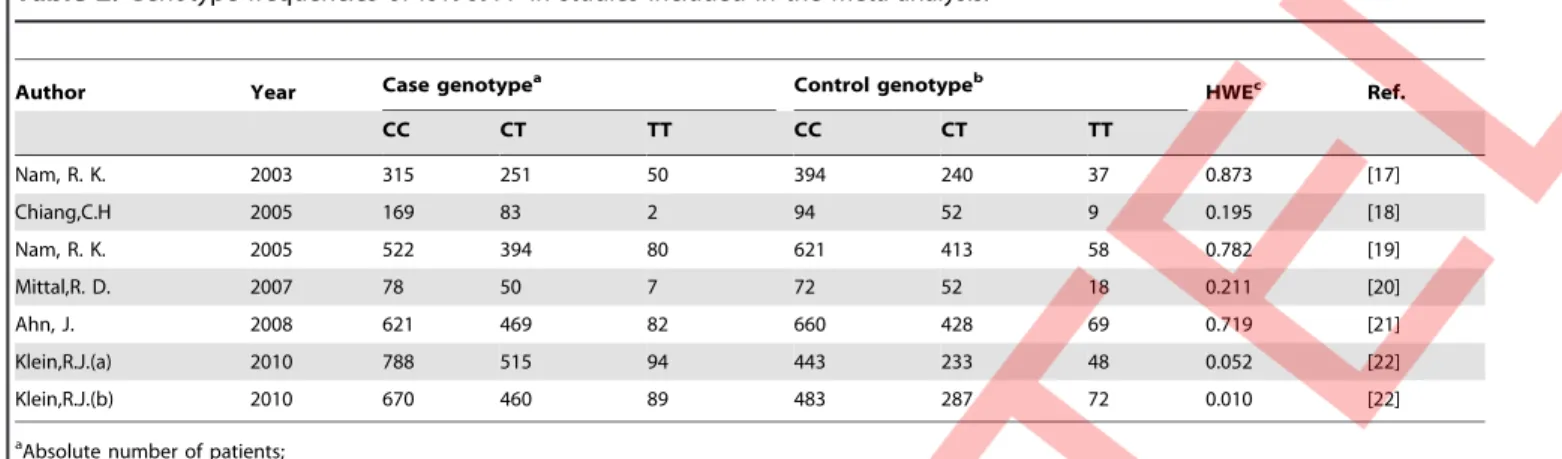
A total of 121 papers were retrieved after the first search, and 115 of these were excluded from the analysis for reasons detailed in Figure 1. Only 6 case-control studies met the inclusion criteria in this meta-analysis, which included 5859 PCa cases and 4867 controls [17] [18]. Characteristics of studies included in the meta-analysis were presented in Tables 1 and 2. The qualities of the studies were considered acceptable for our meta-analysis. We calculated HWE for all six publications and found that only Klein’s study [18] was inconsistent with Hardy-Weinberg disequi-librium (P-value = 0.01). The flow chart of selection of studies and reasons for exclusion was presented in Figure 1. Studies had been carried out in Canada (n = 2), Sweden (n = 1), USA (n = 1), China (n = 1) and India (n = 1). Four studies [17][22] [23] used Caucasian samples while two studies [24][25] used Asian samples.
Evaluation of rs198977 and Association with PCa There were six case-control studies [17] [18]which had been performed to study the polymorphism rs198977 and PCa risk. Results of the meta-analysis were shown in Table 3. Overall, when Table 2.Genotype frequencies of rs198977 in studies included in the meta-analysis.
Author Year Case genotypea Control genotypeb HWEc Ref.
CC CT TT CC CT TT
Nam, R. K. 2003 315 251 50 394 240 37 0.873 [17]
Chiang,C.H 2005 169 83 2 94 52 9 0.195 [18]
Nam, R. K. 2005 522 394 80 621 413 58 0.782 [19]
Mittal,R. D. 2007 78 50 7 72 52 18 0.211 [20]
Ahn, J. 2008 621 469 82 660 428 69 0.719 [21]
Klein,R.J.(a) 2010 788 515 94 443 233 48 0.052 [22]
Klein,R.J.(b) 2010 670 460 89 483 287 72 0.010 [22]
aAbsolute number of patients; bAbsolute number of controls;
cHWE: Hardy-Weinberg equilibrium, it was evaluated using the goodness-of-fit chi-square test. P-values were presented. P
,0.05 was considered representative of a departure from HWE.
doi:10.1371/journal.pone.0065651.t002
Table 3.Pooled odds ratio for rs198977 in meta-analyses.
Population Genetic Model Pooled OR(95% CI) P-valuea P-value
b(Publication bias)
P-valuec
(heterogeneity) I2
All Allele T vs.C 1.077(0.957–1.212) 0.216 0.047 0.006 67.0%
Dominant 1.163(1.076–1.258) ,0.0001 0.050 0.143 37.4%
Recessive 0.993(0.718–1.373) 0.964 0.093 0.001 72.2%
Caucasian Allele T vs.C 1.152(1.079–1.229) ,0.0001 0.328 0.319 14.9%
Dominant 1.197(1.104–1.297) ,0.0001 0.129 0.703 0.0%
Recessive 1.173(0.930–1.480) 0.177 0.328 0.077 52.5%
Asian Allele T vs.C 0.701(0.542–0.906) 0.007 – 0.928 0.0%
Dominant 0.765(0.560–1.045) 0.092 – 0.924 0.0%
Recessive 0.278(0.128–0.600) 0.001 – 0.239 27.8%
aRandom-effects model was used when the p-value for heterogeneity test
,0.10, otherwise the fixed-effect model was used.
bEgger’s test to evaluate publication bias, P –value,0.05 is considered statistically significant. cP-value,0.1 is considered statistically significant for Q statistics.
all the eligible studies were pooled into the meta-analysis, we found that a significant PCa risk was associated with rs198977 polymorphism in a dominant model (TT+CT vs. CC, pooled OR = 1.163, 95% CI = 1.076–1.258, P-value,0.0001); while no significant association was observed in either allele comparison (T vs. C, pooled OR = 1.077, 95% CI = 0.957–1.212, P-val-ue = 0.216) or recessive model (TT vs. CT+CC, pooled OR = 0.993, 95% CI = 0.718–1.373, P-value = 0.964).
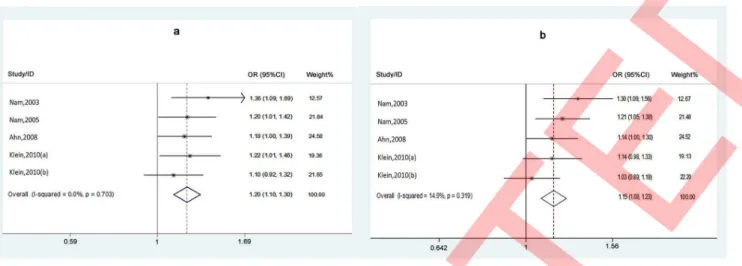
When studies were stratified by ethnicity, significant associations were observed in Caucasian group in both allele comparison (T vs. C, pooled OR = 1.152, 95% CI = 1.079–1.229, P-value,0.0001) and dominant model (TT+CT vs. CC, pooled OR = 1.197, 95% CI = 1.104–1.297, P-value ,0.0001) (Figure 2); while no signifi-cant association was observed in Caucasian group in recessive model (TT vs. CT+CC, pooled OR = 1.173, 95% CI = 0.930– 1.480, P-value = 0.177). In addition, significant associations were observed in Asian group in both allele comparison (T vs. C, pooled OR = 0.701, 95% CI = 0.542–0.906, P-value = 0.007) and reces-sive model (TT vs. CT+CC, pooled OR = 0.278, 95% CI = 0.128– 0.600, P-value = 0.001); while no significant association was
observed in Asian group in dominant model (TT+CT vs. CC, pooled OR = 0.765, 95% CI = 0.560–1.045, P-value = 0.092).
Sensitivity Analysis
The influence of a single study on the overall meta-analysis was investigated by omitting one study at a time, and the omission of any study made no significant difference, indicating that our results were statistically reliable.
Evaluation of Heterogeneity
For all samples, statistically significant heterogeneity was observed under both allele comparison (T vs. C, P-value byx2 -based Q testing = 0.006 andI2= 67.0%) and recessive model (TT vs. CT+CC, P-value by x2 -based Q testing = 0.001 and
I2= 72.2%), but no significant heterogeneity was observed under dominant model (TT+CT vs. CC, P-value by x2 -based Q
testing = 0.143 and I2= 37.4%). Then subgroup analysis was carried out. When studies were stratified by ethnicity, no statistically significant heterogeneity was observed in Caucasian under either allele comparison (T vs. C, P-value byx2-based Q testing = 0.319 andI2= 14.9%) or dominant model (TT+CT vs. Figure 2. Forest plots of studies with Caucasian samples under dominant model (a) and Allele comparison model (b).
doi:10.1371/journal.pone.0065651.g002
CC, P-value by x2-based Q testing = 0.703 and I2= 0.0%), but
there was significant heterogeneity under recessive model (TT vs. CT+CC, P-value byx2-based Q testing = 0.077 andI2= 52.5%).
For Asian, no statistically significant heterogeneity was observed under any model (all P-values by x2-based Q testing .0.1 and
I2,50%). Results of heterogeneity were shown in Table 3. Publication Bias
Funnel plot and Egger’s test were performed to assess the publication bias of the literature. Results publication bias was shown in Table 3. For all samples, publication bias was observed under allele comparison (T vs. C, P-value of Egger’s test = 0.047). After samples were stratified by ethnicity, no publication bias was observed under any model (all P-value of Egger’s test .0.05). Symmetrical funnel plots were obtained for Caucasian (Figure 3), but Funnel plot and Egger’s test were not available for Asian samples because of the small sample size.
Discussion
The data from this meta-analysis showed a significant increase in frequency of genotype TT+CT of rs198977 polymorphism in patients with PCa than controls, which suggested that genotype TT+CT might increase the risk of PCa with pooled OR of 1.163. When stratified the samples by their ethnicity, the frequencies of both the allele T and genotype TT+CT in Caucasian had significant increase in cases than controls with pooled OR of 1.152 and 1.197, respectively; but things became different for Asian, there was a significant decrease in frequency of allele T in cases than control with pooled OR of 0.701. Though results from Asian samples indicated allele C of rs198977 was the risk factor, it still be under discussion because of the small sample size in our analysis. But the results clearly suggested that allele T of rs198977 was a moderate risk factor of PCa for Caucasian. In addition, Mikolajczyk et al.showed that increased hK2 expression in PCa tissues could influence cancer biology not only by activating uPA but also by inactivating its primary inhibitor, plasminogen activator inhibitor [26]. And results from transgenic mice demonstrate, with biologically relevant models, that KLK2 is the protease responsible for activating PSA [27]. Variants on KLK2 gene may affect the expression of hK2, and thus its biological function might be altered. These previous findings support our results and give us possible explanation to the mechanism.
The degree of heterogeneity is one of the major concerns in meta-analysis as non-homogeneous data are liable to result in misleading results. In the present study, the Q testing and I2
statistics were carried out to test the significance of heterogeneity. For all samples, significant heterogeneity existed under allele comparison and recessive model. After stratifying the samples according to their ethnicity, the heterogeneity decreased. For
Caucasian samples, significant heterogeneity was observed under recessive model, while no statistically significant heterogeneity was observed under any model in Asian samples. The results indicated ethnicity might play an important role in genetic heterogeneity of rs198977. In other words, there exist heterogeneity of rs198977 between Caucasian and Asian according to our results.
Publication bias is another important factor affecting the quality of meta-analysis. In order to assess publication bias, funnel plot and Egger’s test were performed. Publication bias was observed under allele comparison when all studies were included. After removing Asian samples, no publication bias was observed under any model and symmetrical funnel plots were obtained for Caucasian (all P-value of Egger’s test .0.05) (Table 3 and Figure 3). This indicated that two studies with Asian samples might be responsible for the publication bias, but the reason could not be exactly determined as Funnel plot and Egger’s test were not available for only two studies. Moreover, we performed a sensitivity analysis by removing one study each time and re-running the model to determine the effect on each overall estimate. The estimates changed little, which implied that our results were statistically reliable.
However, there are still some limitations in this meta-analysis. (1) In six studies included for our analysis, two of them are Asian samples occupied only 6.52% of whole samples, so such results should be interpreted with caution; (2) Because the samples from 5 countries and controls were not uniform, as in most meta-analyses, results should be interpreted with caution; and (3) meta-analysis is retrospective research that is subject to methodological limitations. In order to minimize the bias, we used explicit methods for study selection, data extraction and data analysis. Nevertheless, our results should be interpreted with caution.
This meta-analysis suggests that the polymorphism rs198977 of KLK2 was associated with susceptibility of prostate cancer in Caucasian and the allele T might increase the risk of prostate cancer. The pooled ORs in this study suggest that allele T and genotype TT+CT both have modest but definite genetic effect on prostate cancer in Caucasian. Larger and well-designed studies based on different ethnic groups are needed to confirm our results, especially for Asian samples.
Supporting Information
Checklist S1 PRISMA checklist.
(DOC)
Author Contributions
Conceived and designed the experiments: LSW WDZ DLX YXS. Performed the experiments: WDJ. Analyzed the data: YSP LW. Contributed reagents/materials/analysis tools: JWS YYS. Wrote the paper: WDZ ZQL YXS.
References
1. Jemal A, Siegel R, Xu J, Ward E (2010) Cancer statistics, 2010. CA: a cancer journal for clinicians 60: 277–300.
2. Siegel R, Ward E, Brawley O, Jemal A (2011) Cancer statistics, 2011: the impact of eliminating socioeconomic and racial disparities on premature cancer deaths. CA: a cancer journal for clinicians 61: 212–236.
3. Nogueira L, Corradi R, Eastham JA (2010) Other biomarkers for detecting prostate cancer. BJU int 105: 166–169.
4. Shariat SF, Semjonow A, Lilja H, Savage C, Vickers AJ et al. (2011) Tumor markers in prostate cancer I: blood-based markers. Acta Oncol 50 Suppl 1: 61– 75.
5. Langeberg WJ, Isaacs WB, Stanford JL (2007) Genetic etiology of hereditary prostate cancer. Frontiers in bioscience : a journal and virtual library 12: 4101– 4110.
6. Lichtenstein P, Holm NV, Verkasalo PK, Iliadou A, Kaprio J et al. (2000) Environmental and heritable factors in the causation of cancer–analyses of
cohorts of twins from Sweden, Denmark, and Finland. The New Engl J Med 343: 78–85.
7. Yousef GM, Luo LY, Diamandis EP (1999) Identification of novel human kallikrein-like genes on chromosome 19q13.3-q13.4. Anticancer research 19: 2843–2852.
8. Diamandis EP, Yousef GM, Luo LY, Magklara A, Obiezu CV (2000) The new human kallikrein gene family: implications in carcinogenesis. TEM 11: 54–60. 9. Riegman PH, Vlietstra RJ, van der Korput JA, Romijn JC, Trapman J (1989) Characterization of the prostate-specific antigen gene: a novel human kallikrein-like gene. Biochem biophy res commun 159: 95–102.
10. Catalona WJ, Smith DS, Ratliff TL, Basler JW (1993) Detection of organ-confined prostate cancer is increased through prostate-specific antigen-based screening. JAMA 270: 948–954.
antigen density in the early detection of prostate cancer: receiver operating characteristic curves. The J urol 152: 2031–2036.
12. Partin AW, Catalona WJ, Finlay JA, Darte C, Tindall DJ et al. (1999) Use of human glandular kallikrein 2 for the detection of prostate cancer: preliminary analysis. Urology 54: 839–845.
13. Yousef GM, Diamandis EP (2001) The new human tissue kallikrein gene family: structure, function, and association to disease. Endocrine rev 22: 184–204. 14. Nam RK, Zhang WW, Klotz LH, Trachtenberg J, Jewett MA et al. (2006)
Variants of the hK2 protein gene (KLK2) are associated with serum hK2 levels and predict the presence of prostate cancer at biopsy. Clin cancer res 12: 6452– 6458.
15. Lintula S, Stenman J, Bjartell A, Nordling S, Stenman UH (2005) Relative concentrations of hK2/PSA mRNA in benign and malignant prostatic tissue. The Prostate 63: 324–329.
16. Tremblay RR, Deperthes D, Tetu B, Dube JY (1997) Immunohistochemical study suggesting a complementary role of kallikreins hK2 and hK3 (prostate-specific antigen) in the functional analysis of human prostate tumors. The Am J pathol 150: 455–459.
17. Nam RK, Zhang WW, Trachtenberg J, Diamandis E, Toi A et al. (2003) Single nucleotide polymorphism of the human kallikrein-2 gene highly correlates with serum human kallikrein-2 levels and in combination enhances prostate cancer detection. J clin oncol 21: 2312–2319.
18. Klein RJ, Hallden C, Cronin AM, Ploner A, Wiklund F et al. (2010) Blood biomarker levels to aid discovery of cancer-related single-nucleotide polymor-phisms: kallikreins and prostate cancer. Cancer Prev Res (Phila) 3: 611–619.
19. Higgins JP, Thompson SG (2002) Quantifying heterogeneity in a meta-analysis. Statist med 21: 1539–1558.
20. Light RJ, Pillemer DB (1984) Summing up : the science of reviewing research. Harvard University Press, Cambridge, Mass.
21. Egger M, Davey Smith G, Schneider M, Minder C (1997) Bias in meta-analysis detected by a simple, graphical test. BMJ 315: 629–634.
22. Nam RK, Zhang WW, Jewett MA, Trachtenberg J, Klotz LH et al. (2005) The use of genetic markers to determine risk for prostate cancer at prostate biopsy. Clin cancer res 11: 8391–8397.
23. Ahn J, Berndt SI, Wacholder S, Kraft P, Kibel AS et al. (2008) Variation in KLK genes, prostate-specific antigen and risk of prostate cancer. Nature genetics 40: 1032–1034; author reply 1035–1036.
24. Chiang CH, Hong CJ, Chang YH, Chang LS, Chen KK (2005) Human kallikrein-2 gene polymorphism is associated with the occurrence of prostate cancer. J urology 173: 429–432.
25. Mittal RD, Mishra DK, Thangaraj K, Singh R, Mandhani A (2007) Is there an inter-relationship between prostate specific antigen, kallikrein-2 and androgen receptor gene polymorphisms with risk of prostate cancer in north Indian population? Steroids 72: 335–341.
26. Mikolajczyk SD, Millar LS, Kumar A, Saedi MS (1999) Prostatic human kallikrein 2 inactivates and complexes with plasminogen activator inhibitor-1. Int J cancer 81: 438–442.