Microsatellites retain phylogenetic signals across genera in eucalypts
(Myrtaceae)
Joel W. Ochieng
1, Dorothy A. Steane
2, Pauline Y. Ladiges
3, Peter R. Baverstock
1, Robert J. Henry
1and Mervyn Shepherd
11
Centre for Plant Conservation Genetics, Southern Cross University, Military Road, Lismore, NSW,
Australia.
2
School of Plant Science, University of Tasmania, Hobart, TAS, Australia.
3
School of Botany, University of Melbourne, Parkville, Victoria, Australia.
Abstract
The utility of microsatellites (SSRs) in reconstructing phylogenies is largely confined to studies below the genus level, due to the potential of homoplasy resulting from allele size range constraints and poor SSR transferability among divergent taxa. The eucalypt genusCorymbia has been shown to be monophyletic using morphological char-acters, however, analyses of intergenic spacer sequences have resulted in contradictory hypotheses- showing the genus as either equivocal or paraphyletic. To assess SSR utility in higher order phylogeny in the family Myrtaceae, phylogenetic relationships of the bloodwood eucalyptsCorymbia and related genera were investigated using eight polymorphic SSRs. Repeat size variation using the average square and Nei’s distance were congruent and showed Corymbia to be a monophyletic group, supporting morphological characters and a recent combination of the internal and external transcribed spacers dataset. SSRs are selectively neutral and provide data at multiple genomic regions, thus may explain why SSRs retained informative phylogenetic signals despite deep divergences. We show that where the problems of size-range constraints, high mutation rates and size homoplasy are addressed, SSRs might resolve problematic phylogenies of taxa that have diverged for as long as three million generations or 30 million years.
Key words:microsatellite phylogeny, paraphyletic, homoplasy, incongruence, eucalypts.
Received: February 23, 2007; Accepted: July 3, 2007.
Introduction
Phylogenies inferred from independent data parti-tions may differ from one another in topology despite the fact that they are drawn from the same set of organisms (Rodrigoet al., 1993; McCracken and Sorenson, 2005). In-congruence due to statistical, sampling or computational errors can be addressed by expanded and judicious sam-pling, addition of phylogenetic characters or by modifying analysis and tree reconstruction models (e.g., Udovicic et al., 1995; Steaneet al., 1999, 2002; Udovicic and Ladiges, 2000). However, if topological incongruence between mor-phological and molecular data have their origin in genea-logical discordance, the conflict is not easily resolved by modifying the model used in phylogenetic reconstruction, correcting for sampling error, combining data or by other manipulations. Such topological incongruence may arise as
a result of hybridization (Dumolin-Lapegueet al., 1997; McKinnonet al., 1999; Avise, 2000), paralogy and lineage sorting (Aviseet al., 1990; Maddison, 1997; Avise, 2000; Lu, 2001; Takahashiet al., 2001; Ochienget al., 2007), or homoplasy (McCracken and Sorenson, 2005). Eucalypts are the dominant forest and woodland trees of Australia, with several species being of major economic importance in Australia and other countries around the world. Phylo-genetic relationships within the eucalypts present a case of conflicting datasets, particularly the phylogenetic status of
Corymbiain relation toAngophora.
The plant family Myrtaceae includes two large groups in the Australian region: the ‘eucalypts’ and the ‘melaleuca’ group (Johnson and Briggs, 1984). The eucalypt group (broad sense) includes seven genera, three of which are closely related (EucalyptusL’Hér.,Corymbia
K. D.Hill and L.A.S. Johnson andAngophora Cav.). The other smaller members are the monotypic genera
ArillastrumPancher ex Baill.,StockwelliaD.J. Carr, D.J. Carr and B. Hyland and Allosyncarpia S.T. Blake, and
digeset al., 2003). Previously, Pryor and Johnson (1971) proposed the division of the genusEucalyptusinto seven subgenera: Blakella, Corymbia, Eudesmia, Gaubaea, Idiogenes, Monocalyptus, and Symphyomyrtus, based on morphological and ecological characters, and on the lack of crossability among the subgenera. In a major taxonomic re-vision of the bloodwoods, two of these subgenera,
Corymbiaand Blakearia, were included in a new genus
Corymbia, classified into seven sections (Fundoria, Rufaria, Apteria, Ochraria, Politaria, Cadagaria, Blakearia; Hill and Johnson 1995). However, Brooker (2000) presented an alternative view regarding the mono-phyly and hence generic recognition ofCorymbia(but see Ladiges and Udovicic, 2000). Phylogenetic analysis by Hill and Johnson (1995) based largely on morphological char-acters, showedCorymbiato be a monophyletic taxon, sister toAngophora. However, molecular DNA data from chloro-plast (trnL, trnH, psbA) (Udovicic and Ladiges, 2000) and ITS (Steaneet al., 1999, 2002) suggested thatAngophorais nested withinCorymbia, making the latter paraphyletic. In-creased taxon sampling for the ITS region by Steaneet al.
(2002) did not resolve the question of paraphyly. Very re-cently, analyses of the external transcribed spacers (ETS; Parra-O et al., 2006) showedCorymbia to be monophy-letic, however, ITS alone by the same group supported ear-lier ITS analyses.
The ITS locus has recently been reported to exist in paralogs within eucalypt genomes (Ochienget al., 2007; Baylyet al., 2007). It is possible that paralogous sequences confound phylogenetic resolution at this locus in eucalypts. We are currently cloning and sequencing the nrITS to in-vestigate if gene duplication was the cause of tree incongru-ence in the eucalypts. So far, three ITS riboforms, two of them widespread, have been recovered within some ge-nomes. Compelling evidence suggested that one of the di-vergent riboforms was a pseudogene. Phylogenies from the apparently functional riboform retainedCorymbiain an ap-parent paraphyly, whereas the putative pseudogene recov-ered a phylogeny showing Corymbia as a monophyletic genus (Ochienget al., 2007). We explained that phylogen-etic signals are obscured when functional constraints in nrITS necessitate compensatory mutations in the secondary structure helices involved in RNA transcription, whereas pseudogenes mutate under neutrality. However, other ex-planations such as hybridization and computational prob-lems cannot be ruled out.
If functional constraints on nrITS were the cause of apparent paraphyly for the genusCorymbia, then a neutral molecular locus with adequate phylogenetic signals should support the genus as a clade (monophyletic). One limitation with phylogenetic reconstructions using single gene region is the potential to get a biased hypothesis when genomic re-gions differ in their history. We revisited the unresolved phylogenetic relationships among the eucalypt genera with
sent different genomic regions in a single dataset. Microsatellites, also referred to as simple sequence repeats (SSRs), are segments of DNA with tandem repeat of short sequence motifs, each generally less than 5 bp in length (Bruford and Wayne, 1993). SSRs have many advantages over DNA sequencing, including a greater representation of different genomic regions and faster evolution that may lead to more informative characters. However, the utility of SSRs in reconstructing phylogenetic relationships, espe-cially among divergent taxa, is a matter of current debate. Apart from the technical difficulty in amplifying SSRs across taxa, they are believed to possess three interrelated attributes that may limit their use in reconstructing phylo-genies of divergent taxa: (1) a constraint on allele size range (Goldstein and Pollock, 1997), (2) high mutation rates, and (3) size homoplasy (Bruford and Wyne, 1993). Another limitation in SSR analyses is that confident assessment of orthology for each allele pair would involve sequencing of each of the alleles, a very expensive exercise, particularly for multilocus genotyping. As such, orthology is presumed when fragments are the same/similar length. These reasons partly explain why many phylogenetic studies utilizing microsatellites have been restricted to infra-specific rela-tionships (e.g., Goldsteinet al., 1999), or to the use of the SSR flanking sequence in higher order phylogenies (e.g., Streelmanet al., 1998; Zhuet al., 2000). However, some notable cases exist for the use of repeat sequence variations in highly divergent taxa: (1) Richard and Thorpe (2001) used SSR size variation to analyse the phylogenetic rela-tionships among the western canary island lizards, a group that diverged five million years ago (MYA). This diver-gence time corresponds to five million generations given their short generation time of one year (Richard and Thorpe, 2001). (2) Ritzet al. (2000) applied repeat size variation at SSR loci to resolve the relationships among four genera (Bos, Bison, Bubalus and Syncerus) in the sub-familyBovini. To overcome issues of homoplasy, the authors used the average square (δµ)2genetic distance mea-sure (Goldsteinet al., 1995). The authors found the mea-sure to be robust despite fluctuations in population size, and retained linearity with increasing time. The tree topology was retained when data were reanalysed with Cavalli-Sfor-za and Edwards’ (1967) chord distance (DC) that is,
inter-estingly, based on the infinite allele model. (3) Micro-satellite length variation has been used in reconstructing the phylogeny of Darwin’s finches (Petrenet al., 1999). Al-though considered to be congeneric, these birds are be-lieved to have radiated at least three MYA (Petrenet al., 1999, and references therein). With their short generation time of four months to one year (Zink, 2002), they have evolved for over five million generations.
al., 1998) and a low level of SSR conservation among many plant taxa (e.g., Whittonet al., 1997), rather than concerns relating to high mutation rates or other evolutionary consid-erations. Where the problems of range constraints, high mutation rates and size homoplasy are addressed, SSRs may be utilised in phylogenetic studies, even among diver-gent taxa, so long as SSR primers amplify across such taxa. In eucalypts, cross-genera SSRs transferability has recently been reported to be high (Shepherdet al., 2006). We used 8 polymorphic SSRs isolated fromCorymbia variegata(F. Muell. Hill and Johnson) clones to genotypeCorymbiaand
Angophorasamples previously analysed for ITS (Steaneet
al., 2002), to test the hypothesis that Corymbia is monophyletic.
Material and Methods
Plant material and DNA isolation
This study utilized a total of 32 DNA samples repre-senting Corymbia (20), Angophora (8), Eucalyptus (3),
Allosyncarpia (2), Eucalyptopsis (1) and Stockwellia (1) (Table1). Within Corymbia, nine species were sampled from the red bloodwood group (sections Rufaria and
Apteria) (Hill and Johnson, 1995), seven from the yellow
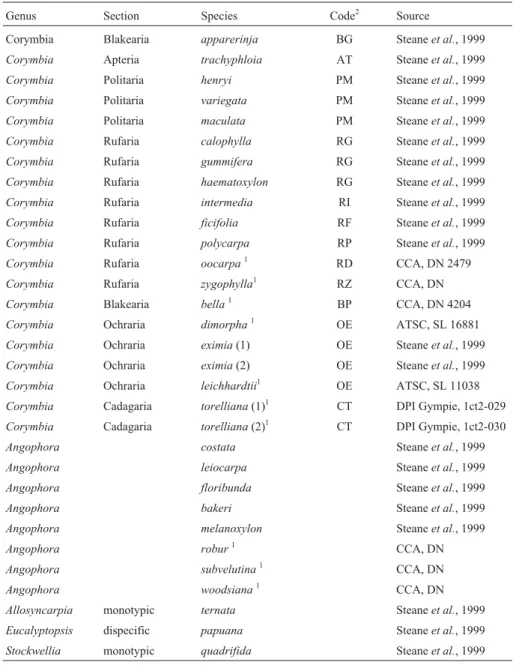
Table 1- List of taxa used in this study, including those analysed previously in the ITS study of Steaneet al.(2002). Names are those in the classification of Hill & Johnson (1995).
Genus Section Species Code2 Source
Corymbia Blakearia apparerinja BG Steaneet al., 1999
Corymbia Apteria trachyphloia AT Steaneet al., 1999
Corymbia Politaria henryi PM Steaneet al., 1999
Corymbia Politaria variegata PM Steaneet al., 1999
Corymbia Politaria maculata PM Steaneet al., 1999
Corymbia Rufaria calophylla RG Steaneet al., 1999
Corymbia Rufaria gummifera RG Steaneet al., 1999
Corymbia Rufaria haematoxylon RG Steaneet al., 1999
Corymbia Rufaria intermedia RI Steaneet al., 1999
Corymbia Rufaria ficifolia RF Steaneet al., 1999
Corymbia Rufaria polycarpa RP Steaneet al., 1999
Corymbia Rufaria oocarpa1 RD CCA, DN 2479
Corymbia Rufaria zygophylla1 RZ CCA, DN
Corymbia Blakearia bella1 BP CCA, DN 4204
Corymbia Ochraria dimorpha1 OE ATSC, SL 16881
Corymbia Ochraria eximia(1) OE Steaneet al., 1999
Corymbia Ochraria eximia(2) OE Steaneet al., 1999
Corymbia Ochraria leichhardtii1 OE ATSC, SL 11038
Corymbia Cadagaria torelliana(1)1 CT DPI Gympie, 1ct2-029
Corymbia Cadagaria torelliana(2)1 CT DPI Gympie, 1ct2-030
Angophora costata Steaneet al., 1999
Angophora leiocarpa Steaneet al., 1999
Angophora floribunda Steaneet al., 1999
Angophora bakeri Steaneet al., 1999
Angophora melanoxylon Steaneet al., 1999
Angophora robur1 CCA, DN
Angophora subvelutina1 CCA, DN
Angophora woodsiana1 CCA, DN
Allosyncarpia monotypic ternata Steaneet al., 1999
Eucalyptopsis dispecific papuana Steaneet al., 1999
Stockwellia monotypic quadrifida Steaneet al., 1999
1
New taxa analysed in this study but not in the ITS analysis of Steaneet al.(2002).
2Species codes are those used on the phylogram (Figure 1), and represent the sections and series initials respectively. The initials CCA and ATSC code for
and two paper-fruited bloodwoods (section Blakearia) (Hill and Johnson 1995).C. eximiaandC. torelliana in-cluded two samples each. Our analysis retained the same individual DNA samples analysed by Steaneet al.(2002) for comparison, but we included a new section (Corymbia
sect.Cadagaria), new series and species not included in the previous DNA phylogeny of these genera. Herbarium voucher numbers or origin for new samples is indicated in Table 1. For new samples, total genomic DNA was ex-tracted from 10 mg of leaf tissue using a DNeasy plant kit (QIAGEN, Germany) according to the manufacturer’s pro-tocol. Leaf tissue was ground using tungsten carbide beads (QIAGEN) and a RETSCH MM300 Mixer Mill at fre-quency of 1/30 s for three lots of one minute. DNA was eluted from the filter membranes with 150µL of elution buffer and was stored at -20 °C.
PCR amplification and fragment separation
Eight polymorphic SSRs used in this study have been published previously: EMCRC26, EMCRC32, EMCRC39 (Joneset al., 2001); EMCRC46, EMCRC51, EMCRC54, EMCRC93 (Shepherdet al., 2006); Eg126 (Thamarus et al., 2002). For each primer pair, the forward primer was fluorescently labelled with a dye. PCR was performed in 10µL volumes comprising 1x PCR buffer (10 mM Tris -HCl pH 83, 50 mM KCl, 0001% gelatin (Sigma, St Louis, MO, USA), 025% Nonidet P40 (BHD, Poole, UK) and 2 mM MgCl2) and contained approximately 0.5 ng of genomic DNA, 0.125 mM of each dNTPs, 0.15µM of each primer, and 0.5 Units of Platinum Taq (Invitrogen). All am-plifications were carried out on an ABI 9700 Thermocycler (Applied Biosystems) with an initial denaturation of 7 min at 95 °C, followed by 10 cycles of denaturation at 95 °C, a touchdown annealing from 60 °C to 55 °C (decreasing at -0.5 °C each cycle), 1 min. extension at 72 °C. This was fol-lowed by 25 repeated cycles of denaturation at 95 °C, an-nealing at 55 °C and an extension of 1 min. at 72 °C. A final extension of 72 °C for 10 min was applied to all reactions. For each sample, one microliter of the PCR products were separated on a 3730 DNA analyser (Applied Biosystems; SCPG, Lismore, Australia) and raw data were imported into ABI Prism GeneMapper Software v 3.0 (Applied Bio-systems) for size calling. All samples amplified success-fully at the eight SSR loci, except for the threeEucalyptus
species (E. urophylla, E. camaldulensis, E. globulus) that amplified only four of the loci (EMCRC26, EMCRC39, EMCRC46 and Eg126). The three samples were therefore removed from subsequent analyses. Diploid allele size data from SSRs were exported to an Excel spreadsheet for statis-tical analyses.
Statistical methods
Allelic counts were estimated for each informal group, i.e., yellow bloodwoods assemblage, red
blood-programme, V 2.9 (Goudet, 2001), while the variance in al-lele size for each locus per group was computed from MS Excel spreadsheet. Cumulative variance was the sum of single locus variances, taking allele sizes (in bp) as values. Genetic distances based on allele size variation are mod-elled on the premise that when a mutation occurs, the new mutant is related to the allele from which it was derived. In this case, the difference in length between alleles contains phylogenetic information (Goldstein et al. 1995). Two measures were employed to estimate the between-individual genetic distance: the average square distance (D1) of Goldsteinet al.(1995), and Nei’s (1972) standard
genetic distance (D). The average square distance accounts for size homoplasy, and is suitable for reconstructing trees that include more distantly related taxa. Both distances were computed using the MICROSAT programme avail-able from the Human Population Genetics Laboratory (HPGL), Stanford University, with the option of either ex-haustive or 100 bootstrap replicates. The allele sizes ana-lysed were nucleotide counts rather than repeat scores, using the option that allows for repeat lengths = 1. Duration of linearity was calculated for each locus and averaged over loci. The primer error (size of the region flanking the SSR) was entered and corrected for, by assuming a default of no error (i.e., 0 nucleotides). Genetic distance matrices were imported into the computer programme PHYLIP (Felsens-tein 1995) for phylogenetic tree reconstruction. Neigh-bour-Joining (NJ) trees were drawn using NEIGHBOUR with 100 bootstrap replications, using the Eucalyptopsis
group (Eucalyptopsis, Stockwellia, Allosyncarpia) as an outgroup. All phylogenetic trees were displayed using TREEVIEW Version 1.5 available from the Department of Zoology, University of Glasgow. To take the small sample size into account, a second analysis was conducted for sam-ples pooled into five main groups: three withinCorymbia
(yellow bloodwoods assemblage, red bloodwoods and pa-per fruited bloodwoods,Blackearia),Angophora and the outgroups. In subsequent discussion, the yellow blood-woods will be termedCorymbiaA, whereas the red blood-woods will be referred to as CorymbiaB, following the informal grouping by Steaneet al.(2002)
Results and Discussion
Variability of SSRs
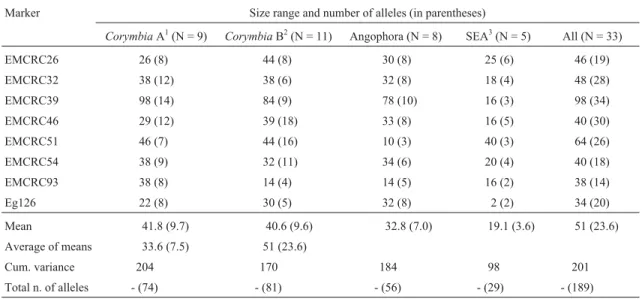
The eight markers used in this study were polymor-phic with a total of 189 unique alleles obtained from 32 samples representing 29 different species. The most vari-able locus was EMCRC39 with 34 unique alleles, while the least variable was EMCRC93 with 14 alleles (Table 2).
CorymbiaA had greater intragroup diversity in terms of both the cumulative variance and the mean number of al-leles (cum. variance = 204; MNA = 9.7) compared to either
Ango-phora(cum. variance = 184; MNA = 7.0). However, elimi-nating C. torelliana (Cadagaria) from Corymbia A lowered the variance to 192, which was, nevertheless, still higher than the other groups. Our sampling ofCorymbiaA included three sections (Ochraria, Politaria and
Cadagaria) and three series (Eximiae, Maculatae and Torellianae), while Corymbia B included two sections (RufariaandApteria) and seven series (see Table 1). The higher diversity withinCorymbiaA may relate to the fact that seven out of the eight markers used in this analysis were isolated from a clone of C. variegata, a species in
CorymbiaA, possibly making theMaculataeseries (spot-ted gums: C. maculata, C. citriodora, C. henryi, C.variegata) more variable than species more distant from
C. variegata, consistent with the principle of ascertainment bias.
Ascertainment bias
Ascertainment bias describes the observation that when the size distribution of microsatellite alleles across different species is compared, the absolute allele sizes in the species from which the microsatellite was derived are often greater than those found in closely related species (Ellegrenet al., 1995; Forbeset al., 1995; Rubinsteinet al., 1995). Ascertainment bias may result from either direc-tional evolution occurring within different species (Ru-binsteinet al., 1995) or bias in the selection of clones for sequencing and primer development (Ellegrenet al., 1995). Although there is no precedence for the utility of ascertain-ment bias as a phylogenetic probe, our data suggest that the means of allele size, averaged over loci, reflected the ex-pected taxonomic distance, with the closest relatives of
Corymbia A (from which the SSRs were developed; C. variegata) being Corymbia B, followed by Angophora, then the Eucalyptopsis group (Stockwellia/Eucalyptopsis/ Allosyncarpia; Table 2). Although it would be expected that the locus Eg 126 show a different pattern since it is based onEucalyptus globulus, this was not observed, per-haps due to the lower polymorphism at this locus compared to the other loci used in this study. WhereasStockwellia,
AllosyncarpiaandEucalyptopsissuccessfully amplified at all eight loci, the threeEucalyptusspecies (E. urophylla, E. camaldulensis, E. globulus) failed to amplify in half of the loci studied (four out of eight). By morphology and fossil record, Eucalyptusis the closest clade to Corymbia and
Angophora. It is not clear whether this failure to amplify
Corymbiaspecific SSRs inEucalyptus,while successfully amplifying all the loci inEucalyptopsisgroup, reflects rela-tive evolutionary distances, since the branch lengths for the
Eucalyptopsisgroup andEucalyptusrelative toCorymbia
were inconsistent between datasets (e.g., Hill and Johnson, 1995; Steaneet al., 2002; Wilsonet al., 2001; Parra-Oet al., 2006). This observation may indicate thatEucalyptusis a faster evolving clade, thereby accumulating more muta-tions in the flanking sequences of the SSRs. SSR analysis excludedArillastrumbecause available morphological and molecular data (Hill and Johnson, 1995; Udovicic and Ladiges, 2000; Wilsonet al., 2001; Steaneet al., 2002) put this genus the farthest fromCorymbiaamong the eucalypts; Ladiges et al.(2003) suggested, based on biogeography, that the divergence ofArillastrumfrom the other eucalypt genera may be as old as Late Cretaceous (70 MYA; see also Crispet al.(2004). These data suggested a potentially low prospect of transferringCorymbiaSSRs toArillastrum. Table 2- Numbers, size ranges and cumulative variances for SSR alleles observed in each informal group in this study. The observed number of alleles at each locus is given in parentheses. Cumulative variances are based on absolute allele sizes.
Marker Size range and number of alleles (in parentheses)
CorymbiaA1(N = 9) CorymbiaB2(N = 11) Angophora (N = 8) SEA3(N = 5) All (N = 33)
EMCRC26 26 (8) 44 (8) 30 (8) 25 (6) 46 (19)
EMCRC32 38 (12) 38 (6) 32 (8) 18 (4) 48 (28)
EMCRC39 98 (14) 84 (9) 78 (10) 16 (3) 98 (34)
EMCRC46 29 (12) 39 (18) 33 (8) 16 (5) 40 (30)
EMCRC51 46 (7) 44 (16) 10 (3) 40 (3) 64 (26)
EMCRC54 38 (9) 32 (11) 34 (6) 20 (4) 40 (18)
EMCRC93 38 (8) 14 (4) 14 (5) 16 (2) 38 (14)
Eg126 22 (8) 30 (5) 32 (8) 2 (2) 34 (20)
Mean 41.8 (9.7) 40.6 (9.6) 32.8 (7.0) 19.1 (3.6) 51 (23.6)
Average of means 33.6 (7.5) 51 (23.6)
Cum. variance 204 170 184 98 201
Total n. of alleles - (74) - (81) - (56) - (29) - (189)
genera
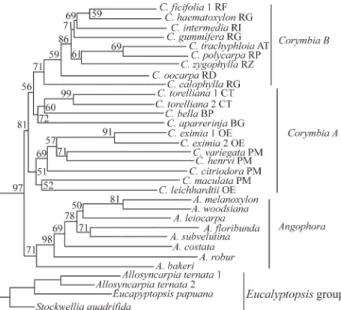
In this study, a Neighbour-Joining phylogenetic tree using both the average square and the standard genetic dis-tances from the 189 alleles, showedCorymbiato be mono-phyletic (Figure 1). The topologies and bootstrap values for trees from the two distance measures were nearly identical, so only one such tree is presented. The tree had three major clades in the ingroup. Angophora, and Corymbia both formed monophyletic groups with moderate (71% and 81% respectively) statistical confidence.Corymbiasplit into three major clades, two of which corresponded toCorymbiaA and B of Steaneet al.(2002). However, samples ofCorymbia
that were new in this study, (C. torelliana, C. bella) clustered withCorymbia B rather than CorymbiaA. The bootstrap support values for the partitioning of these three clades were, however, low. By pooling individual species into their tradi-tional taxonomic groups (according to Hill and Johnson, 1995) similar phylogenetic relationships (Figure not shown) were recovered with high bootstrap support (97%). A simu-lated inclusion of species in the wrong (taxonomic) group caused group paraphyly, indicating that taxonomic aberra-tions such as lumping or oversplitting can cause paraphyly in phylogenetic assemblages.
The Eucalyptopsis group (Stockwellia,
Eucalyptopsis, Allosyncarpia) was used as an outgroup be-causeEucalyptus, which would be an alternative outgroup forCorymbia-Angophora phylogeny, failed to amplify at four of the eight loci. The outgroup taxa formed a clade at the base of the tree, with the relationship (Stockwellia, Eucalyptopsis + Allosyncarpia). On flower development, the clade of these three rainforest genera had the
relation-al., 2002; Ladigeset al., 2003), which was also supported by Parra-Oet al.(2006) based on a combined data set of nrETS and ITS. The monophyly ofCorymbiahas previ-ously been proposed based on morphological and anatomi-cal characters (Hill and Johnson, 1995; Ladiges et al., 1995), and recently, by DNA data from the ETS (Parra-Oet al., 2006). However, data from ITS (Steane et al., 1999, 2002) and other regions of nrDNA and cpDNA (Udovicic
et al., 1995; Udovicic and Ladiges, 2000; Wilson et al., 2001; Whittocket al., 2003) were either equivocal or sug-gested that the group may be paraphyletic.
Intrageneric relationships
SSR data have resolved Corymbia B as a mono-phyletic group (Figure 1) and the topology within the group was similar to that obtained from ITS data (Steaneet al., 2002). The nesting of section Apteria (C. trachyphloia) withinRufariawas in agreement with results based on the ETS (Parra-Oet al., 2006) and ITS (Steaneet al., 2002) data. However, our results differ slightly from the ETS with regards to the relationships between sections Politaria, Ochraria and Blakearia. Whereas the ETS data show
OchrariaandBlakeariaas sister taxa relative toPolitaria, SSR data support the position ofOchrariaas more closely related toPolitariathan toBlakearia(Figure 1) revealed by morphological data analyses (Hill and Johnson, 1995). Parra-O et al., (2006) attribute this discrepancy to taxon sampling and the absence ofC. torellianain their dataset. Our study includedCadagaria(C. torelliana) and still sup-ported the closer relation betweenPolitariaandOchraria. As in all molecular data so far (ITS, trnL, trnH, psbA, ETS), SSR data suggests that Corymbia would be paraphyletic without the inclusion ofBlakearia, contrary to the classification of Brooker (2000).
The relationships within Politaria are inconsistent with previously published datasets (Hill and Johnson, 1995; Asanteet al., 2001; Steaneet al., 2002; McDonaldet al., 2000; King, 2004; Parra-Oet al., 2006), possibly re-flecting a high rate of interspecific hybridization among these taxa. In the SSR dataset, C. maculata was not the closest relative of C. variegata and C. henryi. ITS data (Steaneet al., 2002) showed the four spotted gums as being a clade, althoughC. maculatawas highly divergent, with eight base differences, whereas C. citriodora and C. variegatawere shown to be indistinguishable. Compared with ITS sequences (Steaneet al., 2002), the SSR data were more effective in resolving the relationships ofAngophora
species. ETS combined with ITS, however, were more in-formative than ITS alone (Parra-Oet al., 2006), and corrob-orated the SSR phylogeny.
SSRs were useful in eucalypt phylogeny
It is a widely held view that SSRs may not be useful in phylogenetic studies above the species level (e.g., Stre-Figure 1- Neighbour-Joining tree based on average square distance (δµ)2
elmanet al., 1998; Zhuet al., 2000). Hence it is not
ex-pected that SSRs would resolve among-genera
phylogenetic relationships in the eucalypts. However, anal-ysis of SSRs in this study recovered a tree topology congru-ent to those based on analyses of morphological characters and a combined ETS/ITS dataset. The following factors may explain why SSRs appear to retain informative phylo-genetic signals superior to some genomic regions such as the ITS:
Appropriate genetic distance measures
Homoplasy is expected under the stepwise mutation model (SMM, Kimura and Ohta, 1978), which assumes loss or gain, with equal probability, of a single repeat unit through mutation. However, the infinite allele model (IAM, Kimura and Crow, 1964) expects no homoplasy because a mutation is assumed to result in an allelic state not previ-ously encountered in the population. Several genetic dis-tances that make different assumptions have been developed for use with microsatellite data, however, the ap-propriateness of each of these distance methods will vary from case to case, depending on the model of microsatellite evolution, mutation rates, effective population size, and time since divergence. The ideal distance measure will therefore depend on the characteristics of the SSRs and on the phylogenetic question being addressed. Since it was not clear under what model the SSRs used in this study evolved, we used two genetic distance measures: the SMM model based average square distance (δµ)2; analogous to
D1) of Goldsteinet al.(1995), and Nei’s (1972) IAM based standard genetic distance (Gst). The average square
dis-tance (Goldstein et al., 1995) addresses size range con-straints, thereby accounting for homoplasy. The distance retains linearity with increasing evolutionary distance, and hence is suitable for reconstructing trees that include more distantly related taxa (Goldsteinet al., 1995; Pollocket al., 1998; Petrenet al., 1999; Ritz et al., 2000; Richard and Thorpe, 2001). This distance has been successfully used in recovering well-corroborated phylogenetic hypotheses in a number of studies involving divergent taxa (e.g., Petrenet al., 1999; Ritzet al., 2000; Richard and Thorpe, 2001). On the other hand, Nei’s (1972) distance is expected to become more linear while the linearity of average square distance wanes as the SSR mutations become more like the IAM model (Goldsteinet al., 1995). In theBovinistudy (Ritzet al., 2000) reviewed earlier,the authors used the genetic dis-tance measure, (δµ)2(Goldsteinet al., 1995) to account for size homoplasy. They found the measure to be robust de-spite fluctuations in population size, and retained linearity with increasing time. In our analysis, both distances recov-ered a similar tree topology. One way to explain this obser-vation is that the data comprised a minimum proportion of homoplasious alleles. Also, this may suggest that SSRs in eucalypts (albeitEucalyptus) evolve at a lower rate and are
highly conserved, both in the repeats and in the flanking re-gions.
Range constraint and size homoplasy
Homoplasy may arise due to (i) mutations in micro-satellite repeat region that result in alleles being similar in state but not by descent, and (ii) a constraint to the upper (and sometimes lower) bound on the number of repeat units at a locus may exacerbate homoplasy in the repeat region, as these size limits allow only a finite number of character states. (iii) Insertion and deletions in the flanking region making alleles similar in state but not by descent. At longer time intervals, homoplasy is expected to increase, while phylogenetic signals move to obscurity as saturation is ap-proached (Takazeki and Nei, 1996). Our data and results do not support a likelihood of phylogenetic signal saturation for the following reasons: (i) The average of the means of allele size range for each clade (CorymbiaA,CorymbiaB,
Angophora, Eucalyptopsis group) considered separately across all loci was (33.6), while the mean for all species combined was almost twice that value (51; Table 2). This suggested that saturation of phylogenetic signal through homoplasy due to range constraint was minimal because the allele size range of subgroups did not reach the total ob-served allele size range. (ii) The sizes of most alleles in the dataset differed by a number divisible by their repeat unit length, implying a low likelihood of homoplasy due to mu-tations in the regions flanking the repeats. Insertions and deletions should be equally likely to involve odd and even numbers of bases (iii) in theory, variation in the amount of size homoplasy is expected among SSR loci because varia-tion in mutavaria-tion rates reflects the stochasticity among loci of the coalescence process (Garza and Freimar, 1996). However, the bootstrap support for tree topology recovered in our analysis of eight SSRs reflected concordance among loci. Bootstrapping characters from loci with varied levels of homoplasy is expected to recover discordant phylogen-etic hypotheses, usually signified by low bootstrap values on the consensus tree.
‘Below threshold’ number of generations
firmed organismal phylogeny. Apart from the average square distance of Goldsteinet al.(1995), the authors uti-lized other distances such as Nei’s (1972)Gstand allele
sharing statistic (PSA) for comparison. Their data
contra-dicted the expectation that the SSR genetic distances may lose linearity after several thousands of generations, essen-tially due to range constraints in allele sizes (Feldmanet al., 1997). As the authors noted, the fact that the essentials of a well-corroborated tree can be reconstructed from such a relatively small number of loci argue for their utility in this area. As stated in the introduction, SSR length variation has also been used in reconstructing the phylogeny of Darwin’s finches, which are believed to have radiated at least three MYA, corresponding to over five million generations. (Pe-trenet al., 1999). Apart from the factors discussed above, eucalypts are tree species with temporal heterogeneity in outcrossing rates (Moran and Brown 1980) and flowering asynchrony that affects pollinator behaviour (Southertonet al., 2004). This may lower their effective population sizes (Ne). The risk of homoplasy would be less for taxa with
small effective population sizes (Estoupet al., 2002).
Sampling variance and phylogenetic reconstruction
We analysed the genetic distances among species, represented by a single individual in each case. There has been considerable discussion regarding the optimal sample size in population genetic analyses, with some workers rec-ommending large samples sizes to account for sampling variance (e.g., Nei, 1978; Ruzzante, 1998). In this study, pairwise genetic distance between individuals rather than allele frequencies are relevant. Kalinowski (2005) recently simulated the relationship between sample size, polymor-phism, and the coefficient of variation of genetic distances derived from microsatellite markers. He found that when the differentiation among the taxonomic units to be mea-sured is large, one or two samples per group would give similar results to a large sample size. Increasing sample size under a largeFSTscenario produced diminishing effect on
the coefficient of variation of the genetic distance. Kali-nowski’s simulated data showed that the rate at which in-creasing sample size decreased the coefficient of variation was determined principally by the amount of differentia-tion between populadifferentia-tions. This means that more individuals are necessary only when the degree of differentiation is low. In the case of eucalypt generaCorymbiaand Ango-phora, the differentiation in question is among species rather than just between populations of the same species. Hence the between species and between generaFSTvalues
are expected to be large since the two genera have diverged for tens of millions of years (Ladigeset al., 2003). Apart from SSRs, proteins have been used in phylogenetic recon-struction. Demastes and Remsen (1994) analysed allozyme variation to reconstruct the phylogeny of eight bird genera in the family Cardinalinae, using a single individual to
rep-ported phylogenetic analyses of morphological characters. As the authors noted, in a phylogenetic context the priority switches from more samples to more phylogenetic charac-ters (Demastes and Remsen, 1994, and references therein). We are aware that allozymes are less polymorphic com-pared to SSRs, however, Kalinowski’s (2005) simulation addresses this difference in variability and its implications. When we pooled samples into their prevailing taxonomic groups (according to Hill and Johnson, 1995) and con-ducted phylogenetic analysis as described for ungrouped samples, using the same distance measures and tree meth-ods, the tree topology recovered was congruent to that ob-tained for ungrouped samples. In part, grouping of samples into larger taxonomic assemblages catered for the few sam-ples per species (most species were represented by a single sample) analysed in the individual-specific distance mea-sures. Also, for grouped samples, we wanted to estimate the group effect for each taxonomic assemblage. If, for some reason, a species were classified under an assemblage where it does not belong in a molecular genetic sense, then we would expect to see a relationship shift in tree topology.
Acknowledgment
We thank Dean Nicolle of Currency Creek Arbore-tum, ACT and David Lee, DPI Queensland, Australia, for supplying tissues of some of the new samples used in this study. This work forms part of J.W. Ochieng’s Doctoral Research, supported by a Commonwealth Scholarship and an Australian Research Council Linkage grant LP0455522. Data analysed in this study can be obtained on ar-rangement with the communicating author.
References
Asante KS, Brophy JJ, Doran JC, Goldsack RJ, Hibbert DB and Larmour JS (2001) A comparative study of the seedling leaf oils of the spotted gums: Species of the Corymbia
(Myrtaceae), sectionPolitaria. Aust J Bot 49:55-66. Avise JC (2000) The History and Formation of Species. Harvard
University Press, Cambridge, Massachusets, 439 pp. Avise JC, Ankney CD and Nelson WS (1990) Mitochondrial gene
trees and the evolutionary relationship of mallard and black ducks. Evolution 44:1109-1119.
Bayly MJ and Ladiges PY (2007) Divergent paralogues of ribo-somal DNA in eucalypts (Myrtaceae). Mol Phylogenet Evol 44:346-356.
Brooker MIH (2000) A new classification of the genusEucalyptus
L’Her. (Myrtaceae). Aust Syst Bot 13:79-148.
Bruford MW and Wyne RK (1993) Microsatellites and their ap-plication to population genetic studies. Curr Opin Genet Dev 3:939-943.
Cavalli-Sforza LL and Edwards WF (1967) Phylogenetic analy-sis: Models and estimation procedures. Evolution 21:550-570.
Crisp M, Cook L and Steane DA (2004) Radiation of the Austra-lian flora: What can comparisons of molecular phylogenies across multiple taxa tell us about the evolution of diversity in present-day communities? Phil Trans R Soc B 359:1551-1571.
Demastes JW and Remsen Jr. JC (1994) The genus Caryon-thraustes (Cardinalinae) is not monophyletic. Wilson Bull 106:733-738.
Dumolin-Lapegue S, Demesure B, Fineschi S, Le Corre V and Pe-tit RJ (1997) Phylogeographic structure of white oaks throughout the European continent. Genetics 146:1475-1487.
Ellegren H, Primmer CR and Sheldon BC (1995) Microsatellite evolution: Directionality or bias in locus selection. Nat Genet 11:360-362.
Estoup A, Jarne P and Cornuet J-M (2002) Homoplasy and muta-tion model at microsatellite loci and their consequences for population genetics analysis. Mol Ecol 11:1591-1604. Feldman MW, Bergman A, Pollock DD and Goldstein DB (1997)
Microsatellite genetic distances with range constraints: Ana-lytical description and problems of estimation. Genetics 29:207-216.
Felsenstein J (1995) PHYLIP: Phylogeny Inference Package. University of Washington, Seattle.
Forbes SH, Hogg JT, Buchanan FC, Crawford AM and Allendorf FW (1995) Microsatellite evolution in congeneric mam-mals: Domestic and Bighorn sheep. Mol Biol Evol 12:1106-1113.
Garza JC and Freimer NB (1996) Homoplasy for size at micro-satellite loci in humans and chimpanzees. Genome Res 6:211-217.
Goldstein DB and Pollock DD (1997) Launching microsatellites: A review of mutation processes and methods of phylogen-etic inference. Heredity 88:335-342.
Goldstein DB, Roemer G, Smith D, Reich DE, Bergman A and Wayne R (1999) The use of microsatellite variation to infer population structure and demographic history in a natural model system. Genetics 151:797-801.
Goldstein DB, Ruiz LA, Cavalli-Sforza LL and Feldman MW (1995) An evaluation of genetic distances for use with microsatellite loci. Genetics 139:463-471.
Goudet J (2001) A computer program to calculateF-statistics. He-redity 86:485-456.
Hill KD and Johnson LAS (1995) Systematic studies in the eucalypts 7. A revision of the bloodwoods, genus Corymbia (Myrtaceae). Telopea 6:185-504.
Johnson LAS and Briggs BG (1984) Myrtales and Myrtaceae - A phylogenetic analysis. Ann Mo Bot Gard 71:700-756. Jones ME, Stokoe RL, Cross MJ, Scott LJ, Maguire TL and
Shep-herd M (2001) Isolation of microsatellite loci from spotted gum (Corymbia variegata), and cross-species amplification in Corymbia and Eucalyptus. Mol Ecol Notes 1:276-278. Kalinowski ST (2005) Do polymorphic loci require large sample
sizes to estimate genetic distances? Heredity 94:33-36. Kimura M and Crow JF (1964) The number of alleles that can be
maintained in a finite population. Genetics 49:725-738.
Kimura M and Ohta T (1978) Stepwise mutation model and distri-bution of allelic frequencies in a finite population. Proc Natl Acad Sci USA 75:2868-2872.
King R (2004) Spatial structure and population genetic variation in a Eucalypt species complex. PhD Thesis, Griffith Univer-sity, Australia.
Ladiges PY, Udovicic F and Drinnan AN (1995) Eucalypt phy-logeny - Molecules and morphology. Aust Syst Bot 8:483-497.
Ladiges PY and Udovicic F (2000) Comment on a new classifica-tion of the Eucalypts. Aust Syst Bot 13:149-152.
Ladiges PY, Udovicic F and Nelson G (2003) Australian bio-geographical connections and the phylogeny of large genera in the plant family Myrtaceae. J Biogeogr 30:989-998. Lu Y (2001) Roles of lineage sorting and phylogenetic
relation-ship in the genetic diversity at the self-incompatibility locus of Solanaceae. Heredity 86:195-205.
Maddison WP (1997) Gene trees in species trees. Syst Biol 46:523-536.
McCracken KG and Sorenson MD (2005) Is homoplasy or lineage sorting the source of incongruent mtDNA and nuclear gene trees in the stiff-tailed ducks (Nomonyx-Oxyura)? Syst Biol 54:35-55.
McDonald MW, Butcher PA, Bell JC and Larmour JS (2000) Intra- and interspecific allozyme variation in eucalypts from the spotted gum group, Corymbia, section ‘Politaria’ (Myrtaceae). Aust Syst Bot 13:491-507.
McKinnon GE, Steane DA, Potts BM and Vaillancourt RE (1999) Incongruence between chloroplast and species phylogenies inEucalyptussubgenusMonocalyptus(Myrtaceae). Am J Bot 86:1038-1046.
Moran GF and Brown AHD (1980) Temporal heterogeneity of outcrossing rates in alpine ash (Eucalyptus delegatensisR.T. Bak.). Theor Appl Genet 57:101-105.
Nei M (1972) Genetic distance between populations. Am Nat 106:283-292.
Nei M (1978) Estimation of average heterozygosity and genetic distance from a small number of individuals. Genetics 89:583-590.
Ochieng JW, Henry RJ, Baverstock PR, Steane DA and Shepherd M (2007) Nuclear ribosomal pseudogenes resolve a corrob-orated monophyly of the eucalypt genus Corymbia despite misleading hypotheses at functional ITS paralogs. Mol Phylogenet Evol 44:752-764.
Parra-O C, Bayly M, Udovicic F and Ladiges P (2006) ETS se-quences support the monophyly of the eucalypt genus Co-rymbia (Myrtaceae). Taxon 55:653-663.
Peakall R, Gilmore S, Keys W, Morgante M and Rafalski A (1998) Cross-species amplification of soybean (Glycine max) simple sequence repeats (SSRs) within the genus and other Legume genera: Implications for the transferability of SSRs in plants. Mol Biol Evol 15:1275-1267.
Petren KB, Grant R and Grant PR (1999) A phylogeny of Dar-win’s finches based on microsatellite DNA length variation. Proc R Soc London B 266:321-329.
Eucalypts. Australian National University Press, Canberra, 102 pp.
Richard M and Thorpe RS (2001) Can microsatellites be used to infer phylogenies? Evidence from population affinities of the western Canary Island lizard (Gallotia galloti). Mol Phylogenet Evol 20:351-360.
Ritz LR, Glowatzki-Mullis ML, MacHugh DE and Gaillard C (2000) Phylogenetic analysis of the tribe Bovini using microsatellites. Anim Genet 31, 178-185.
Rodrigo AG, Kelly-Borges M, Bergquist PR and PL Bergquist (1993) A randomization test of the null hypothesis that two cladograms are sample estimates of a parametric phylogen-etic tree. New Zeal J Bot 31:257-268.
Rubinstein DC, Amos W, Leggo J, Goodburn S, Jain S, Li S-H, Margolis RL, Ross CA and Ferguson-Smith MA (1995) Microsatellite evolution - Evidence for directionality and variation in rate between species. Nat Genet 10:337-343. Ruzzante DE (1998) A comparison of several measures of genetic
distance and population structure with microsatellite data: Bias and sampling variance. Can J Fish Aquat Sci 55:1-14. Shepherd M, Kasem S, Lee D and Henry R (2006) Construction of
microsatellite genetic linkage maps for Corymbia. Silvae Genet 55:228-238.
Southerton SG, Birt P and Ford HA (2004) Review of gene move-ment by bats and birds and its potential significance for eucalypt plantation forestry. Aust For 67:44-53.
Steane DA, McKinnon GE, Vaillancourt RE and Potts BM (1999) ITS sequence data resolves higher level relationships among the eucalypts. Mol Phylogenet Evol 12:215-223.
Steane DA, Nicolle D, McKinnon GE, Vaillancourt RE and Potts BM (2002) Higher-level relationships among the eucalypts are resolved by ITS-sequence data. Aust Syst Bot 15:49-62. Streelman JT, Zardoya R, Meyer A and Karl SA (1998)
Multi-locus phylogeny of cichlid fishes (Pisces, Perciformes): Evolutionary comparison of microsatellite and single-copy nuclear loci. Mol Biol Evol 15:798-808.
Takahashi K, Terai Y, Nishida M and Okada N (2001) Phylogen-etic relationships and ancient incomplete lineage sorting
analysis of the insertion of retroposons. Mol Biol Evol 18:2057-2066.
Takezaki N and Nei M (1996) Genetic distances and reconstruc-tion of phylogenetic trees from microsatellite DNA. Genet-ics 144:389-399.
Thamarus KA, Groom K, Murrel J, Byrne M and Moran GF (2002) A genetic linkage map forEucalyptus globuluswith candidate loci for wood, fibre, and floral traits. Theor Appl Genet 104:379-387.
Udovicic F and Ladiges PY (2000) Informativeness of nuclear and chloroplast DNA regions and the phylogeny of the eucalypts and related genera (Myrtaceae). Kew Bullet 55:633-645.
Udovicic F, McFadden GI and Ladiges PY (1995) Phylogeny of Eucalyptus and Angophora based on 5S rDNA spacer se-quence data. Mol Phylogenet Evol 4:247-256.
Whittock S, Steane DA, Vaillancourt RE and Potts BM (2003) Molecular evidence shows that the tropical boxes ( Eucalyp-tussubgenusMinutifructus) are over-ranked. Trans R Soc S Aust 127:27-32.
Whitton J, Rieseberg LH and Ungerer MC (1997) Microsatellite loci are not conserved across the Asteraceae. Mol Biol Evol 14:204-209.
Wilson PG, O’Brien MM, Gadek PA and Quinn CJ (2001) Myrtaceae revisisted: A reassessment of infrafamilial groups. Am J Bot 88:2013-2025.
Zhu Y, Queller DC and Strassmann JE (2000) A phylogenetic per-spective on sequence evolution in microsatellite loci. J Mol Evol 50:324-338.
Zink RM (2002) A new perspective on the evolutionary history of Darwin’s finches. The Auk 119:864-871.
Internet Resources
MICROSAT programme: Human Population Genetics Labora-tory (HPGL), Stanford University http://hpgl.stanford.edu/. TREEVIEW Version 1.5 http://taxonomy.zoology.gla.ac.uk/
rod/.