FREE THEMES
External control of fluoridation in public water supply systems
in the state of Goiás, Brazil
Abstract The addition of fluoride to the public water supply is a method used for reducing tooth decay. In this sense, the control of fluoridation is important for maintaining its efficiency and, at the same time, for avoiding the risk of fluoro-sis as a result of the consumption of water with excess of fluoride. The objective of this study was to evaluate the adequacy of fluoride levels in the water distributed to populations of the state of Goiás, Brazil. Towards this aim, 5,039 water samples collected between 2011 and 2013 in 225 municipalities of the state of Goiás were ana-lyzed for fluoride level. The results were assessed with regard to season, type of water source and geographic location. Fluoride levels were found to vary between complete absence and 2.5 mg F/L, with 28.2% of the samples being between 0.6 and 0.8 mg F/L, and 39.1% between 0.55 and 0.84 mg F/L. The rainy season produced a greater num-ber of atypical results and higher values than the dry period. The systems supplied by groundwater sources were shown to have a limited control of fluoride concentration compared to systems sup-plied by surface water sources. Lower concentra-tions of fluoride were found in samples collected in the North and East Mesoregions of Goiás, with less than 7.5% being between 0.6 and 0.8 mg F/L, which systems are mainly supplied by groundwa-ter sources with fluoride addition.
Key words Fluorosis, Fluoride, Caries, Water
treatment
Paulo Sérgio Scalize 1
Roberta Vieira Nunes Pinheiro 2
Humberto Carlos Ruggeri Junior 3
António Albuquerque 2
Germán Sanz Lobón 1
Poliana Nascimento Arruda 1
1 Programas de Pós- Graduação em Engenharia Ambiental e Sanitária e Ciências Ambientais, Universidade Federal de Goiás. Av. Universitária 1488, Setor Universitário. 74605- 220 Goiânia GO Brasil.
Scaliz Introduction
During the last century, fluoridation has been a public health measure used in the control of den-tal caries in countries throughout the world and is recognized as an important factor in their de-cline in the prevalence. The first research on the use of fluoride focused on water because it is a re-source that is easily accessible to the population; however, with technical-scientific development and improved conditions of hygiene, this prac-tice has been reduced in many countries. Howev-er, the USA and Brazil have continued the prac-tice of adding fluoride to the water intended for public supply1, which is recommended because of its safety, ease of administration, low cost and population coverage, making it one of the most effective means of keeping the presence of fluo-ride in the oral cavity, which is fundamental to the control of dental caries1,2. However, entities such as WHO warn of the risk that concentra-tions greater than 1.5 mg F/L3,4 can cause the ap-pearance of fluorosis in human health.
In Brazil, fluoride has also been added to more than 90% of the dentifrices since 19895, in-creasing the risk of fluorosis due the association of daily exposure to fluoride by these two sourc-es, as verified by Lima and Cury6. Despite the risks, water fluoridation has been justified by the rates of reduction of the caries index reported in more than 160 works distributed over more than 10 countries7. Despite these advances, the Cen-tral-West Region of Brazil still has frequencies of dental caries in permanent dentition reaching 73% of children of 12 years of age, and 90% of adolescents of 15 to 19 years old (Carious, Miss-ing and Filled Permanent Teeth - COP-D ≥ 1) 8. In studies conducted by Freire et al.9, a COP-D ≥ 1 was found in 64% of 1947 12-year old children analyzed in the city of Goiâna (GO). According to Clarkson and McLoughlin10, in order to max-imize benefits and minmax-imize risks, there must be mechanisms that allow the addition of fluoride in adequate concentrations so that it exerts the greatest possible impact on the prevention and control of caries, without increasing the preva-lence of dental fluorosis since, as observed by Cangussu et al.11, milder forms of dental fluoro-sis occur at the places where fluoridation systems had been implemented and more severe forms occur were the source water has high fluoride content. It should be taken into consideration that, in the case of Brazil, some municipalities do not have the means to add fluoride or the surveil-lance mechanisms to control its concentration in
public water supply systems. In this sense, exter-nal control appears to be an important instru-ment for managing the level of fluoride in water supplies, and should be applied in all the supply systems.
Heterocontrole is a term used in Brazilian public health and is commonly applied to stud-ies related to water fluoridation12-18. According to Narvai19, the term was used for the first time by this author in a course of “Preventive Dentistry” that was the object of the VII Congresso Uni-versitário Brasileiro de Odontologia (CUBO; 7th Brazilian University Congress of Odontology)20.
Heterocontrole, or external control in English, is understood to be “the principle that any good or service that implies risk or represents a protec-tion factor for public health requires, in addiprotec-tion to control by the producer, control by State insti-tutions over the process of its production, distri-bution and consumption”. Thus, the objective of the present study was to evaluate the adequacy of fluoride levels in the water distributed to cities of the state of Goiás, managed by Companhia Es-tadual de Saneamento (Saneago; State Sanitation Company), and to assess variation in fluoride levels among types of water sources, seasons and mesoregions.
Materials and methods
According to data from the Instituto Brasileiro de Geografia e Estatística (Brazilian Institute of Geography and Statistics)21, the state of Goiás possesses 6,004,045 inhabitants in 246 munici-palities, of which 225 have their sanitation ser-vices provided by Saneago, and are the objects of the present study (Figure 1b). The remainder of the municipalities have direct public administra-tion22 of sanitation services and are not consid-ered in this study.
e C
ole
tiv
a,
23(11):3849-3860,
2018
of the population of the state of Goiás. Group II is comprised of municipalities with populations between 50,000 and 250,000 inhabitants, and where 15 to 20 samples were collected every three months. Together, the thirteen municipalities in this group have 1,384,299 inhabitants, which represents 23.1% of the total population of the state. The third group, Group III, is comprised of municipalities with populations less than 50,000 inhabitants, and where 3 to 8 samples were col-lected every six months. Although this group contains 208 municipalities, its total population is less than the combined total of the other two groups. Considering that there was practically no decrease in fluoride concentration throughout the distribution of water24, the number of sam-ples was determined in the same way as Moimaz et al.25, which collected at least 3 samples in each system, composed of one at the beginning of the water distribution network, one in the interme-diate area of the network and a third at the end, in order to be able to assess the entire system at the time the treated water is made available for consumption. Other points of collection were added according to the size of the municipality, with sampling points being added at places where there is a great flow of people, such as hospitals, health posts, schools and day care centers26.
The collection and preservation of samples were performed according to the Guia Nacional de Coleta e Preservação de Amostras
(Nation-al Guide for the Collection and Preservation of Samples)27. Samples were then submitted to a single analysis (simple analysis) of fluoride using the Spadns method, as recommended by Stand-ard Methods28, using a Hach DR 890 colorimeter. The data were analyzed considering the type water source (surface water or groundwater) and mesoregion as determined by the IBGE classifi-cation regulated by Presidential Resolution of the Republic (PR) No. 11, of 05 June, 1990, which included ranges of the average maximum tem-peratures and the 34 climatic stations used in the research (Figure 1c). The temperature ranges were obtained from mean monthly maximum temperature data from the climatic stations pro-vided by the Sistema Estadual de Geoinformação – SIEG (State System of Geoinformation)29. For the calculation of isotherms, the annual average of the maximum temperatures was determined and interpolated by Kriging Simple interpola-tion. The results serve to illustrate differences in maximum temperatures throughout the state of Goiás, but this should not be considered a valid geostatistical model due to the few data points included and their spatial distribution. The management, handling, analysis and representa-tion of cartographic data were performed using ArcGis 10.2.
Scaliz 197630, which establish an optimum content of
0.70 mg F/L (+0.10 mg F/L) as a function of the average temperature of the region, complement-ed with the ranges proposcomplement-ed by Ramires31 and used by Panizzi and Peres32 and Ramires at al.13, which admit variation in the optimum fluoride concentration of 0.15 mg F/L for the lower lim-it and 0.14 mg F/L for the upper limlim-it, making the maximum permissible content 1.50 mg F/L established by Ordinance MS 291426, which is
also the value recommended by WHO3. Thus,
the ranges of fluoride content used were: < 0.54 mg F/L = Unacceptable; 0.55 mg F/L = Accept-able Minimum; 0.55 to 0.59 = Subfluoride; 0.60 to 0.80 = Optimum; 0.81 a 0.84 = Superfluoride; 0.84 = Acceptable Maximum; 0.85 to 1.5 = Inad-equate; > 1.50 = Unacceptable.
Aiming to assess seasonal interference in the maintenance of fluoride content in the water dis-tributed to the public, the results were analyzed considering two seasonal periods: a rainy peri-od (January to March and October to Decem-ber) and a drought period (April to SeptemDecem-ber). Thus, of the 5,039 samples, 2,226 were collected during the rainy period and 2,813 during the drought period.
The results of the fluoride analyses were treated statistically with XLSTAT, by obtaining the following statistics: mean, median, standard deviation and coefficient of variation, for which boxplot type graphs were constructed with a confidence interval of 95%, enabling the verifi-cation of discrepant values for each parameter analyzed .
Results and discussions
General analysis
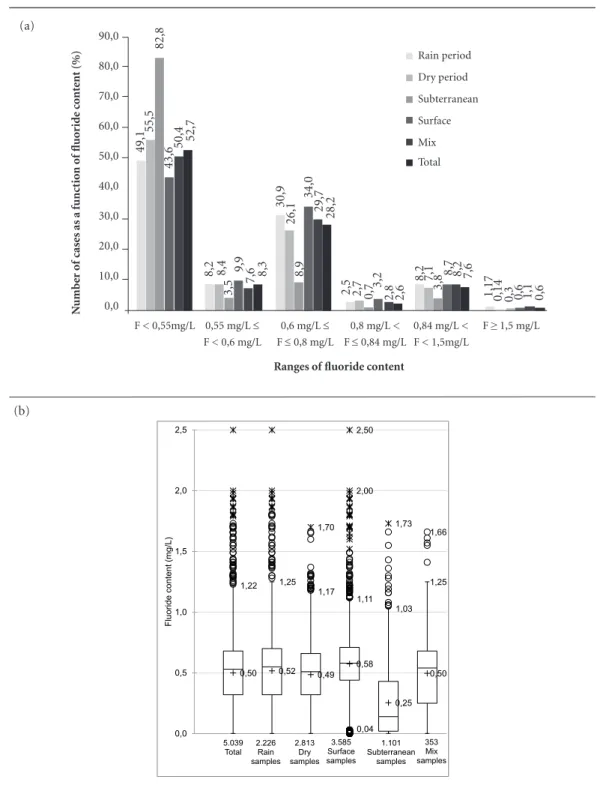
In general, fluoride content was found to vary greatly among the analyzed samples, with a high incidence of fluoride levels below the minimum established for effectiveness in caries prevention, with only 28.2% of the analyzed samples (Figure 2a) having fluoride content within the range of 0.60 to 0.80 mg F/L30.
The overall analysis of the fluoride concen-tration of the 5,039 samples found it to vary from being absent to concentrations of 2.50 mg F/L, with values above 1.22 mg F/L are considered atypical samples as a function of the amount and content of fluoride found in the evaluated sam-ples. The overall mean fluoride concentration was 0.50 mg F/L with a median of 0.53 mg F/L
(Figure 2b). Of all the samples, 3,617 (71.8%), had fluoride contents lower or higher than the limits of Ordinance No. 63530, with 3,073 samples (61.0%) being below 0.60 mg F/L and 544 sam-ples (10.8%) being above 0.80 mg F/L. The per-centage of samples below 0.55 mg F/L and above 0.84 mg F/L, were 52.7% and 8.2% respectively. A further 0.60% of the samples were found to have levels above the maximum limit established by the Ordinance No. 291426, which is 1.50 mg F/L, reaching a maximum of 2.5 mg F/L. According to Frazão et al.5, the limit of 1.50 mg F/L is adopted by most countries in South America and by the WHO. Peixoto et al.16, considered values above 1.45 as being at a very high risk for the develop-mental of dental fluorosis. These values may be lower depending on the climate of a particular region, because increased water consumption in warmer regions means increased fluoride ex-posure. This was the conclusion made by Craig et al.33 in a study carried out in Ghana (average temperature of 29°C), where the limit was 0,60 mg F/L for children 6 to 8 years old, less than 0.60 mg F/L for children less than 2 years old and 1.0 mg F/L for older children and adults.
The average fluoride content of 0.50 mg F/L (Figure 2b) in the present study is close to the mean of 0.55 mg F/L found by Peixoto et al.16, who evaluated fluoride concentrations in the water supply of the municipality of Juguaribara, Ceará, and the mean of 0.57 mg F/L found in re-search performed with 5,157 water samples from the municipality of Araçatuba, São Paulo, by Daré et al.34. Ramires et al.13, analyzed 737 water sam-ples from throughout the population of the city of Bauru, São Paulo, and found monthly mean fluoride concentrations to vary between 0.37 and 1.00 mg F/L, with about 85% of the sample means being between 0.55 and 0.84 mg F/L, and an average value of 0.75 mg F/L. This variation demonstrates the difficulty in maintaining flu-oride content within standards, as was also re-ported by Leivas et al.35 in the city of Canoas, Rio Grande do Sul, and indicates the need for greater operational control.
Analysis of the type of water source and seasonality
e C
ole
tiv
a,
23(11):3849-3860,
2018
Figure 2. Results of the analysis of samples according to fluoride concentration, seasonality and water source. Rain period
Dry period Subterranean Surface Mix Total 90,0
80,0 70,0 60,0 50,0 40,0 30,0 20,0 10,0 0,0
F < 0,55mg/L 0,55 mg/L ≤ F < 0,6 mg/L
0,6 mg/L ≤ F ≤ 0,8 mg/L
0,8 mg/L < F ≤ 0,84 mg/L
0,84 mg/L < F < 1,5mg/L
F ≥ 1,5 mg/L
Ranges of fluoride content
N
umb
er o
f cases as a funct
io
n o
f fluo
rid
e c
o
nt
ent (%)
(a)
49,1
55,5
82,8
43,6
50,4 52,7
8,2 8,4
3,5
9,9
7,6 8,3
30,9
26,1
8,9
34,0
29,7 28,2
2,5 2,7 0,7 3,2 2,8 2,6 8,2 7,1
3,8 8,7 8,2 7,6
1,17 0,14 0,3 0,6 1,1 0,6
(b)
mg F/L, with atypical samples from 1.25 mg F/L to a maximum of 2.5 mg F/L (Figure 2b). In the dry period, the results were lower, with an aver-age of 0.49 mg F/L and atypical samples from 1.17 mg F/L to a maximum of 1.7 mg F/L (Figure
2b). In the rainy period, 1.17% of the samples were found to have fluoride content higher than the limit of 1.5 mg F/L, established by Ordinance No. 291426. This value is well above the 0.14% de-tected during the dry season (Figure 2a),
demon-1,22 1,25
1,17 1,11
0,04 1,03
1,25
0,50 0,52 0,49 0,58
0,25 0,50 1,66 1,70
2,00 2,50
1,73
5.039 Total
2.226 Rain samples
2.813 Dry samples
3.585 Surface samples
1.101 Subterranean
samples 353 Mix samples 0,0
0,5 1,0 1,5 2,0 2,5
Fluoride
c
ont
ent
(mg/
L)
Scaliz strating the greater difficulty to control the
fluo-ride level in the rainy season.
As for the analysis of the type of water source, 86.3% of the analyzed samples from locations supplied by groundwater catchments with the addition of fluoride possessed concentrations below 0.60 mg F/L (Figure 2a). Such low levels are probably due to the difficulty in maintaining fluoridation without having a treatment opera-tor on site or the implementation of some sys-tem that allows it to be controlled. This problem does not occur in the Water Treatment Station (WTS), which precede the systems of water sup-ply from surface water sources because they con-stantly have operators in the stations. However, Lima et al.12, verified that constancy in monthly fluoride concentration was almost impossible in most of the WTS analyzed. The lack of operator training, variation in flow throughout the distri-bution network and problems with the hydraulic equipment are factors that contribute to these oscillations36. Indeed, 53.5% of the samples col-lected at sites receiving water supply from surface water sources had a fluoride content below 0.60 mg F/L, and 34% were between 0.6 and 0.8 mg F/L, with a mean value of 0.58 mg F/L (Figure 2b), which is slightly below that found by Mo-imaz et al.25, which were between 0.61 and 0.66 mg F/L for surface water sources. Yet, in systems where there is a simultaneous supply of ETA and groundwater these waters mix, either inside the reservoir or in the distribution network, which allows greater control of the fluoride content, and keeps it close to that achieved in systems sup-plied only by water from WTS.
Regardless of the source of supply, the dry period has a higher incidence of samples with fluoride contents below 0.60 mg F/L, with a dis-placement of the values above 0.80 mg F/L, for the range between 0.60 and 0.80 mg F/L (Figure 3a). It can be seen in Figure 3b that in the dry season there was, in addition to lower values, a lower number of atypical results than in the rainy season, with mean values approaching the medi-an in both situations. Lima et al.12 found that var-iation in fluoride concentration usually occurs in the treatment units and, therefore, the effect of temperature and the type of material used in the dosages tend to be more significant than other physical phenomena, such as absorption or ad-sorption to the walls of the pipes of the distribu-tion system.
Analysis by mesoregion considering the type of water source and seasonality
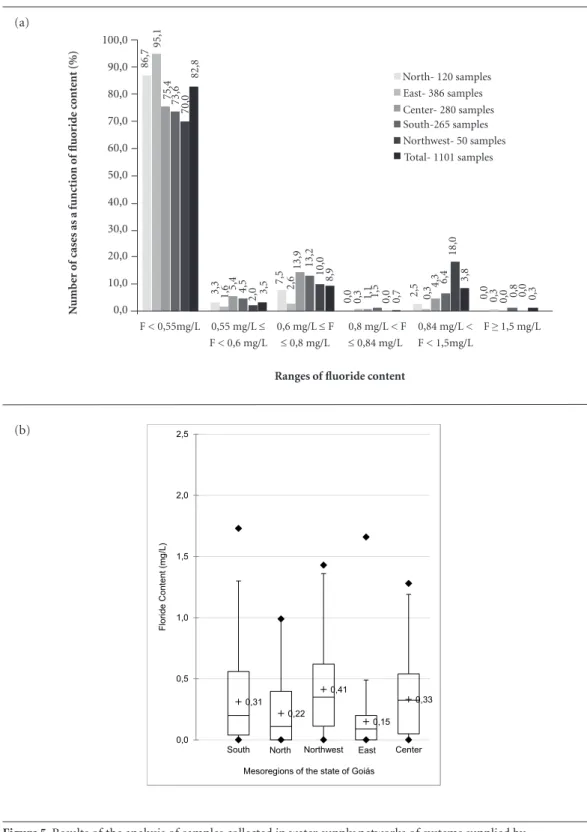
The analysis of fluoride content among the 5 mesoregions showed that the lowest concen-trations for treated surface water sources are in the North and East mesoregions of Goiás with, respectively, 60% and 59.5%, of the samples hav-ing concentrations below 0.55 mg F/L (Figure 4a). Likewise, these same mesoregions also had higher incidences of samples below 0.55 mg F/L for treated water of groundwater sources, with 86.7% and 95.1%, respectively (Figure 5a). The mean concentrations found for these sources ranged from 0.48 to 0.62 mg F/L for treated wa-ter for surface sources (Figure 4b) and from 0.15 to 0.41 mg F/L treated water from groundwater sources (Figure 5b). It should be noted that the monthly mean of the means of the maximum daily temperatures registered in the climatic station of the North mesoregion of Goiás were between 31.3°C (January) and 35.0°C (Septem-ber), which indicates a higher volume of water consumed daily, necessitating a lower fluoride content in the water. However, the content is still low compared to the values recommended by the Ordinance No. 635/GM/MS30.
Analysis of the size of the supplied population
When analyzing the results according to pop-ulation size, it was found that municipalities of Group I had greater quantities of samples with values between 0.60 and 0.80 mg/L (36.38%). In this group, 49.21% of the samples had values between 0.55 and 0.84 mg/L, while for the mu-nicipalities of Groups II and III the percentages were 27.43% and 42.39%, respectively. This dif-ference in values reflects the greater attention of the managing body in larger municipalities. The municipalities of Group II had a low number of samples within this range, with 61.97% below 0.55 mg/L, because some municipalities of this group are supplied with non-fluoridated water from a groundwater source.
Final considerations
fluo-e C
ole
tiv
a,
23(11):3849-3860,
2018
1,10
0,03
1,11
0,05
1,0 1,06
0,56 0,59
0,25 0,27
1,70
2,50
1,66
1,73
2.022 Surface dry
samples 1.563 Surface rain
samples 598 Subterranean
dry samples 503 Subterranean rain samples 0,0
0,5 1,0 1,5 2,0 2,5
F
louride
c
ont
ent
(m
g/
L)
(b)
rosis in a population served by a municipality. In addition, the distribution of water with a less than optimal fluoride concentration implies a waste of public resources and inefficient efforts
of prevention. These shortcomings demonstrate the need for effective external control, corrobo-rating Panizzi and Peres32, who report that after a political-legal intervention carried out by the Figure 3. Results of the analysis of samples according to fluoride concentration, type of water source used for treatment and seasonality.
Surface- Dry Surface- Rain Subterranean- Dry Subterranean- Rain 90,0
80,0 70,0 60,0 50,0 40,0 30,0 20,0 10,0 0,0
Ranges of fluoride content
N
umb
er o
f cases as a funct
io
n o
f fluo
rid
e c
o
nt
ent (%)
(a)
46,2
40,2
85,3
79,9
10,0 9,7 3,7 3,2
31,6
37,1
8,5 9,3
3,3 3,0 0,3 1,2
8,7 8,6 2,0 6,0
0,1 1,3 0,2 0,4
F < 0,55mg/L 0,55 mg/L ≤ F < 0,6 mg/L
0,6 mg/L ≤ F
≤ 0,8 mg/L
0,8 mg/L < F
≤ 0,84 mg/L
0,84 mg/L < F < 1,5mg/L
F ≥ 1,5 mg/L
Scaliz
0,61
0,48 0,62
0,50 0,59
South North Northwest East Center
0,0 0,5 1,0 1,5 2,0 2,5
F
luoride
C
ont
ent
(m
g/
L)
(b) Mesoregions of the state of Goiás
sanitary surveillance system in the municipality of Chapecó, Santa Catarina, changes occurred in the operating and maintenance system that resulted in significant improvements, with a
change of 26% to 49% of the samples having flu-oride content within the range of 0.7 a 0.9 mg F/L, established by Ordinance No. 635/GM/MS30 for that region, which admits variation of 0.10 Figure 4. Results of the analysis of samples collected in water supply networks of systems supplied by surface sources, according to mesoregions and ranges of fluoride concentration.
North- 180 samples East- 674 samples Center- 1545 samples South- 953 samples Northwest- 232 samples Total- 3585 samples 70,0
60,0
50,0
40,0
30,0
20,0
10,0
0,0
F < 0,55mg/L 0,55 mg/L ≤ F < 0,6 mg/L
0,6 mg/L ≤ F ≤ 0,8 mg/L
0,8 mg/L < F
≤ 0,84 mg/L
0,84 mg/L < F < 1,5mg/L
F ≥ 1,5 mg/L (a)
60,0 59,5
39,6
38,4
33,2
43,6
9,4 8,9 9,3 11,4 10,3 9,9 21,7 21,2
37,3 39,0 38,4
34,0
3,3
1,6
4,0
2,2
6,0
3,2 5,0 8,5 9,8 6,9
12,1
8,7
0,6 0,3 0,1 2,0 0,0 0,6
Ranges of fluoride content
N
umb
er o
f cases as a funct
io
n o
f fluo
rid
e c
o
nt
ent (%)
e C
ole
tiv
a,
23(11):3849-3860,
2018
0,31 0,22
0,41
0,15 0,33
South North Northwest East Center
0,0 0,5 1,0 1,5 2,0 2,5
F
lorid
e
C
ontent (m
g/L)
(b) Mesoregions of the state of Goiás
mg F/L as a function of the optimum content according to the local temperature range. In the present study, the increase in efficiency of fluor-idation ranged from 40% to 63% and from 36%
Figure 5. Results of the analysis of samples collected in water supply networks of systems supplied by groundwater sources, according to mesoregions and ranges of fluoride concentration.
North- 120 samples East- 386 samples Center- 280 samples South-265 samples Northwest- 50 samples Total- 1101 samples 100,0
90,0 80,0 70,0 60,0 50,0 40,0 30,0 20,0 10,0 0,0
F < 0,55mg/L 0,55 mg/L ≤ F < 0,6 mg/L
0,6 mg/L ≤ F
≤ 0,8 mg/L
0,8 mg/L < F
≤ 0,84 mg/L
0,84 mg/L < F < 1,5mg/L
F ≥ 1,5 mg/L (a)
86,7
95,1
75,4 73,6
70,0
82,8
3,3 1,6 5,4 4,5 2,0 3,5 7,5 2,6 13,9 13,2
10,0 8,9
0,0 0,3 1,1 1,5 0,0 0,7 2,5 0,3 4,3 6,4
18,0
3,8
0,0 0,3 0,0 0,8 0,0 0,3
Ranges of fluoride content
N
umb
er o
f cases as a funct
io
n o
f fluo
rid
e c
o
nt
ent (%)
(b)
to 61%, for the ranges of 0.7 to 1.0 mg F/L and 0.65 mg F/L to 0.94 mg F/L, respectively.
Scaliz (AGR; Goiás Agency of Regulation), which is
re-sponsible for regulating the services provided by the Companhia Estadual de Saneamento (Sanea-go; State Sanitation Company). In this way, con-trol would be in line with the recommendations of Panizzi and Peres32, who suggest the operation by public or private entities or institutions, or both, other than water supply companies.
However, it should also be noted that Ordi-nance No. 635/GM/MS30 was supported by the equation proposed by Galagan and Vermillion37, who considered the conditions of water con-sumption by the Brazilian population to be the same as that of the population of the USA, being based only on the average of the daily maximum temperatures. In this context, some studies have proposed adjustments to the equation to take into account local situations and conditions. This circumstance was validated by Ramadan and Hil-mi38, who inserted a coefficient of adjustment of 0.56, considering that the only liquid source of fluoride for the population was water, and dis-counted the portion (44%) of liquid obtained from milk included by Galagan and Vermillion37. This resulted in an ideal fluoride content for the population of Sudan of between 0.32 and 0.35 mg F/L, which differed widely from the 0.61 mg F/L initially calculated only considering the mean maximum local temperature of 35.58°C. The same was done in Chile by Villa et al.39, who
con-cluded that the ideal range was 0.50 to 0.60 mg F/L for a local average of maximum temperatures ranging from 18 to 22°C.
Conclusions
The present work allowed us to conclude that: - there are difficulties in maintaining fluoride concentrations in the municipalities studied, which reinforces the need for external control with public entities helping in the regulation of water supply systems for effective control of wa-ter fluoride content;
- a greater number of samples had fluoride contents above 0.60 mg F/L (42.8%) in the rainy season than in the dry season (36%);
- systems supplied with water from only groundwater sources with the addition of fluo-ride had the lowest levels of fluofluo-ride in the water supplied to the population;
- the five mesoregions of Goiás differed in the fluoride content of their water samples, with lower values being found in the North and East Regions of Goiás;
e C
ole
tiv
a,
23(11):3849-3860,
2018
Collaborations
PS Scalize was responsible for designing the work, confection of the graphs, analysis and in-terpretation of the data. The critical writing was in charge of A Albuquerque who also contributed in the discussion of the results and conclusion of the work. RVN Pinheiro and HC Huggeri Junior were responsible for reviewing the bibliography and discussing the data and completing the work. G Sanz Lobon was in charge of the elaboration of the thematic maps and aid in the experimental design and also the discussion of the results. PN Arruda assisted in the discussion of the data.
References
1. Ramires I, Buzulaf MAR. A fluoretação da água de abastecimento público e seus benefícios no controle da cárie dentária: cinquenta anos no Brasil. Cien Saude Colet 2007; 12(4):1057-1065.
2. Cury JA, Tabchoury CPM. Determination of appropri-ate exposure to fluoride in non-EME countries in the future. J Appl Oral Sci 2003; 11(2):83-95.
3. World Health Organization (WHO). Guidelines for drinking-water quality: recommendations. 3th ed. Gene-va: WHO; 2004. v.1.
4. Fawell J, Bailey K, Chilton J, Dahi E, Fewtrell L, Maga-ra Y. Fluoride in drinking water. Geneva: World Health Organization; 2006.
5. Frazão P, Peres MA, Cury JA. Drinking water quality and fluoride concentration. Rev Saude Publica 2011; 45(5):964-973.
6. Lima YBO, Cury JA. Ingestão de flúor por crianças pela água e dentifrício. Rev Saude Publica 2001; 35(6):576-581.
7. Rugg-Gunn AJ, Do L. Effectiveness of water fluorida-tion in caries prevenfluorida-tion. Community Dent Oral Epide-miol 2012; 40(s2):55-64.
8. Brasil, Ministério da Saúde (MS). Projeto SB Brasil 2003 – Condições de saúde bucal da população brasileira 2002–2003: resultados principais. Brasília: MS; 2004. 9. Freire MCM, Reis SCGB, Gonçalves MM, Balbo PL,
Leles CR. Condição de saúde bucal em escolares de 12 anos de escolas públicas e privadas de Goiânia, Brasil. Rev Panam Salud Publica 2010; 28(2):86-91.
10. Clarkson JJ, McLoughlin J. Role of fluoride in oral health promotion. International Dent J 2000; 50(3):119-128.
11. Cangussu MCT, Narvai PC, Fernandez RC, Djehizian V. A fluorose dentária no Brasil: uma revisão crítica. Cad Saude Publica 2002; 18(1):7-15.
12. Lima FG, Lund RG, Justino LM, Demarco FF, Del Pino FAB, Ferreira R. Vinte e quatro meses de heterocontrole da fluoretação das águas de abastecimento público de Pelotas, Rio Grande do Sul, Brasil. Cad Saude Publica 2004; 20(2):422-429.
13. Ramires I, Maia LP, Rigolizzo DS, Lauris JRP, Buzalaf MAR. External control over the fluoridation of the public water supply in Bauru, SP, Brazil. Rev Saude Pu-blica 2006; 40(5):883-889.
14. Silva JS, Melo do Val C, Costa JN, Moura MS, Silva TAE, Sampaio FC. Heterocontrole da fluoretação das águas em três cidades no Piauí, Brasil. Cad Saude Pu-blica 2010; 23(5):1083-1088.
15. Toassi RFC, Kuhnen M, Cislaghi GA, Bernardo JR. He-terocontrole da fluoretação da água de abastecimento público de Lages, Santa Catarina, Brasil. Cien Saude Colet 2007; 12(3):727-732.
16. Peixoto DF, Alencar KP, Peixoto RF, De Sousa CFM, Sampaio FC, Forte FDS. Heterocontrole da fluoretação da água de abastecimento público do município de Ja-guaribara, Ceará, Brasil. Rev Bras Promoç Saude 2012; 25(3):271-277.
17. Vidal SG, Tovo MF, Kramer PF, Ruschel HC, Ferreira EH. Heterocontrole da fluoretação de águas de abaste-cimento público do município de Torres/RS. Stomatos 2006; 12(22):5-9.
Scaliz 19. Narvai PC. Fluoretação da água: heterocontrole no Mu-nicípio de São Paulo no período 1990-1999. Rev Bras Odontol Saude Colet 2000; (2):50-6.
20. Narvai PC. Odontologia preventiva. In: Congresso Uni-versitário Brasileiro de Odontologia – CUBO, 7o, São Paulo, 10/09/1982.
21. Instituto Brasileiro de Geografia e Estatística (IBGE). Censo demográfico- Características da população e dos domicílios. Rio de Janeiro: IBGE; 2010.
22. Arruda PN, Lima A, Scalize PS. Gestão dos serviços públicos de água e esgoto e cobrança pelo seu uso nos municípios Goianos operados pelas prefeituras. Rev Ambient Água 2016; 11(2):362-376.
23. Scalize PS, Fernandes NC, Arruda PN, Ferreira NC, Cunha EH, Santos AF. Avaliação da turbidez em amostras de água tratada coletadas nos municípios do Estado de Goiás. Rev Monografias Ambient 2014; 13(3):3429-3436.
24. Yang YJ, Goodrich JA, Clark RM, Li SY. Modeling and testing of reactive contaminant transport in drinking water pipes: Chlorine response and implications for online contaminant detection. Water research 2008; 42(6):1397-1412.
25. Moimaz SAS, Saliba O, Chiba FY, Sumida DH, Gar-bin CAS, Saliba NA. Fluoride concentration in public water supply: 72 months of analysis. Braz Dent J 2012; 23(4):451-456.
26. Brasil. Portaria nº 2.914, de 12 de dezembro de 2011. Dispõe sobre os procedimentos e responsabilidades relativos ao controle e vigilância da qualidade da água para consumo humano e seu padrão de potabilidade. Diário Oficial da União 2011; 13 dez.
27. Companhia Ambiental do Estado de São Paulo (CE-TESB). Guia nacional de coleta e preservação de amos-tras: água, sedimento, comunidades aquáticas e efluentes líquidos. São Paulo: CETESB; 2011.
28. American Public Health Association (APHA), Amer-ican Water Works Association (AWWA), Water Envi-ronment Federation (WEF). Standard methods for the examination of water and wastewater. 21st ed. Washing-ton: APHA, AWWA, WEF; 2005.
29. Estado de Goiás. Secretaria de Estado de Gestão e Pla-nejamento. Sistema Estadual de Geoinformação. Dados climáticos de temperatura. [acessado 2015 Set 24] Dis-ponível: http://www.sieg.go.gov.br/
30. Brasil. Portaria nº 635, de 26 de dezembro de 1975. Aprova normas e padrões sobre fluoretação da água dos sistemas públicos de abastecimento, destinada ao consumo humano. Diário Oficial da União 1976; 30 jan.
31. Ramires I. Avaliação da concentração de flúor na água de abastecimento público, antes e depois dos procedimen-tos de fluoretação [dissertação]. Bauru: Faculdade de Odontologia de Bauru; 2004.
32. Panizzi M, Peres MA. Dez anos de heterocontrole da fluoretação de águas em Chapecó, Estado de Santa Catarina, Brasil. Cad Saude Publica 2008; 24(9):2021-2031.
33. Craig L, Lutz A, Berry KA, Yang W. Recommendations for fluoride limits in drinking water based on estimated daily fluoride intake in the Upper East Region, Ghana. Sci Total Environ 2015; 532:127-137.
34. Daré F, Dall’Aglio Sobrinho M, Libânio M. Avaliação do processo de fluoretação nos sistemas de abasteci-mento de água da região de Araçatuba, São Paulo. Eng Sanit Ambient 2009; 14(2):173-182.
35. Leivas LL, Tovo MF, Ardenghi TM, Feldens CA, Kramer PF, Faraco Junior IM. Heterocontrole da fluoretação das águas de abastecimento público do Município de Canoas/RS. Stomatos 2010; 16(30):11-20.
36. Buzalaf MA, Granjeiro JM, Damante CA, Ornelas F. Fluctuations in public water fluoride level in Bauru, Brazil. J Public Health Dent 2002; 62(3):173-176. 37. Galagan DJ, Vermillion JR. Determining optimum
fluoride concentrations. Public Health Rep 1957; 72(6):491-493.
38. Ramadan A, Hilmi Y. The influence of climate on the determination of the upper permissible fluoride level in potable water in Sudan. Fluoride 2014; 47(2):170-180.
39. Villa AE, Guerrero S, Villalobos J. Estimation of opti-mal concentration of fluoride in drinking water under conditions prevailing in Chile. Community Dent Oral Epidemiol 1998; 26(4):249-255.
Article submitted 17/03/2016 Approved 12/11/2016
Final version submitted 14/11/2016
This is an Open Access article distributed under the terms of the Creative Commons Attribution License