* Corresponding author: E-mail: mgervasiopereira01@ gmail.com
Received: September 15, 2015 Approved: April 12, 2016
How to cite: Valladares GS, Pereira MG, Benites VM, Anjos LHC, Ebeling AG, Guareschi RF. Carbon and Nitrogen Stocks and Humic Fractions in Brazilian Organosols. Rev Bras Cienc Solo. 2016;40:e0151317.
Copyright: This is an open-access article distributed under the terms of the Creative Commons Attribution License, which permits unrestricted use, distribution, and reproduction in any medium, provided that the original author and source are credited.
Carbon and Nitrogen Stocks
and Humic Fractions in Brazilian
Organosols
Gustavo Souza Valladares(1)
, Marcos Gervasio Pereira(2)*
, Vinícius de Melo Benites(3)
, Lúcia Helena Cunha dos Anjos(2)
, Adierson Gilvani Ebeling(4)
and Roni Fernandes Guareschi(2)
(1) Universidade Federal do Piauí, Coordenação de Geografia, Campus Universitário Ministro Petrônio Portella, Teresina, Piauí, Brasil.
(2) Universidade Federal Rural do Rio de Janeiro, Departamento de solos, Seropédica, Rio de Janeiro, Brasil. (3) Empresa Brasileira de Pesquisa Agropecuária, Embrapa Solos, Rio de Janeiro, Rio de Janeiro, Brasil. (4) Ministério do Desenvolvimento Agrário, Instituto Nacional de Colonização e Reforma Agrária, São José,
Santa Catarina, Brasil.
ABSTRACT: Despite limited geographic expression of Organosols in Brazil, their high carbon storage capacity and natural environmental vulnerability justifies further studies on C and N stocks in these soils and their relationship to the nature of organic matter. Evaluation of physical and chemical properties of organic soils and their ability to store C is important so as to develop sustainable management practices for their preservation. The objectives of the study were to measure the total organic carbon stock (OCst), total nitrogen stock (Nst), and humic fractions in Organosols from different environments and regions of Brazil, and to correlate the data with soil chemical (pH, P, K, Ca2+
, Mg2+ , Al3+
, H+Al, CEC, V) and physical properties (soil bulk density, Bd; organic matter density, OMd; total pore space, TPS; minimum residue, MinR; and proportion of mineral matter, MM), and degree of organic matter decomposition (rubbed fiber content; pyrophosphate index, PyI; and von Post index). For that purpose, 18 Organosol profiles, in a total of 49 horizons, were sampled under different land usage and plant coverage conditions. The profiles were located in the following Brazilian states - Alagoas, Bahia, Distrito Federal, Espírito Santo, Mato Grosso do Sul, Minas Gerais, Paraná, Rio de Janeiro, Rio Grande do Sul, Santa Catarina, and São Paulo. The OCst and Nst varied significantly among horizons and profiles. The Organosols exhibited, on average, 203.59 Mg ha-1
OCst and 8.30 Mg ha-1
Nst, and the highest values were found in profiles with pasture usage. The content of the humic fraction (humin, HUM; fulvic acid, FAF; and humic acid, HAF) and C storage varied in the soil horizons and profiles according to the degree of decomposition and other factors of soil formation. The OCst, Nst, OMd and the C stocks in the humic fractions were positively correlated. The values of acidity were lower in the soils with higher contents of mineral material, and low pH values were related to a high C/N ratio. The OCst and Nst were correlated with different soil properties, the most important being the degree of soil organic matter decomposition, which was inversely correlated.
Keywords: soil organic matter, humic substances, histic horizon, physical and chemical properties.
INTRODUCTION
According to the Brazilian Soil Classification System (SiBCS), the soil order Organossolos is defined by an organic carbon (OC) content greater than or equal to 80 g kg-1
, in addition to the criteria of the thickness of organic horizons (Santos et al., 2013). This requirement of OC content is lower than the value used in the World Reference Base for Soil Resources (WRB), where organic soils (equivalent to Histosols) should contain OC greater than 200 g kg-1
(IUSS, 2014), and there are differences in the methods used for determination of OC. Thus, the soils under study will be referred as Organosols instead of Histosols (WRB). The criteria and specific methods for characterizing the Organosols are fully detailed in Santos et al. (2013).
Organosols cover an estimated area of 0.6-1.0 million hectares of Brazilian territory and are distributed across tropical and subtropical areas. The natural vegetation includes mangrove, typhaceae, wetland forests, and highland forests; the last category mentioned occupies small areas in mountainous well-drained environments with high vulnerability to degradation. However, these soils represent an important asset for agriculture, since approximately 50 % of the Brazilian Organosols, mainly in the flat river basin areas, are used for farming or as pasture lands (Valladares, 2003).
Tropical peatlands are an important source of OC and N, and they represent a significant source of greenhouse gases (Page et al., 2004; Vegas-Vilarrúbia et al., 2010). The peatlands cover only about 3 % of the land surface of the Earth; nevertheless, they account for about 30 % of the C storage in the soil biomass (Gorham, 1991; Eswaran et al., 1993). Therefore, studies for estimating OC and N stocks in these soils are important, as well as for establishing C dynamics. This is necessary to develop sustainable management practices of peatlands, including reduction of greenhouse gas emissions from agricultural usage and their preservation as pools of organic matter and for maintaining aquifers.
Knowledge regarding humic substances in soils is fundamental for understanding the role of organic matter in the stabilization of soil aggregates and sequestration of C from atmospheric CO2 (Hayes and Clapp, 2001; Schmidt et al., 2011). The beneficial effects of organic matter on physical, chemical, and biological properties of soil and for agricultural sustainability are well known (Batjes and Dijkshoorn, 1999). In contrast, changes in SOM contents and in the proportions of soil humic fractions caused by deforestation and deficient or non-existent soil management can decrease soil quality (Valladares et al., 2007). In Organosols, SOM is ordinarily reduced by human activity and agricultural intensity, mainly related to decreasing addition of plant residue, artificial drainage for agriculture, and promotion of microbial activity by increasing soil aeration by drainage (Pereira et al., 2005; Ewing and Vepraskas, 2006; Valladares et al., 2008a,b; Kechavarzi et al., 2010; Cayci et al., 2011; Leifeld et al., 2011).
Therefore, the quantification of OC stocks and C fractions in SOM is important for measuring C dynamics in different land use systems (Batjes and Dijkshoorn, 1999; Bromick and Lal, 2005; Jones et al., 2005; Gundelwein et al., 2007; Henry et al., 2009). Since Organosols exhibit high humic fraction stocks because of their organic nature (Valladares et al., 2007), the usage of this criterion for their taxonomic categorization in soil classification at lower levels (family) are important for a better understanding of soil quality, risk of degradation, susceptibility to subsidence, and loss of soluble organic matter (Valladares et al., 2008a).
because of the low bulk density of organic matter in relation to soil mineral fractions. The inverse correlation between Bd and C content was also shown in Brazilian organic soils by Kämpf and Schneider (1989), Valladares et al. (2007) and Cipriano-Silva et al. (2014). Nevertheless, information on associations among C (total and/or in humic fractions), organic matter density (OMd), minimum residue (MinR), fiber content, pyrophosphate index (PyI), and the von Post index are still limited.
The hypothesis of this research is that differences in the land use and cover may influence in the total organic carbon stock (OCst), total nitrogen stock (Nst), and humic fractions in Brazilian Organosols, as soil organic matter decomposition degree and other chemical and physical soils attributes.
The objectives of this study were to measure the total organic carbon stock (OCst), total nitrogen stock (Nst), and humic fractions in Brazilian Organosols, and to correlate the data with soil chemical and physical properties and the degree of organic matter decomposition. The soil profiles sampled were located under different land usage and coverage conditions, representative of the main Organosol environments in Brazil.
MATERIALS AND METHODS
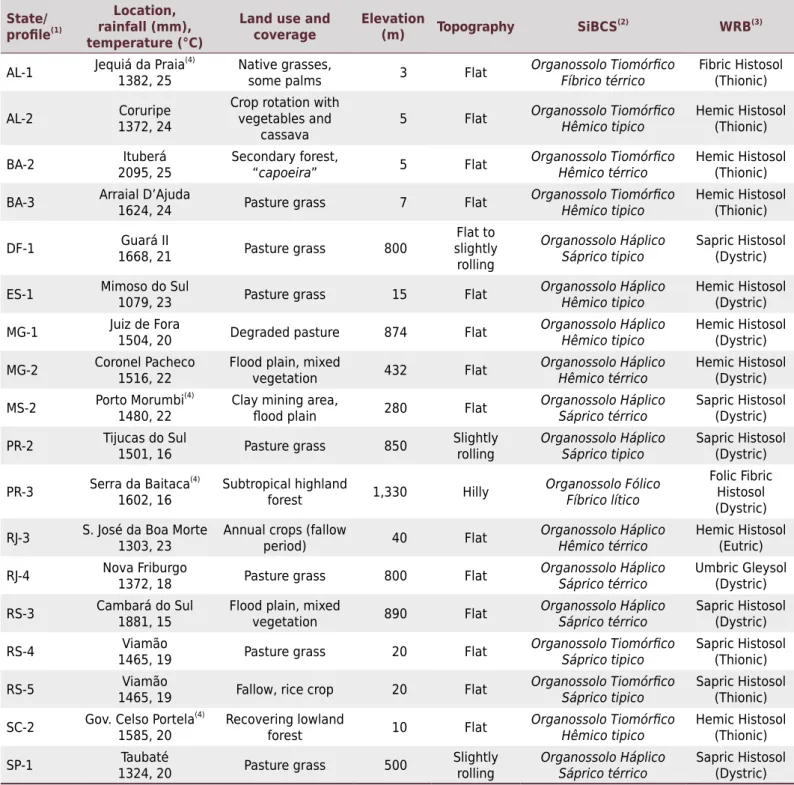
Samples were taken from 18 soil profiles for a total of 49 horizons (or layers) in regions of different landscapes and climates (Table 1, Figure 1) that represent known occurrences of Organosols in Brazil. Soil samples were collected, characterized, and classified according to field manuals for describing and sampling soils (IUSS, 2006, 2014; Santos et al., 2013). The location, climate, current land usage and coverage, elevation, relief, and classification of Organosols are in the table 1.
The average values of the main properties used to classify the Organosol profiles are shown in tables 2 and 3. The methods used to determine soil fertility and soil bulk density (Bd) and total pore space (TPS) are described in Claessen (1997). The horizons were sampled with metallic cylinders (Kopeck method), each with 0.05 m diameter and 0.05 m depth, to measure soil bulk density (Bd). Samples were also taken to measure organic matter density (OMd), minimum residue (MinR), and mineral matter (MM), which were expressed in percent value, as well as fiber content, pyrophosphate index (PyI), and organic matter (OM) (Lynn et al., 1974). The degree of humification (DM) of the peat was estimated using the von Post method (von Post, 1922), described by Audet et al. (2013). According to this method, a fresh peat sample is squeezed in the hand and observations of the color of the water are made, together with various parameters of the peat material extruded (e.g., presence of plant structure, content of amorphous material). The von Post scale ranges from 1 (undecomposed peat) to 10 (completely decomposed peat).
Carbon and N values were quantified by dry combustion with a CHNS analyzer (Elemental Analysis System GmbH, Hanau, Germany). Data on C and N contents and Bd were used to calculate OC stocks (OCst), N stocks (Nst), and stocks of humic substances according to the equation:
Stock (X) = Bd × (X) content × thickness
where stock is expressed in Mg ha-1
; X, substance or element in g kg-1
(C, N, humic acid, fulvic acid, and humin); Bd, soil bulk density in Mg m-3, contents are expressed in g kg-1, and thickness in m. The stocks accumulated from the 0.0 to 1.0 m layer were calculated in the 18 soil profiles studied, according to their horizon thickness.
end, a 1.0 g soil mass was immersed in 20 mL of 0.1 mol L-1
NaOH for 24 h. Separation between alkaline extract (alkaline extract [AE] = fulvic acid [FAF] + humic acid [HAF]) and residue was performed by centrifugation at 5,000 g for 30 min. The residue was washed again with 20 mL of the NaOH solution, and this washing solution was mixed with the extract, yielding a final volume of 40 mL. The residue was removed from the centrifuge tubes and placed in a Petri plate for complete drying at 65 °C. The pH of the alkaline extract was adjusted to 1.0 (±0.1) using 20 % H2SO4 before decantation for 18 h under refrigeration. The precipitate (HAF) was separated from the soluble fraction (FAF) by filtration and both volumes were completed with distilled water up to 50 mL. (1) Brazilian states: AL, Alagoas; BA, Bahia; DF, Distrito Federal, Brasília; MG, Minas Gerais; MS, Mato Grosso do Sul; PR, Paraná; RJ, Rio de Janeiro; RS, Rio Grande do Sul; SC, Santa Catarina; SP, São Paulo. (2) Classification in according to Santos et al. (2013). (3) Corresponding to WRB classification (WRB, 2006). Climate data obtained from: http://pt.climate-data.org/, accessed on May 2, 2016. (4) No data, obtained by proximity.
Table 1. Characterization of the sampling areas and classification of Organosol profiles
State/
profile(1)
Location, rainfall (mm), temperature (°C)
Land use and coverage
Elevation
(m) Topography SiBCS
(2)
WRB(3)
AL-1 Jequiá da Praia
(4)
1382, 25
Native grasses,
some palms 3 Flat Organossolo Tiomórfico Fíbrico térrico
Fibric Histosol (Thionic)
AL-2 1372, 24Coruripe
Crop rotation with vegetables and
cassava
5 Flat Organossolo Tiomórfico
Hêmico tipico
Hemic Histosol (Thionic)
BA-2 2095, 25Ituberá Secondary forest, “
capoeira” 5 Flat Organossolo Tiomórfico Hêmico térrico
Hemic Histosol (Thionic)
BA-3 Arraial D’Ajuda1624, 24 Pasture grass 7 Flat Organossolo Tiomórfico
Hêmico tipico
Hemic Histosol (Thionic)
DF-1 1668, 21Guará II Pasture grass 800
Flat to slightly rolling Organossolo Háplico Sáprico tipico Sapric Histosol (Dystric)
ES-1 Mimoso do Sul1079, 23 Pasture grass 15 Flat Organossolo Háplico
Hêmico tipico
Hemic Histosol (Dystric)
MG-1 Juiz de Fora1504, 20 Degraded pasture 874 Flat Organossolo Háplico
Hêmico tipico
Hemic Histosol (Dystric)
MG-2 Coronel Pacheco1516, 22 Flood plain, mixed vegetation 432 Flat Organossolo Háplico
Hêmico térrico
Hemic Histosol (Dystric)
MS-2 Porto Morumbi
(4)
1480, 22
Clay mining area,
flood plain 280 Flat Organossolo Háplico Sáprico térrico
Sapric Histosol (Dystric)
PR-2 Tijucas do Sul1501, 16 Pasture grass 850 Slightly rolling Organossolo Háplico
Sáprico tipico
Sapric Histosol (Dystric)
PR-3 Serra da Baitaca
(4)
1602, 16
Subtropical highland
forest 1,330 Hilly
Organossolo Fólico Fíbrico lítico
Folic Fibric Histosol (Dystric)
RJ-3 S. José da Boa Morte1303, 23 Annual crops (fallow period) 40 Flat Organossolo Háplico
Hêmico térrico
Hemic Histosol (Eutric)
RJ-4 Nova Friburgo1372, 18 Pasture grass 800 Flat Organossolo Háplico
Sáprico térrico
Umbric Gleysol (Dystric)
RS-3 Cambará do Sul1881, 15 Flood plain, mixed vegetation 890 Flat Organossolo Háplico
Sáprico térrico
Sapric Histosol (Dystric)
RS-4 1465, 19Viamão Pasture grass 20 Flat Organossolo Tiomórfico
Sáprico tipico
Sapric Histosol (Thionic)
RS-5 1465, 19Viamão Fallow, rice crop 20 Flat Organossolo Tiomórfico
Sáprico tipico
Sapric Histosol (Thionic)
SC-2 Gov. Celso Portela (4)
1585, 20
Recovering lowland
forest 10 Flat Organossolo Tiomórfico Hêmico tipico
Hemic Histosol (Thionic)
SP-1 1324, 20Taubaté Pasture grass 500 Slightly rolling Organossolo Háplico
Sáprico térrico
Organic carbon (OC) in the FAF and HAF was determined in 5 mL extract aliquots mixed with 1.0 mL of 0.042 mol L-1 potassium dichromate and 5 mL of concentrated H
2SO4 in a block digester at 150 °C (30 min), followed by titration with 0.0125 mol L-1
ferrous ammonium sulfate. In the oven-dried residue, OC was determined in humin (HUM) by adding 5 mL of 0.1667 mol L-1 potassium dichromate and 10 mL of concentrated H
2SO4 to a block digester at 150 °C (30 min) and titrating with 0.25 mol L-1
ferrous ammonium sulfate and using ferroin indicator solution.
The results were analyzed by descriptive statistics, Pearson’s linear correlation method, and Principal Component Analysis (PCA) using the software XLSTAT version 2013.
RESULTS AND DISCUSSION
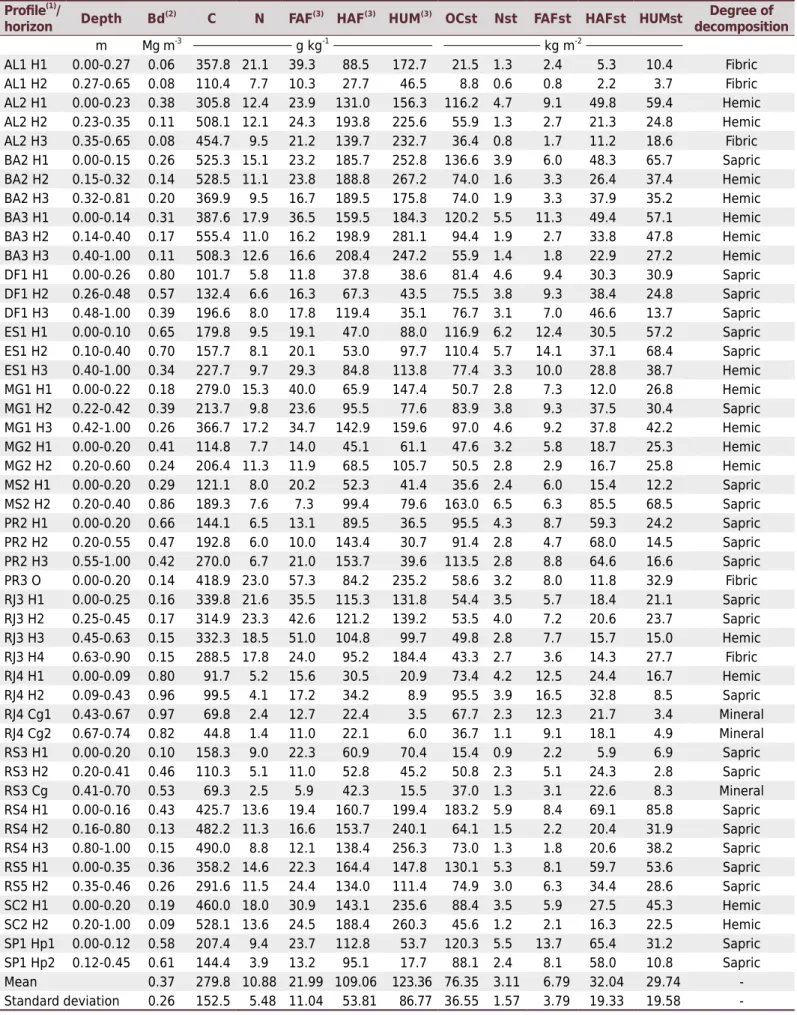
Soil bulk density (Bd), C and N contents in the humic fractions (FAF, HAF. and HUM), and the respective stocks (OCst, Nst) in the horizons studied are shown in table 4.
The values of Bd of histic horizons ranged from 0.06 to 0.96 Mg m-3
(0.34 ± 0.24 Mg m-3 , mean ± sd). The high variability of this property directly affects OCst estimates and may be related to differences in the source of organic matter and/or soil coverage conditions and management practices. Agricultural usage is reported as a common reason for an increase in Bd in Organosols (Ewing and Vepraskas, 2006; Kechavarzi et al., 2010; Leifeld et al., 2011), and the values of Bd in the literature for Organosols are similar to the ones observed in this study. In Danish riparian wetlands, Bd values ranged from 0.30 to 0.50 Mg m-3
(Audet et al., 2013). In the Orinoco Delta, the Bd value considered to
Figure 1. Distribution of Organosol profiles in Brazilian states.
DF1
AL1 AL2
BA2
BA3
ES1 RJ4 RJ3 MG2 MG1
SP1 MS2
PR3 PR2
SC2
measure C storage was 0.15 Mg m-3
(Vegas-Vilarrúbia et al., 2010). In acid wetlands of the New Jersey Pinelands, the Bd values ranged from 0.15 to 1.01 Mg m-3
(Yu and Ehrenfeld, 2009). Valladares (2003), investigating 100 profiles of Organosols from soil surveys in all regions of Brazil, found an average value of Bd of 0.63 Mg m-3, with a minimum value of 0.05 Mg m-3 and maximum near 1.0 Mg m-3.
Carbon content in the histic horizons in this study ranged from 91.7 to 555.4 g kg-1 (294.4 ± 146.1 g kg-1
, mean ± sd); and the OCst, for all horizons, ranged from 8.8 to 183.2 kg m-2 (76.3 ± 36.5 kg m-2, mean ± sd). A number of studies that evaluated C contents in Organosols from different regions of Brazil report similar ranges (and mean value): 39.0 to 528.1 g kg-1
(237.5 g kg-1
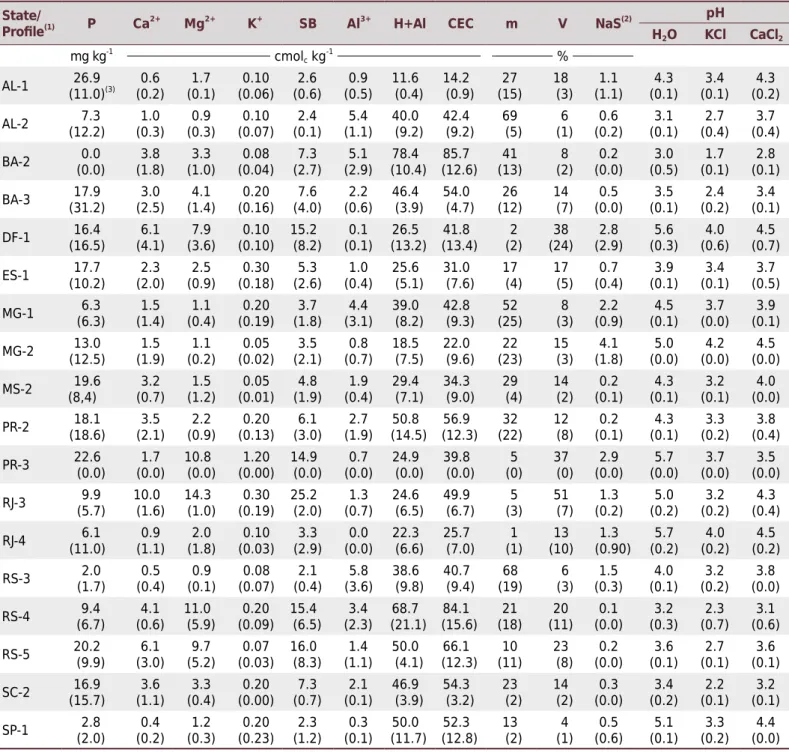
) (Ebeling et al., 2008); 114.3 to 568.8 g kg-1 (1) Brazilian states: AL, Alagoas; BA, Bahia; DF, Distrito Federal, Brasília; MG, Minas Gerais; MS, Mato Grosso do Sul; PR, Paraná; RJ, Rio de Janeiro; RS, Rio Grande do Sul; SC, Santa Catarina; SP, São Paulo. P and K: Mehlich-1; Ca2+, Mg2+, Al3+: 1 mol L-1 KCl; H+Al: potential acidity, calcium acetate 0.5 mol L-1; SB: sum of bases; CEC: cation exchange capacity; V: base saturation. (2) NaS: sodium saturation. (3) Mean values and standard deviation.
Table 2. Chemical properties of the Organosol profiles
State/
Profile(1) P Ca2+ Mg2+ K+ SB Al3+ H+Al CEC m V NaS(2)
pH
H2O KCl CaCl2
mg kg-1 cmol
c kg
-1 %
AL-1 (11.0)26.9(3) (0.2)0.6 (0.1)1.7 (0.06)0.10 (0.6)2.6 (0.5)0.9 11.6(0.4) 14.2(0.9) (15)27 18(3) (1.1)1.1 (0.1)4.3 (0.1)3.4 (0.2)4.3
AL-2 (12.2)7.3 (0.3)1.0 (0.3)0.9 (0.07)0.10 (0.1)2.4 (1.1)5.4 40.0(9.2) 42.4(9.2) 69(5) (1)6 (0.2)0.6 (0.1)3.1 (0.4)2.7 (0.4)3.7
BA-2 (0.0)0.0 (1.8)3.8 (1.0)3.3 (0.04)0.08 (2.7)7.3 (2.9)5.1 (10.4)78.4 (12.6)85.7 (13)41 (2)8 (0.0)0.2 (0.5)3.0 (0.1)1.7 (0.1)2.8
BA-3 (31.2)17.9 (2.5)3.0 (1.4)4.1 (0.16)0.20 (4.0)7.6 (0.6)2.2 46.4(3.9) 54.0(4.7) (12)26 14(7) (0.0)0.5 (0.1)3.5 (0.2)2.4 (0.1)3.4
DF-1 (16.5)16.4 (4.1)6.1 (3.6)7.9 (0.10)0.10 15.2(8.2) (0.1)0.1 (13.2)26.5 (13.4)41.8 (2)2 (24)38 (2.9)2.8 (0.3)5.6 (0.6)4.0 (0.7)4.5
ES-1 (10.2)17.7 (2.0)2.3 (0.9)2.5 (0.18)0.30 (2.6)5.3 (0.4)1.0 25.6(5.1) 31.0(7.6) 17(4) 17(5) (0.4)0.7 (0.1)3.9 (0.1)3.4 (0.5)3.7
MG-1 (6.3)6.3 (1.4)1.5 (0.4)1.1 (0.19)0.20 (1.8)3.7 (3.1)4.4 39.0(8.2) 42.8(9.3) (25)52 (3)8 (0.9)2.2 (0.1)4.5 (0.0)3.7 (0.1)3.9
MG-2 (12.5)13.0 (1.9)1.5 (0.2)1.1 (0.02)0.05 (2.1)3.5 (0.7)0.8 18.5(7.5) 22.0(9.6) (23)22 15(3) (1.8)4.1 (0.0)5.0 (0.0)4.2 (0.0)4.5
MS-2 (8,4)19.6 (0.7)3.2 (1.2)1.5 (0.01)0.05 (1.9)4.8 (0.4)1.9 29.4(7.1) 34.3(9.0) 29(4) 14(2) (0.1)0.2 (0.1)4.3 (0.1)3.2 (0.0)4.0
PR-2 (18.6)18.1 (2.1)3.5 (0.9)2.2 (0.13)0.20 (3.0)6.1 (1.9)2.7 (14.5)50.8 (12.3)56.9 (22)32 12(8) (0.1)0.2 (0.1)4.3 (0.2)3.3 (0.4)3.8
PR-3 22.6(0.0) (0.0)1.7 10.8(0.0) (0.00)1.20 14.9(0.0) (0.0)0.7 24.9(0.0) 39.8(0.0) (0)5 37(0) (0.0)2.9 (0.0)5.7 (0.0)3.7 (0.0)3.5
RJ-3 (5.7)9.9 10.0(1.6) 14.3(1.0) (0.19)0.30 25.2(2.0) (0.7)1.3 24.6(6.5) 49.9(6.7) (3)5 51(7) (0.2)1.3 (0.2)5.0 (0.2)3.2 (0.4)4.3
RJ-4 6.1 (11.0) 0.9 (1.1) 2.0 (1.8) 0.10 (0.03) 3.3 (2.9) 0.0 (0.0) 22.3 (6.6) 25.7 (7.0) 1 (1) 13 (10) 1.3 (0.90) 5.7 (0.2) 4.0 (0.2) 4.5 (0.2) RS-3 2.0 (1.7) 0.5 (0.4) 0.9 (0.1) 0.08 (0.07) 2.1 (0.4) 5.8 (3.6) 38.6 (9.8) 40.7 (9.4) 68 (19) 6 (3) 1.5 (0.3) 4.0 (0.1) 3.2 (0.2) 3.8 (0.0)
RS-4 (6.7)9.4 (0.6)4.1 11.0(5.9) (0.09)0.20 15.4(6.5) (2.3)3.4 (21.1)68.7 (15.6)84.1 (18)21 (11)20 (0.0)0.1 (0.3)3.2 (0.7)2.3 (0.6)3.1
RS-5 20.2(9.9) (3.0)6.1 (5.2)9.7 (0.03)0.07 16.0(8.3) (1.1)1.4 50.0(4.1) (12.3)66.1 (11)10 23(8) (0.0)0.2 (0.1)3.6 (0.1)2.7 (0.1)3.6
SC-2 (15.7)16.9 (1.1)3.6 (0.4)3.3 (0.00)0.20 (0.7)7.3 (0.1)2.1 46.9(3.9) 54.3(3.2) 23(2) 14(2) (0.0)0.3 (0.2)3.4 (0.1)2.2 (0.1)3.2
(351.3 g kg-1) (Fontana et al., 2008); 41.2 to 499.1 g kg-1 (193.1 g kg-1) (Ebeling et al., 2011); and 44.8 to 528.5 g kg-1
(278.6 g kg-1
) (Ebeling et al., 2013). Variation in the C contents and stocks are related to local environmental conditions, including the type of vegetation, relief, drainage class, and mineral substrate. Another source of variation is the heterogeneity of organic material that was added under different conditions and that formed the organic layers, i.e., if the material is fibric or sapric. Therefore, this variation is controlled by plant cover and by changes in climate, water, and moisture conditions over time.
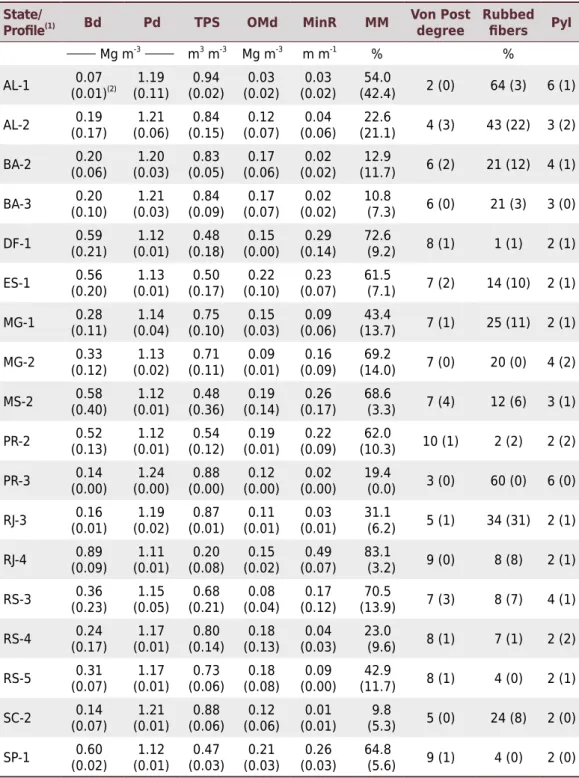
Table 3. Physical properties (bulk density - Bd, particle density - Pd, total pore space - TPS, organic matter
density - OMd, minimum residue - MinR, mineral matter - MM) and degree of organic matter decomposition
(rubbed fiber content, pyrophosphate index - PyI, and von Post index) of the Organosol profiles
(1) Brazilian states: AL, Alagoas; BA, Bahia; DF, Distrito Federal, Brasília; MG, Minas Gerais; MS, Mato Grosso do Sul; PR, Paraná; RJ, Rio de Janeiro; RS, Rio Grande do Sul; SC, Santa Catarina; SP, São Paulo. Bd, Pd, TPS: according Claessen (1997); OMd, MinR, MM, PyI rubber fibes: according Lynn et al. (1974); Von Post degree: the von Post method (von Post, 1922), described by Audet et al. (2013); (2) Mean values and standard deviation.
State/
Profile(1) Bd Pd TPS OMd MinR MM Von Post
degree
Rubbed
fibers PyI
Mg m-3 m3 m-3 Mg m-3 m m-1 % %
AL-1 (0.01)0.07(2) 1.19 (0.11)
0.94 (0.02)
0.03 (0.02)
0.03 (0.02)
54.0
(42.4) 2 (0) 64 (3) 6 (1)
AL-2 0.19
(0.17)
1.21 (0.06)
0.84 (0.15)
0.12 (0.07)
0.04 (0.06)
22.6
(21.1) 4 (3) 43 (22) 3 (2)
BA-2 (0.06)0.20 (0.03)1.20 (0.05)0.83 (0.06)0.17 (0.02)0.02 (11.7)12.9 6 (2) 21 (12) 4 (1)
BA-3 (0.10)0.20 (0.03)1.21 (0.09)0.84 (0.07)0.17 (0.02)0.02 10.8(7.3) 6 (0) 21 (3) 3 (0)
DF-1 0.59
(0.21)
1.12 (0.01)
0.48 (0.18)
0.15 (0.00)
0.29 (0.14)
72.6
(9.2) 8 (1) 1 (1) 2 (1)
ES-1 (0.20)0.56 (0.01)1.13 (0.17)0.50 (0.10)0.22 (0.07)0.23 61.5(7.1) 7 (2) 14 (10) 2 (1)
MG-1 (0.11)0.28 (0.04)1.14 (0.10)0.75 (0.03)0.15 (0.06)0.09 (13.7)43.4 7 (1) 25 (11) 2 (1)
MG-2 (0.12)0.33 (0.02)1.13 (0.11)0.71 (0.01)0.09 (0.09)0.16 (14.0)69.2 7 (0) 20 (0) 4 (2)
MS-2 (0.40)0.58 (0.01)1.12 (0.36)0.48 (0.14)0.19 (0.17)0.26 68.6(3.3) 7 (4) 12 (6) 3 (1)
PR-2 (0.13)0.52 (0.01)1.12 (0.12)0.54 (0.01)0.19 (0.09)0.22 (10.3)62.0 10 (1) 2 (2) 2 (2)
PR-3 (0.00)0.14 (0.00)1.24 (0.00)0.88 (0.00)0.12 (0.00)0.02 19.4(0.0) 3 (0) 60 (0) 6 (0)
RJ-3 (0.01)0.16 (0.02)1.19 (0.01)0.87 (0.01)0.11 (0.01)0.03 31.1(6.2) 5 (1) 34 (31) 2 (1)
RJ-4 0.89
(0.09)
1.11 (0.01)
0.20 (0.08)
0.15 (0.02)
0.49 (0.07)
83.1
(3.2) 9 (0) 8 (8) 2 (1)
RS-3 (0.23)0.36 (0.05)1.15 (0.21)0.68 (0.04)0.08 (0.12)0.17 (13.9)70.5 7 (3) 8 (7) 4 (1)
RS-4 (0.17)0.24 (0.01)1.17 (0.14)0.80 (0.13)0.18 (0.03)0.04 23.0(9.6) 8 (1) 7 (1) 2 (2)
RS-5 0.31
(0.07)
1.17 (0.01)
0.73 (0.06)
0.18 (0.08)
0.09 (0.00)
42.9
(11.7) 8 (1) 4 (0) 2 (1)
SC-2 (0.07)0.14 (0.01)1.21 (0.06)0.88 (0.06)0.12 (0.01)0.01 (5.3)9.8 5 (0) 24 (8) 2 (0)
(1) Brazilian states: AL, Alagoas; BA, Bahia; DF, Distrito Federal, Brasília; MG, Minas Gerais; MS, Mato Grosso do Sul; PR, Paraná; RJ, Rio de Janeiro; RS, Rio Grande do Sul; SC, Santa Catarina; SP, São Paulo. (2) Kopecky’s ring method (1997), (3) Benites et al. (2013).
Table 4. Soil bulk density (Bd), carbon and nitrogen contents (C, N) and stocks (OCst, Nst) in the humic fractions (fulvic acid, FAF;
humic acid, HAF; and humin, HUM), and degree of decomposition of organic matter in the Organosol profiles
Profile(1)
/
horizon Depth Bd
(2)
C N FAF(3)
HAF(3)
HUM(3)
OCst Nst FAFst HAFst HUMst Degree of
decomposition
m Mg m-3
g kg-1
kg m-2
AL1 H1 0.00-0.27 0.06 357.8 21.1 39.3 88.5 172.7 21.5 1.3 2.4 5.3 10.4 Fibric
AL1 H2 0.27-0.65 0.08 110.4 7.7 10.3 27.7 46.5 8.8 0.6 0.8 2.2 3.7 Fibric
AL2 H1 0.00-0.23 0.38 305.8 12.4 23.9 131.0 156.3 116.2 4.7 9.1 49.8 59.4 Hemic
AL2 H2 0.23-0.35 0.11 508.1 12.1 24.3 193.8 225.6 55.9 1.3 2.7 21.3 24.8 Hemic
AL2 H3 0.35-0.65 0.08 454.7 9.5 21.2 139.7 232.7 36.4 0.8 1.7 11.2 18.6 Fibric
BA2 H1 0.00-0.15 0.26 525.3 15.1 23.2 185.7 252.8 136.6 3.9 6.0 48.3 65.7 Sapric
BA2 H2 0.15-0.32 0.14 528.5 11.1 23.8 188.8 267.2 74.0 1.6 3.3 26.4 37.4 Hemic
BA2 H3 0.32-0.81 0.20 369.9 9.5 16.7 189.5 175.8 74.0 1.9 3.3 37.9 35.2 Hemic
BA3 H1 0.00-0.14 0.31 387.6 17.9 36.5 159.5 184.3 120.2 5.5 11.3 49.4 57.1 Hemic
BA3 H2 0.14-0.40 0.17 555.4 11.0 16.2 198.9 281.1 94.4 1.9 2.7 33.8 47.8 Hemic
BA3 H3 0.40-1.00 0.11 508.3 12.6 16.6 208.4 247.2 55.9 1.4 1.8 22.9 27.2 Hemic
DF1 H1 0.00-0.26 0.80 101.7 5.8 11.8 37.8 38.6 81.4 4.6 9.4 30.3 30.9 Sapric
DF1 H2 0.26-0.48 0.57 132.4 6.6 16.3 67.3 43.5 75.5 3.8 9.3 38.4 24.8 Sapric
DF1 H3 0.48-1.00 0.39 196.6 8.0 17.8 119.4 35.1 76.7 3.1 7.0 46.6 13.7 Sapric
ES1 H1 0.00-0.10 0.65 179.8 9.5 19.1 47.0 88.0 116.9 6.2 12.4 30.5 57.2 Sapric
ES1 H2 0.10-0.40 0.70 157.7 8.1 20.1 53.0 97.7 110.4 5.7 14.1 37.1 68.4 Sapric
ES1 H3 0.40-1.00 0.34 227.7 9.7 29.3 84.8 113.8 77.4 3.3 10.0 28.8 38.7 Hemic
MG1 H1 0.00-0.22 0.18 279.0 15.3 40.0 65.9 147.4 50.7 2.8 7.3 12.0 26.8 Hemic
MG1 H2 0.22-0.42 0.39 213.7 9.8 23.6 95.5 77.6 83.9 3.8 9.3 37.5 30.4 Sapric
MG1 H3 0.42-1.00 0.26 366.7 17.2 34.7 142.9 159.6 97.0 4.6 9.2 37.8 42.2 Hemic
MG2 H1 0.00-0.20 0.41 114.8 7.7 14.0 45.1 61.1 47.6 3.2 5.8 18.7 25.3 Hemic
MG2 H2 0.20-0.60 0.24 206.4 11.3 11.9 68.5 105.7 50.5 2.8 2.9 16.7 25.8 Hemic
MS2 H1 0.00-0.20 0.29 121.1 8.0 20.2 52.3 41.4 35.6 2.4 6.0 15.4 12.2 Sapric
MS2 H2 0.20-0.40 0.86 189.3 7.6 7.3 99.4 79.6 163.0 6.5 6.3 85.5 68.5 Sapric
PR2 H1 0.00-0.20 0.66 144.1 6.5 13.1 89.5 36.5 95.5 4.3 8.7 59.3 24.2 Sapric
PR2 H2 0.20-0.55 0.47 192.8 6.0 10.0 143.4 30.7 91.4 2.8 4.7 68.0 14.5 Sapric
PR2 H3 0.55-1.00 0.42 270.0 6.7 21.0 153.7 39.6 113.5 2.8 8.8 64.6 16.6 Sapric
PR3 O 0.00-0.20 0.14 418.9 23.0 57.3 84.2 235.2 58.6 3.2 8.0 11.8 32.9 Fibric
RJ3 H1 0.00-0.25 0.16 339.8 21.6 35.5 115.3 131.8 54.4 3.5 5.7 18.4 21.1 Sapric
RJ3 H2 0.25-0.45 0.17 314.9 23.3 42.6 121.2 139.2 53.5 4.0 7.2 20.6 23.7 Sapric
RJ3 H3 0.45-0.63 0.15 332.3 18.5 51.0 104.8 99.7 49.8 2.8 7.7 15.7 15.0 Hemic
RJ3 H4 0.63-0.90 0.15 288.5 17.8 24.0 95.2 184.4 43.3 2.7 3.6 14.3 27.7 Fibric
RJ4 H1 0.00-0.09 0.80 91.7 5.2 15.6 30.5 20.9 73.4 4.2 12.5 24.4 16.7 Hemic
RJ4 H2 0.09-0.43 0.96 99.5 4.1 17.2 34.2 8.9 95.5 3.9 16.5 32.8 8.5 Sapric
RJ4 Cg1 0.43-0.67 0.97 69.8 2.4 12.7 22.4 3.5 67.7 2.3 12.3 21.7 3.4 Mineral
RJ4 Cg2 0.67-0.74 0.82 44.8 1.4 11.0 22.1 6.0 36.7 1.1 9.1 18.1 4.9 Mineral
RS3 H1 0.00-0.20 0.10 158.3 9.0 22.3 60.9 70.4 15.4 0.9 2.2 5.9 6.9 Sapric
RS3 H2 0.20-0.41 0.46 110.3 5.1 11.0 52.8 45.2 50.8 2.3 5.1 24.3 2.8 Sapric
RS3 Cg 0.41-0.70 0.53 69.3 2.5 5.9 42.3 15.5 37.0 1.3 3.1 22.6 8.3 Mineral
RS4 H1 0.00-0.16 0.43 425.7 13.6 19.4 160.7 199.4 183.2 5.9 8.4 69.1 85.8 Sapric
RS4 H2 0.16-0.80 0.13 482.2 11.3 16.6 153.7 240.1 64.1 1.5 2.2 20.4 31.9 Sapric
RS4 H3 0.80-1.00 0.15 490.0 8.8 12.1 138.4 256.3 73.0 1.3 1.8 20.6 38.2 Sapric
RS5 H1 0.00-0.35 0.36 358.2 14.6 22.3 164.4 147.8 130.1 5.3 8.1 59.7 53.6 Sapric
RS5 H2 0.35-0.46 0.26 291.6 11.5 24.4 134.0 111.4 74.9 3.0 6.3 34.4 28.6 Sapric
SC2 H1 0.00-0.20 0.19 460.0 18.0 30.9 143.1 235.6 88.4 3.5 5.9 27.5 45.3 Hemic
SC2 H2 0.20-1.00 0.09 528.1 13.6 24.5 188.4 260.3 45.6 1.2 2.1 16.3 22.5 Hemic
SP1 Hp1 0.00-0.12 0.58 207.4 9.4 23.7 112.8 53.7 120.3 5.5 13.7 65.4 31.2 Sapric
SP1 Hp2 0.12-0.45 0.61 144.4 3.9 13.2 95.1 17.7 88.1 2.4 8.1 58.0 10.8 Sapric
Mean 0.37 279.8 10.88 21.99 109.06 123.36 76.35 3.11 6.79 32.04 29.74
-The N content ranged from 1.4 to 23.3 g kg-1
(10.8 ± 5.4 g kg-1
, mean ± sd), whereas the Nst in the histic horizons ranged from 0.6 to 6.5 kg m-2
(3.1 ± 1.6 kg m-2
,mean ± sd). These results corroborate the assessment of Ebeling et al. (2011) about chemical properties of Organosols from different regions of Brazil, which exhibited an average N content of 10.9 g kg-1
. The highest Nst contents were found in Organosols cultivated with crops, most likely due to N fertilization.
In general, the SOM fraction with the highest C stocks (27 of the 49 horizons studied) (Table 4) was the HUM. However, 22 of the horizons analyzed displayed higher values of HAF stocks (HAFst) than both HUM stocks (HUMst) and FAF stocks (FAFst). The predominance of HUM and the HAF in the majority of samples (Table 4) may be related to the molecular components forming the associations that are stabilized by hydrophobic interactions and hydrogen bonds (Sutton and Sposito, 2005). In contrast, the FAF is the most soluble fraction (Sutton and Sposito, 2005) and it may move to deeper layers and undergo polymerization or mineralization, which reduces its presence in the soil. Ebeling et al. (2011; 2013) found the lowest amount of total C in the FAF fraction of Organosols from different Brazilian regions. These results indicate that most SOM is transformed, and recalcitrant fractions (HAF and HUM) predominate, in accordance with an increase in aromatic and aliphatic compounds, leading to greater polymerization and lower susceptibility to microbial attack.
The total OCst, Nst, and stocks of humic fractions in the soil profiles from the surface to the depth of 1.0 m are in the table 5. Ten of the profiles had histic horizons shallower than the 1.0 m depth. One profile, classified as a Folic Fibric Organosol, had a histic horizon of only 0.20 m and was placed directly over the rock substrate; it was well drained and was formed in a highland area with forest coverage. The total OCst in the profiles ranged from 30.30 to 320.30 Mg ha-1 (203.59 Mg ha-1 mean value), whereas the Nst was 1.90 to 15.20 Mg ha-1
(8.30 Mg ha-1
mean value). By comparison, Batjes (1996) estimated average worldwide values of OCst of 776 Mg ha-1
. The average Nst reported by Batjes (1996) in Organosols was 40 Mg ha-1
. In general, the highest OCst and Nst values were found in the Organosols under pasture coverage. Grasses are an efficient system for maintaining OC stocks in soil due to the quality of organic matter, which contains a high C/N ratio, thus reducing the decomposition rate. As a result, biomass residues from the pasture, including the roots, are maintained in the soil for a longer period, thus increasing the SOM (Pinheiro et al., 2004).
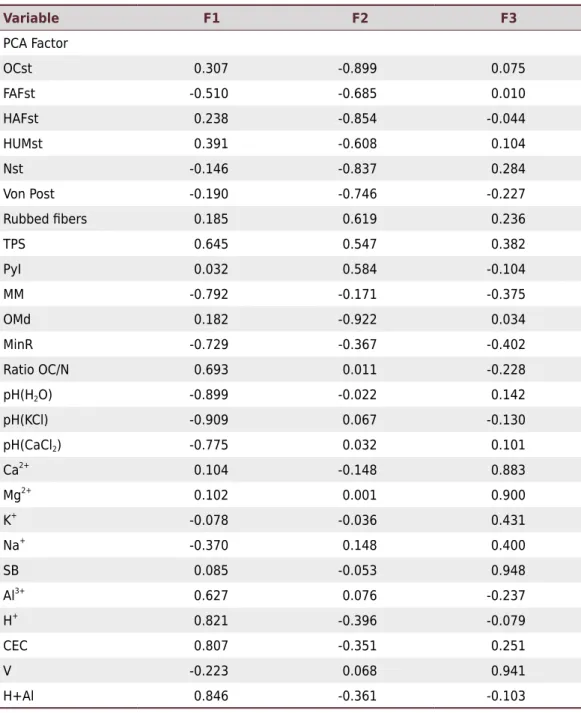
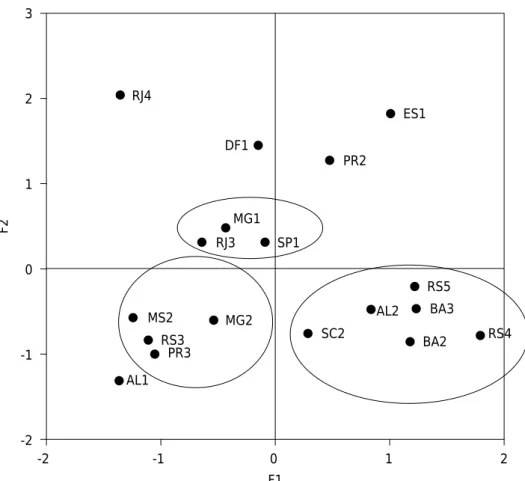
Principal component analysis (PCA), followed by varimax rotation, was used to verify association/correlation between soil properties (Table 6) and to form clusters with the most similar Organosol profiles (Figure 2). The first, second, and third factors obtained explained 47.8, 34.2 and 17.1 % of data variation, respectively; i.e., they explained 99.1 % of variability. The PCA factors (F2) higher than 0.6 and with the same signal (negative in this case) indicate that the OCst, C contents in the humic fractions, and the Nst were directly associated (Table 6). The HAFst exhibited the highest correlation with the OCst and Nst. As such, the HAFst can be used to indicate the management systems most suitable for Organosols.
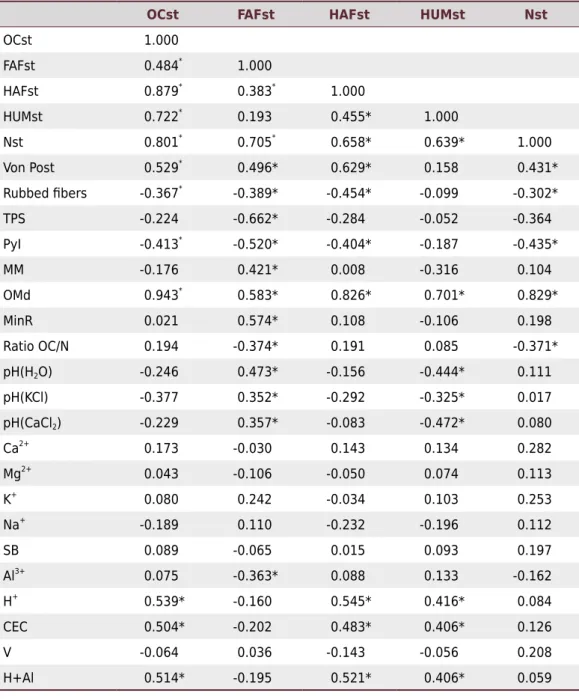
In a characterization and classification study of Brazilian Organosols, Valladares et al. (2007) found that OC content was highly correlated with the HAF and HUM, and weakly correlated with the FAF. The lower correlation between C and the FAF was explained by the fulvic acid characteristics, such as high solubility and mobility in soil, which increases its soil loss in the profile (Schnitzer, 1986; Stevenson, 1994). In addition, the HAF showed the highest coefficient of correlation (r) with the Nst (Table 7). This result indicates that the HAF may be used as an indicator to evaluate N availability in Organosols, where a high C/N rate usually represents a limitation for N fertilization and nutrient usage by crops (Valladares et al., 2008a).
(Table 6). Thus, C and N stocks increase as organic matter becomes denser and decrease as fiber content increases. This result corroborates a previous study with Organosols from the state of Rio Grande do Sul (Kämpf and Schneider, 1989). Also, the rubbed fiber contents were shown to be inversely correlated with Bd (D’Amore and Lynn, 2002). Therefore, Organosols with sapric materials rich in HAF tend to contain higher C and N stocks. The results of this study are evidence that C and N stocks in the Organosols are influenced by the degree of decomposition, type, and density of the organic matter.
The results for factor 1 of the PCA indicate that the C/N ratio is inversed associated with soil pH, measured by different methods, and directly associated with H+ and Al3+
(Table 6). The correlation coefficient for the C/N ratio of the Organosols showed it to be inversely correlated to the Nst and FAFst (Table 6). It is commonly observed that soils with a high C/N ratio result in N-deficiency for crops, as crops compete for N with soil organisms that mobilize this nutrient in the form of microbial biomass. However, when the C/N ratio is high, the microorganisms that participate in the decomposition of organic matter are N-deficient and decrease in population, and organic matter decomposition/mineralization becomes slower (Valladares et al., 2008a), thus reducing production of the FAF.
The value of pH determined by different methods (water, KCl, CaCl2) was positively correlated with FAFst and negatively correlated with HUMst (Table 7). These results indicate that pH increases with an increase in the FAF. Benites et al. (2010) reported
Table 5. Stocks of the organic carbon (OCst), nitrogen (Nst), and fulvic acid fractions (FAFst),
humic acid fraction (HAFst), and humin (HUMst) in the Organosol profiles State/
Profile(1) Depth OCst Nst FAFst HAFst HUMst
m Mg ha-1
AL-1 0.00-0.65 30.30 1.90 3.20 7.50 14.10
AL-2 0.00-1.00 208.50 6.80 13.50 82.30 102.80
BA-2 0.00-0.81 284.60 7.40 12.60 112.60 138.30
BA-3 0.00-1.00 270.50 8.80 15.80 106.10 132.10
DF-1 0.00-1.00 233.60 11.50 25.70 115.30 69.40
ES-1 0.00-1.00 304.70 15.20 36.50 96.40 164.30
MG-1 0.00-1.00 231.60 11.20 25.80 87.30 99.40
MG-2 0.00-0.60 98.10 6.00 8.70 35.40 51.10
MS-2 0.00-0.40 198.60 8.90 12.30 100.90 80.70
PR-2 0.00-1.00 300.40 9.90 22.20 191.90 55.30
PR-3 0.00-0.20 58.60 3.20 8.00 11.80 32.90
RJ-3 0.00-0.90 201.00 13.00 24.20 69.00 87.50
RJ-4 0.00-0.74 273.30 11.50 50.40 97.00 33.50
RS-3 0.00-0.70 103.20 4.50 10.40 52.80 18.00
RS-4 0.00-1.00 320.30 8.70 12.40 110.10 155.90
RS-5 0.00-0.46 205.00 8.30 14.40 94.10 82.20
SC-2 0.00-1.00 134.00 4.70 8.00 43.80 67.80
SP-1 0.00-0.45 208.40 7.90 21.80 123.40 42.00
Average 203.59 8.30 18.11 85.43 79.29
Standard deviation 84.32 3.37 11.25 42.88 44.50
that availability and solubility of the FAF increased with a rise in pH, although it may heighten its susceptibility to loss through leaching or surface runoff. The concomitant increase in pH and FAF can also be explained by Al complexation since this fraction showed a negative correlation with this property. A reduction in pH value with a rise in the HUMst, in turn, is justified by the increase in H+
ions produced by the hydrolysis of HUM compounds, as evidenced by their positive correlation.
Total OCst, HAFst, and HUMst were positively correlated with H+
and H+Al contents (Table 7). Soil acidity tends to increase as the organic matter content in Organosols increases, especially due to H+ ions from organic compounds and hydrolysis of other compounds, such as sulfur. These results, along with data on pH correlations, suggest that the higher the FAFst is, the more suitable the soil acidity conditions for plant development are; besides that, the higher the OCst, HAFst, and HUMst are, the more acidic the soils are. Stocks of the organic carbon (OCst), nitrogen (Nst), fulvic acid fractions (FAFst), humic acid fraction (HAFst), and humin (HUMst); von Post index, total pore space (TPS), pyrophosphate index (PyI), mineral matter (MM), organic matter density (OMd), minimum residue (MinR); SB: sum of bases; CEC: cation exchange capacity, base saturation (V), potential acidity (H+Al).
Table 6. Factors estimated by PCA for Organosols based on the matrix of soils properties
Variable F1 F2 F3
PCA Factor
OCst 0.307 -0.899 0.075
FAFst -0.510 -0.685 0.010
HAFst 0.238 -0.854 -0.044
HUMst 0.391 -0.608 0.104
Nst -0.146 -0.837 0.284
Von Post -0.190 -0.746 -0.227
Rubbed fibers 0.185 0.619 0.236
TPS 0.645 0.547 0.382
PyI 0.032 0.584 -0.104
MM -0.792 -0.171 -0.375
OMd 0.182 -0.922 0.034
MinR -0.729 -0.367 -0.402
Ratio OC/N 0.693 0.011 -0.228
pH(H2O) -0.899 -0.022 0.142
pH(KCl) -0.909 0.067 -0.130
pH(CaCl2) -0.775 0.032 0.101
Ca2+
0.104 -0.148 0.883
Mg2+ 0.102 0.001 0.900
K+ -0.078 -0.036 0.431
Na+
-0.370 0.148 0.400
SB 0.085 -0.053 0.948
Al3+
0.627 0.076 -0.237
H+
0.821 -0.396 -0.079
CEC 0.807 -0.351 0.251
V -0.223 0.068 0.941
A positive correlation for H+
ions and total C, HAF, and HUM was also found by Ebeling et al. (2011) studying Brazilian Organosols.
The inverse correlation found between TPS and the FAFst (Table 7) indicates that an increase in soil porosity is associated with FAF reduction. This may occur because an increase in TPS may promote percolation and/or the loss of the highly mobile FAF in the profile. The positive association between the FAFst and MM (Table 7), in turn, indicates that mineral matter can promote stabilization of the FAF fraction, especially in soils rich in clay minerals.
Soil CEC values were positively correlated with the total OCst, HAFst, and HUMst, indicating higher cation exchange capacity in Organosols with greater content of OC and HAF and HUM fractions. This shows their main role in originating charges in soil, thus contributing to nutrient retention and complexation of metal cations.
The PCA showed formation of three clusters of Organosols. One of the groups includes the profiles AL2, BA2, BA3, RS4, RS5, and SC2 (Figure 2). All these Organosols are located in coastal plain areas, under a tropical climate (Northeast region) and subtropical climate (Southern region) of Brazil. They have sulfuric diagnostic horizons and show below-average FAFst values. According to Ebeling et al. (2013), Organosols with sulfuric horizons provide adequate environmental conditions for C accumulation in the form of the HAF as a result of the low pH value, which precipitates the humic acids (Kononova, 1966), thus reducing their mobility compared to fulvic acids (Sutton and Sposito, 2005). In addition, the solubility of the material influences its persistence in soil (Tombácz and Meleg, 1990; Schmidt et al., 2011).
The second group was composed of profiles MG2, MS2, PR3, and RS3 (Figure 2). Although these Organosols exhibited the highest diversity in terms of location, relief, and horizon characteristics, the lower than average values of OCst, Nst, and humic
3
2
1
0
-1
-2
-2 -1 0 1 2
F2
F1 RJ4
DF1
ES1
PR2
SP1 RJ3
MG1
AL1
MS2 MG2
RS3 PR3
SC2
RS5
AL2 BA3
BA2 RS4
Figure 2. Clusters of Brazilian Organosol profiles according to carbon and nitrogen stocks, obtained
fraction stocks were responsible for their grouping. All these profiles are located in the central part of the continent.
Three other profiles that are closely grouped in figure 2 are MG1, RJ3, and SP1. The RJ3 is located in flat topography with 40 m elevation and has high nutrient content and base saturation, with 0.90 m thickness of organic material. The MG1 occurs in flat topography, has an elevation of 874 m, 1,00 m thickness of organic material, and low base saturation (dystrophic). The SP1 is located at an elevation of 500 m and is also dystrophic, but has only 0.45 m of organic material. The MG1 and RJ3 had greater thickness of organic material and lower Bd than SP1, i.e., the profiles differ in elevation, nutrient contents, and thickness. The grouping of the profiles was related to the near average values of C and N stocks, resulting from the combination of different environments.
*: significant at 0.05 level. Stocks of the organic carbon (OCst), nitrogen (Nst), fulvic acid fractions (FAFst), humic acid fraction (HAFst), and humin (HUMst); von Post index, total pore space (TPS), pyrophosphate index (PyI), mineral matter (MM), organic matter density (OMd), minimum residue (MinR); SB: sum of bases; CEC: cation exchange capacity, base saturation (V), potential acidity (H+Al).
Table 7. Pearson’s correlation coefficient for organic carbon (OCst) and nitrogen (Nst) stocks,
fulvic acid fraction (FAFst), humic acid fraction (HAFst), and humin (HUMst), and other chemical and physical properties of the Organosols
OCst FAFst HAFst HUMst Nst
OCst 1.000
FAFst 0.484*
1.000
HAFst 0.879*
0.383*
1.000
HUMst 0.722*
0.193 0.455* 1.000
Nst 0.801*
0.705*
0.658* 0.639* 1.000
Von Post 0.529*
0.496* 0.629* 0.158 0.431*
Rubbed fibers -0.367* -0.389* -0.454* -0.099 -0.302*
TPS -0.224 -0.662* -0.284 -0.052 -0.364
PyI -0.413* -0.520* -0.404* -0.187 -0.435*
MM -0.176 0.421* 0.008 -0.316 0.104
OMd 0.943*
0.583* 0.826* 0.701* 0.829*
MinR 0.021 0.574* 0.108 -0.106 0.198
Ratio OC/N 0.194 -0.374* 0.191 0.085 -0.371*
pH(H2O) -0.246 0.473* -0.156 -0.444* 0.111
pH(KCl) -0.377 0.352* -0.292 -0.325* 0.017
pH(CaCl2) -0.229 0.357* -0.083 -0.472* 0.080
Ca2+
0.173 -0.030 0.143 0.134 0.282
Mg2+
0.043 -0.106 -0.050 0.074 0.113
K+
0.080 0.242 -0.034 0.103 0.253
Na+
-0.189 0.110 -0.232 -0.196 0.112
SB 0.089 -0.065 0.015 0.093 0.197
Al3+
0.075 -0.363* 0.088 0.133 -0.162
H+ 0.539* -0.160 0.545* 0.416* 0.084
CEC 0.504* -0.202 0.483* 0.406* 0.126
V -0.064 0.036 -0.143 -0.056 0.208
The PCA graphic did not properly discriminate the Brazilian Organosols according to environment and soil formation factors. However, some profiles show similarity and formed groups based on the OCst and Nst, and distribution of the humic fractions. Thus, this study shows the importance of these parameters in separation of Organosol classes and in defining the most sustainable management practices.
CONCLUSIONS
The OCst and Nst values exhibited a wide variation in the Organosols studied, which may be attributed to heterogeneity of deposits forming the organic layers, type of plant coverage, and soil management practices. The highest values of the OCst and Nst were found in the soils under pasture, and, overall, the highest carbon stocks in the humic fractions were found in the HUM and HAF.
The OCst, Nst, OMd, and the C stocks in the humic fractions were positively correlated. The values of acidity were lower in the soils with higher contents of mineral material, and low pH values were related to a high C/N ratio.
The OCst and Nst in the Organosols showed correlations with different chemical and physical properties in which the degree of soil organic matter decomposition was the most important factor, and it was inversely correlated, i.e., soils with the largest amount of least transformed organic matter had the lowest stocks of C and N.
ACKNOWLEDGMENTS
We thank the CNPq and FAPERJ for research productivity scholarships to Marcos Gervasio Pereira e Lúcia Helena Cunha dos Anjos (researchers of the FAPERJ “Nosso Estado” program), CNPq fellowship to Roni Fernandes Guareschi and the UFPI for research productivity scholarship to Gustavo Souza Valladares.
REFERENCES
Audet J, Johansena JR, Andersena PM, Baattrup-Pedersena A, Brask-Jensena KM, Elsgaardb L,
Kjaergaardb C, Larsena SO, Hoffmanna CC. Methane emissions in Danish riparian wetlands:
ecosystem comparison and pursuit of vegetation indexes as predictive tools. Ecol Indic. 2013;34:548-59. doi:10.1016/j.ecolind.2013.06.016
Batjes NH, Dijkshoorn JA. Carbon and nitrogen stocks in the soils of the Amazon Region. Geoderma. 1999;89:273-86. doi:10.1016/S0016-7061(98)00086-X
Batjes NH. Total carbon and nitrogen in the soils of the world. Eur Soil Sci. 1996;47:151-63. doi:10.1111/ejss.12115
Benites VM, Madari B, Machado PLOA. Extração e fracionamento quantitativo de substâncias
húmicas do solo: um procedimento simplificado de baixo custo. Rio de Janeiro: Centro Nacional
de Pesquisa de Solos; 2003. (Comunicado técnico, 16).
Benites VM, Moutta RO, Coutinho HLC, Balieiro FC. Análise discriminante de solos sob diferentes usos em área de Mata Atlântica a partir de atributos da matéria orgânica. Rev Árvore. 2010;34:685-90. doi:10.1590/S0100-67622010000400013
Bromick CJ, Lal R. Soil structure and management: a review. Geoderma. 2005;124:3-22. doi:10.1016/j.geoderma.2004.03.005
Cipriano-Silva R, Valladares GS, Pereira MG, Anjos LHC. Caracterização de Organossolos em ambientes de várzea do nordeste do Brasil. Rev Bras Cienc Solo. 2014;38:26-38. doi:10.1590/S0100-06832014000100003
Claessen MEC, organizador. Manual de métodos de análise de solo. 2ª ed. Rio de Janeiro: Centro Nacional de Pesquisa de Solos; 1997.
D’Amore DV, Lynn WC. Classification of forested Histosols in Southeast Alaska. Soil Sci Soc Am
J. 2002; 66:554-62. doi:10.2136/sssaj2002.0554
Ebeling AG, Anjos LHC, Pereira MG, Pinheiro EM, Valladares GS. Substâncias húmicas e relação
com atributos edáficos. Bragantia. 2011;70:157-65. doi:10.1590/S0006-87052011000100022
Ebeling AG, Anjos LHC, Pereira MG, Valladares GS, Pérez DV. Substâncias húmicas e suas relações com o grau de subsidência em Organossolos de diferentes ambientes de formação no Brasil. Rev Cienc Agron. 2013;44:225-33.
Ebeling AG, Anjos LHC, Pérez DV, Pereira MG, Valladares GS. Relação entre acidez e outros atributos químicos em solos com teores elevados de matéria orgânica. Bragantia. 2008;67:261-6. doi:10.1590/S0006-87052008000200019
Eswaran H, van den Berg E, Reich P. Organic carbon in soils of the world. Soil Sci Soc Am J. 1993;57:192-4.
Ewing JM, Vepraskas MJ. Estimating primary and secondary subsidence in an organic soil 15, 20, and 30 years after drainage. Wetlands. 2006;26:119-30. doi:10.1672/0277-5212(2006)26[119:EPASSI]2.0.CO;2
Fontana A, Pereira MG, Anjos LHC, Benites, VM. Distribution of organic carbon in the humic fractions of diagnostic horizons from Brazilian soils. Commun Soil Sci Plant Anal. 2008;39:951-71. doi:10.1080/00103620801925323
Gorham E. Northern Peatlands: role in the carbon cycle and probable responses to climatic warming. Ecol Appl. 1991;1:182-95. doi:10.2307/1941811
Gundelwein A, Muller-Lupp T, Sommerkorn M, Haupt ETK, Pfeiffer EM, Wiechmann H. Carbon
in tundra soils in the Lake Labaz region of arctic Siberia. Eur J Soil Sci. 2007;58:1164-74. doi:10.1111/j.1365-2389.2007.00908.x
Hayes MHB, Clapp CE. Humic substances: considerations of compositions,
aspects of structure, and environmental influences. Soil Sci. 2001;166:723-7.
doi:10.1097/00010694-200111000-00002
Henry M, Valentini R, Bernoux M. Soil carbon stocks in ecoregions of Africa. Biogeosci Discuss. 2009;6:797-823. doi:10.5194/bgd-6-797-2009
IUSS Working. Group WRB. World reference base for soil resources 2014: International soil
classification system for naming soil and creating legends for soil maps. Rome: FAO; 2014.
(World Soil Resources Report, 103).
Jones RJA, Hiederer R, Rusco E, Montanarella L. Estimating organic carbon in the soils of Europe for policy support. Eur J Soil Sci. 2005;56:655-71. doi:10.1111/j.1365-2389.2005.00728.x
Kämpf, N, Schneider, P. Caracterização de solos orgânicos do Rio Grande do Sul: Propriedades
morfológicas e físicas como subsídios à classificação. Rev Bras Cienc Solo. 1989;13:227-36.
Kechavarzi C, Dawson Q, Leeds-Harrison PB. Physical properties of low-lying agricultural peat soils in England. Geoderma. 2010;154:196-202. doi:10.1016/j.geoderma.2009.08.018
Kononova MM. Soil organic matter: its nature, its role in soil formation and in soil fertility. 2nd
ed. New York: Pergamon Press; 1966.
Leifeld J, Müller M, Fuhrer J. Peatland subsidence and carbon loss from drained temperate fens. Soil Use Manage. 2011;27:170-6. doi:10.1111/j.1475-2743.2011.00327.x
Lynn WC, Mc Kinzie WE, Grossman RB. Field laboratory tests for characterization of
Histosols. In: Aandahl AR, Buol SW, Hill DE, Bailey HH, editors. Histosols: their characteristics,
classification, and use. Madison: Soil Science Society of America; 1974. p.11-20. (Special
Page SE, Wüst RAJ, Rieley JO, Shotyk W, Limin SH. A record of Late Pleistocene and Holocene carbon accumulation and climate change from an equatorial peat bog (Kalimantan, Indonesia): implications for past, present and future carbon dynamics. J Quater Sci. 2004;19:625-35. doi:10.1002/jqs.884
Pereira MG, Anjos LHC, Valladares GS. Organossolos: ocorrência, gênese, classificação,
alterações pelo uso agrícola e manejo. Tópicos Cienc Solo. 2005;4:233-76.
Pinheiro EFM, Pereira MG, Anjos LHC, Machado PLOA. Fracionamento densimétrico da matéria orgânica do solo sob diferentes sistemas de manejo e cobertura vegetal em Paty do Alferes (RJ). Rev Bras Cienc Solo. 2004;28:731-7. doi:10.1590/S0100-06832004000400013
Santos HG, Jacomine PKT, Anjos LHC, Oliveira VA, Lumbreras JF, Coelho MR, Almeida JA, Cunha
TJF, Oliveira JB. Sistema brasileiro de classificação de solos. 3ª ed. Brasília, DF: Embrapa; 2013.
Schmidt MWI, Torn MS, Abiven S, Dittmar T, Guggenberger G, Janssens I, Kleber M, Kogel-Knabner I, Lehmann J, Manning DAC, Nannipieri P, Rasse DP, Weiner S, Trumbore S. Persistence of soil organic matter as an ecosystem property. Nature. 2011;478:49-56. doi:10.1038/nature10386
Schnitzer M. Binding of humic substances by soil mineral colloids. In: Huang PM, Schnitzel M, editors. Interactions of soil minerals with natural organics and microbes. Wisconsin: Soil Science Society of America; 1986. p.83-7.
Stevenson FJ. Humus chemistry: genesis, composition, reactions. 2nd
ed. New York: John Wiley and Sons; 1994.
Sutton R, Sposito G. Molecular structure in soil humic substances: the new view. Environ Sci Technol. 2005;9:9009-15. doi:10.1021/es050778q
The International Union of Soil Sciences – IUSS. Working Group WRB. World Reference Base for Soil Resources 2006. Rome: FAO; 2006. (World Soil Resources Reports, 103).
The International Union of Soil Sciences – IUSS. Working Group WRB. World Reference Base
for Soil Resources 2014. International soil classification system for naming soils and creating
legends for soil maps. Rome: FAO; 2014. (World Soil Resources Reports, 106).
Tombácz E, Meleg E. A theoretical explanation of the aggregation of humic substances as a function of pH and electrolyte concentration. Org Geochem. 1990;15:375-81. doi:10.1016/0146-6380(90)90164-U
Valladares GS. Caraterização de Organossolos, auxílio à sua classificação [tese]. Rio de Janeiro:
Universidade Federal Rural do Rio de Janeiro; 2003.
Valladares GS, Gomes EG, Mello JCCBS, Pereira MG, Anjos LHC, Ebeling AG, Benites VM. Análise dos componentes principais e métodos multicritério ordinais no estudo de Organossolos e solos
afins. Rev Bras Cienc Solo. 2008a;32:285-96. doi:10.1590/S0100-06832008000100027
Valladares GS, Pereira MG, Anjos LHC, Benites VM, Ebeling AG, Mouta RO. Humic substance fractions and attributes of Histosols and related high-organic-matter soils from Brazil. Commun Soil Sci Plant Anal. 2007;38:763-77. doi:10.1080/00103620701220759
Valladares GS, Pereira MG, Anjos LHC, Ebeling AG. Caracterização de solos brasileiros com elevados teores de material orgânico. Magistra. 2008b;20:95-104.
Vegas-Vilarrúbia T, Baritto F, López P, Meleán G, Ponce ME, Mora L, Gómez O. Tropical Histosols
of the lower Orinoco Delta, features and preliminary quantification of their carbon storage.
Geoderma. 2010;155:280-8. doi:10.1016/j.geoderma.2009.12.011
von Post L. Sveriges geologiska undersöknings torvinventering och nåogra av dess hittils vaanna resultat, (In Swedish). Sven Mosskulturfören Tidskr. 1922;33:1-27.
Yu S, Ehrenfeld JG. The effects of changes in soil moisture on nitrogen cycling in acid