* Corresponding author: E-mail: [email protected]
Received: August 17, 2016 Approved: November 1st, 2016
How to cite: Camêlo DL, Ker JC, Fontes MPF, Corrêa MM, Costa ACS, Melo VF. Pedogenic iron oxides in iron-rich oxisols developed from mafic rocks. Rev Bras Cienc Solo. 2017;41:e0160379.
https://doi.org/10.1590/18069657rbcs20160379
Copyright: This is an open-access article distributed under the terms of the Creative Commons Attribution License, which permits unrestricted use, distribution, and reproduction in any medium, provided that the original author and source are credited.
Pedogenic Iron Oxides in Iron-Rich
Oxisols Developed from Mafic Rocks
Danilo de Lima Camêlo(1)*, João Carlos Ker(2)
, Maurício Paulo Ferreira Fontes(2)
, Marcelo Metri Corrêa(3), Antonio Carlos Saraiva da Costa(4) and Vander Freitas Melo(5)
(1)
Universidade de São Paulo, Escola Superior de Agricultura “Luiz de Queiroz”, Departamento de Ciência do Solo, Programa de Pós-graduação em Ciência do Solo, Piracicaba, São Paulo, Brasil.
(2)
Universidade Federal de Viçosa, Departamento de Solos, Viçosa, Minas Gerais, Brasil. (3)
Universidade Federal Rural de Pernambuco, Unidade Acadêmica de Garanhuns, Garanhuns, Pernambuco, Brasil. (4)
Universidade Estadual de Maringá, Departamento de Agronomia, Maringá, Paraná, Brasil. (5)
Universidade Federal do Paraná, Departamento de Solos e Engenharia Agrícola, Curitiba, Paraná, Brasil.
ABSTRACT: Despite the considerable amount of information on the mineralogical characteristics of pedogenic Fe oxides in Brazilian soils, there are few studies on Fe-rich soils developed from mafic rocks with taxonomic identities at lower categorical levels. This study evaluated the mineralogical characteristics of pedogenic Fe oxides in B horizons (Bw) of Fe-rich Oxisols developed from several mafic rocks in the state of Minas Gerais, Brazil. The Bw horizons were sampled at a 0.8-1.0 m depth in 13 Ferric and Perferric Rhodic Oxisols along with a Mesoferric Typic Oxisol originating from basalt, gabbro, tuffite, amphibolite and itabirite in Minas Gerais. The selected soils have taxonomic identities up to the fourth categorical level of the Brazilian System of Soil Classification. In the laboratory, the following analyses were made: a) powder X ray diffraction (XRD) of the clay fraction before and after selective concentration of Fe oxides by silicate alkaline dissolution (5 mol L-1 NaOH); b) selective chemical dissolution of the clay fraction by citrate-bicarbonate-dithionite (CBD), acid ammonium oxalate (AAO), and sulfuric acid (H2SO4 1.8 mol L
-1); c) quantitative estimation of minerals in the clay fraction through allocation of phases from the XRD patterns, magnetic susceptibility of the clay fraction, and quantification of elements after sulfuric acid digestion (H2SO4 1:1) of the air-dried fine earth and treatment of the clay fraction with CBD; and d) estimation of the mean crystal size (MCS), specific surface area (SSA), and isomorphic Al-substitution (IS) of hematite, goethite, and maghemite from the XRD patterns obtained from concentrates of Fe oxides. The results showed that estimation of Fe content of maghemite by selective dissolution with 1.8 mol L-1 H2SO4 may not be accurate enough to realistically reflect the maghemite contents in the soil sample. The Al content extracted may also be influenced by other minerals that are sources of this element. Hematite crystals were predominantly placoid in shape in all Rhodic Oxisols and had smaller SSA compared to goethite, which showed both isodimensional and asymmetric habit. Higher crystallinity of maghemite and the IS values generally lower than those of hematite and goethite suggest that in well-drained soils derived from mafic rocks, the IS phenomenon in maghemites seems to result from pedogenetic advancement after its formation from magnetite oxidation.
Keywords: hematite, maghemite, crystallographic characteristics, Al-substitution, selective dissolution.
INTRODUCTION
Knowledge of the conditions under which Fe oxides (oxides, hydroxides, and oxyhydroxides) are formed in pedogenic and geochemical environments is critical for interpretation of current and past processes in soils (Kämpf and Curi, 2000). These minerals are involved in various soil phenomena, such as in adsorption of anions, cations, and organic compounds, as well as in fixing P and heavy metals. In addition, they are linked to some morphological properties, such as color, structure, and magnetism, inducing the formation of aggregates and cementing of other important soil components, namely nodules, concretions, plinthites, petroplinthites, ortsteins, etc. (Schwertmann and Taylor, 1989).
Goethite (Gt), responsible for yellow color, is the most common antiferromagnetic Fe oxide, followed by hematite (Hm), which causes red coloring in soils (Schwertmann and Taylor, 1989; Kämpf and Curi, 2000; Cornell and Schwertmann, 2003; Fontes and Carvalho Jr., 2005). Maghemite (Mh), ferromagnetic Fe oxide, is common in several soil classes in tropical and subtropical environments (Schwertmann and Taylor, 1989). Although it generally occurs in small amounts in some soil classes, Mh provides high magnetization to soils originating from basic igneous rocks (Fabris et al., 1997a; Costa et al., 1999) and other Fe-rich materials (Costa et al., 2014; Carvalho Filho et al., 2015). In Rhodic Oxisols developed from basic rocks, the Mh content increases considerably and may account for up to 40 % of the mass of the Fe oxide content in the clay fraction (Costa et al., 1999).
Methods of identification, quantification, and characterization of various mineral phases of Fe oxides are particularly important. Some of the main methods used include X ray diffraction (XRD – powder method) and selective chemical dissolution with citrate-bicarbonate-dithionite of sodium (CBD) (Mehra and Jackson, 1960), acid ammonium oxalate (AAO) (McKeague and Day, 1966), and sulfuric acid (Schwertmann and Fechter, 1984).
Despite the high geochemical affinity of Fe with various metals, Al3+ is the main isomorphic metal cation substituent in the structure of Fe oxides (IS). The amounts 0.33, 0.15, and 0.33 mol of IS mol-1 are established limits for Gt, Hm, and Mh, respectively (Schwertmann and Kämpf, 1985; Kämpf and Curi, 2000; Cornell and Schwertmann, 2003). Isomorphic substitution is a natural phenomenon and is more a rule than an exception in pedogenic Fe oxides of tropical climate. Generally, higher degrees of isomorphic substitution are associated with weathered soils and with greater Al activity, resulting in considerable changes in the size of the unit cell and crystallinity of the mineral particle (Fontes and Weed, 1991).
Regarding size, Gt usually features an isodimensional crystallization habit and its spherical habit is confirmed by electron microscopy techniques in tropical soils (Schulze and Schwertmann, 1984; Schwertmann and Kämpf, 1985; Melo et al., 2001; Correa et al., 2008) and by similar values for mean crystal size (MCS) in the d110 and d111 directions obtained by the Scherrer equation (Klug and Alexander, 1954; Fontes and Weed, 1991). However, Melo et al. (2001) also found different MCS values for some samples, and growth was greater in the d110 direction. Hematite commonly has the form of circular plates (Schwertmann and Kämpf, 1985; Fontes and Weed, 1991; Melo et al., 2001). Maghemite is usually formed from the transformation of the solid state of other Fe oxides and, for the most part, it adopts the growth habit of its precursor (Cornell and Schwertmann, 2003).
saturation magnetization, although with differences between soils developed from the same parent material (Carmo et al., 1984; Ferreira et al., 1994; Fabris et al., 1997a; Costa et al., 1999; Silva et al., 2005; Silva et al., 2010; Cervi et al., 2014; Costa et al., 2014; Carvalho Filho et al., 2015).
Once the mineralogical variations in pedogenic Fe oxides are determined by the parent material and pedoenvironmental conditions, it is hypothetically assumed that will be possible to observe quantitative and crystallographic differences in these minerals even between groups of taxonomically similar soils. Thus, this study evaluated the mineralogical characteristics of pedogenic Fe oxides in B horizons (Bw) of Fe-rich Oxisols developed from several mafic rocks in the state of Minas Gerais, Brazil.
MATERIALS AND METHODS
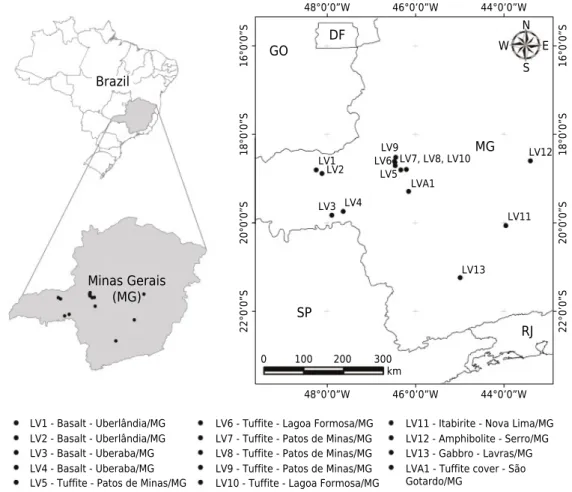
Samples were collected from the 0.8-1.0 m depth in different regions of the state of Minas Gerais in the Bw horizons of 13 Rhodic Oxisols originating from various parent materials: ferric (total contents of Fe2O3 between 180 and 360 g kg
-1 - LV
1, LV2, LV3, LV5, LV6, LV10, LV12,
and LV13) and perferric (total contents of Fe2O3 higher than 360 g kg -1 - LV
4, LV7, LV8, LV9,
and LV11). A mesoferric Typic Oxisol was also collected (total contents of Fe2O3 between 80 g kg-1 and 180 g kg-1 - LVA
1) (Figure 1, Table 1). According to the Brazilian System of Soil Classification (SiBCS) (Santos et al., 2013), the taxonomic names ferric, perferric, and mesoferric are based on the Fe content extracted after sulfuric digestion of air-dried fine earth (ADFE), which is obtained from air drying and breaking up soil samples, and then sieving them through a 2-mm mesh (Donagema et al., 2011).
After separation of particle size fractions (Jackson, 1979), minerals of the clay fraction were estimated by the allocation method proposed by Resende et al. (1987) with ALOCA
48°0’0”W 46°0’0”W 44°0’0”W
16°0’0”S
18°0’0”S
22°0’0”S
20°0’0”S
16°0’0”S
18°0’0”S
22°0’0”S
20°0’0”S
48°0’0”W 46°0’0”W 44°0’0”W
Minas Gerais (MG)
SP
MG GO
DF N
S
W E
RJ
LV1 LV2
LV3 LV4 LV9 LV6
LV5
LV7, LV8, LV10
LVA1
LV12
LV11
LV13
0
km 300 200 100
LV1 - Basalt - Uberlândia/MG LV2 - Basalt - Uberlândia/MG LV3 - Basalt - Uberaba/MG LV4 - Basalt - Uberaba/MG LV5 - Tuffite - Patos de Minas/MG
LV6 - Tuffite - Lagoa Formosa/MG LV7 - Tuffite - Patos de Minas/MG LV8 - Tuffite - Patos de Minas/MG LV9 - Tuffite - Patos de Minas/MG LV10 - Tuffite - Lagoa Formosa/MG
LV11 - Itabirite - Nova Lima/MG LV12 - Amphibolite - Serro/MG LV13 - Gabbro - Lavras/MG LVA1 - Tuffite cover - São Gotardo/MG
Brazil
software (Moura Filho et al., 1995). The chemical elements of minerals in the clay fraction [extracted by sulfuric digestion with ADFE (1:1 ratio with H2SO4) (Donagema et al., 2011) and by five successive extractions with dithionite-citrate-bicarbonate of sodium (CBD) at 80 °C (Mehra and Jackson, 1960)] were allocated in the minerals identified by X ray diffraction (XRD) in the same clay fraction without treatment (natural clay). Diffractograms of X rays were obtained in the X’Pert Pro Panalytical device with CoKα radiation, operating at 40 kV and 30 mA. The scan range was 4 to 50 °2θ, with an interval of 0.01 °2θ s-1. Magnetic susceptibility per mass unit was quantified by measuring at low frequency (0.47 kHz) through a Bartington MS2 system (Bartingon Instruments LTD, Oxford, England), coupled to an MS2B sensor (Dearing, 1999). Determining magnetic susceptibility in the clay fraction allowed the Mh rate in soil to be estimated (Resende et al., 1987).
In addition to the sequential extractions with CBD for complete removal of pedogenic Fe oxides, including the crystalline (basically Gt, Hm, and Mh) and low crystalline (ferrihydrite - Fr) (Fed) forms (Mehra and Jackson, 1960), natural clay samples were also subjected to a single extraction with 0.2 mol L-1 acid ammonium oxalate (AAO) at pH 3 for removal of only Fe from the low crystallinity phases (Feo) (McKeague and Day, 1966). For selective Fe dissolution of Mh, the clay fraction was subjected to only one extraction Table 1. Soil classification according to the Brazilian System of Soil Classification – SiBCS and U.S.
Soil Taxonomy (SSS) and quantitative estimate of the mineralogical assemblage of the clay fraction
SiBCS(1)
SSS(2)
K Gb Gt Hm Mh An/Rt(3)
g kg-1
Latossolo Vermelho Distroférrico típico - LV1
Rhodic
Hapludox 433.1 67.2 23.4 134.4 41.5 22.4
Latossolo Vermelho Acriférrico típico - LV2
Rhodic
Acrudox 175.9 338.5 16.5 93.3 91.0 27.0
Latossolo Vermelho Acriférrico típico - LV3
Rhodic
Acrudox 209.2 273.5 12.2 98.3 91.3 16.8
Latossolo Vermelho Perférrico típico - LV4
Rhodic
Acrudox 139.4 361.3 23.5 117.2 80.3 20.5
Latossolo Vermelho Acriférrico típico - LV5
Rhodic
Acrudox 105.2 437.7 24.5 121.8 57.9 37.3
Latossolo Vermelho Distroférrico típico - LV6
Rhodic
Hapludox 277.2 276.8 52.5 88.3 11.3 54.1
Latossolo Vermelho Perférrico típico - LV7
Rhodic
Hapludox 54.4 228.2 12.0 64.1 161.8 49.7
Latossolo Vermelho Perférrico típico - LV8
Rhodic
Acrudox 127.1 291.9 3.4 110.6 123.6 52.8
Latossolo Vermelho Perférrico típico - LV9
Rhodic
Hapludox 71.4 189.4 n.d. 62.3 208.6 31.3
Latossolo Vermelho Distroférrico típico - LV10
Rhodic
Hapludox 154.6 173.0 8.6 130.1 121.8 50.9
Latossolo Vermelho Perférrico típico - LV11
Rhodic
Acrudox 21.9 138.2 85.9 226.2 217.1 8.3
Latossolo Vermelho Distroférrico típico - LV12
Rhodic
Hapludox 221.1 183.3 60.5 173.7 20.8 17.7
Latossolo Vermelho Acriférrico típico - LV13
Rhodic
Acrudox 256.1 259.8 39.3 112.6 41.4 5.6
Latossolo
Vermelho-Amarelo Ácrico típico - LVA1
Typic
Acrudox 196.8 435.3 52.9 64.6 1.3 48.3
(1)
Santos et al. (2013); (2) Soil Survey Staff (2014); (3)
with 1.8 mol L-1 H2SO4 at 80 °C for 2 h (FeH2SO4) (Schwertmann and Fechter, 1984, modified by Costa et al., 1999). The contents of Fe and Al solubilized by the CBD, AAO, and H2SO4 extractants were determined by atomic absorption spectroscopy.
Concentrates of Fe oxides were obtained by selective dissolution of silicate minerals in the clay fraction, using 5-mol L-1 NaOH solution under heating (Norrish and Taylor, 1961; Kämpf and Schwertmann, 1982). The mineral components of concentrated samples were identified by XRD with scanning from 4 to 80 °2θ. The samples were ground in an agate mortar along with 10 % silicon, used as an internal standard for correction of distortions (position and width of half-height of peaks), and mounted on slides excavated without guidance (powder).
The Hm/(Hm+Gt) ratio was estimated based on reflex areas of d012 of Hm and d110 of Gt in Fe oxide concentrates. The formula used for calculation was suggested by Resende et al. (1987): [Hm/(Hm + Gt)] = 4 × AHm012/(4 × AHm012 + AGt110), in which A is an area of the respective reflexes.
The mean crystal size (MCS) was calculated from the width of the half-height of reflexes d110 and d111 of Gt, d104, d110, and d012 of Hm, and d220 and d400 of Mh, using the Scherrer equation (Klug and Alexander, 1954). The instrumental error correction was made using the adjustment equation established by Melo et al. (2001) from the data presented by Klug and Alexander (1954) for low and moderate Bragg angles (°2θ). Next, values of the specific surface area (SSA) were determined for Gt and Hm. For Gt, the isodimensional shape (sphere) was adopted (Schulze and Schwertmann, 1984; Schwertmann and Kämpf, 1985; Fontes and Weed, 1991; Melo et al., 2001): SSAGt = (1049/MCS100) - 5 (m
2 g-1),
in which MCS100 = d110 × 0.42 nm (Schulze and Schwertmann, 1984; Schwertmann and Kämpf, 1985). For Hm, the shape of round plates was adopted (Schwertmann and Kämpf, 1985; Fontes and Weed, 1991; Melo et al., 2001), and the geometric shape of a cylinder was used: SSAHm = 2 × (r + h) × 10
3/r × h × d (m2 g-1), in which r = MCS
110 × 0.71/2, h = MCS012 × 0.59, and d = 5.26 g cm-3 (Schwertmann and Kämpf, 1985).
According to the Vegard Law, the occurrence and magnitude of isomorphic substitution of Fe by Al (IS) may be quantified from the regression between the volume of the mineral unit cell and the degree of IS [Al/(Fe+Al), mol mol-1]. IS in the structure of Gt, Hm, and Mh was estimated by the position of the reflexes of these minerals obtained by XRD in the concentrates of Fe oxides. The position of the silicon peaks in each sample was used for instrumental corrections. In Gt, IS was calculated using the equation Al (mol mol−1) = 17.30 - 5.72 × c0, in which the c0 size of the unit cell in Gt is obtained from d110 and d111 reflexes by c0 = (1/d
2
111 - 1/d 2
110)
0.5 (Schulze, 1984). For Hm, the equation Al (mol mol-1) = 31.09 - 6.17 × a0 was used, in which the a0 size of the unit cell in Hm is obtained by d110 reflexes for a0 = 2 × d110 (Schwertmann et al., 1979). In Mh, IS was estimated by the equation Al (mol mol−1) = [0.8343 - a0] / 2.22 × 10⁻⁴, in which a0 corresponds to the size of the unit cell in Mh perpendicular to plane d220 (Schwertmann and Fechter, 1984).
The Pearson correlations between the variables analyzed were determined using the statistical software Statistic v.9 (Carvalho Filho et al., 2015).
RESULTS AND DISCUSSION
Mineralogical composition of the clay fraction
The oxide dominance in the clay fraction, essentially gibbsite, hematite, maghemite, and anatase, is a consequence of the significant loss of exchangeable cations and silica (ferralitization), promoting accumulation of residual minerals in soils, as well as the desilicated nature of the parent materials (Carmo et al., 1984; Melo et al., 2001; Costa et al., 2014; Carvalho Filho et al., 2015). Only LV1 showed a significant amount of kaolinite, possibly due to the influence of detrital sediments on the soil surface in South America (King, 1956).
Hematite (Hm) is the main antiferromagnetic Fe oxide in soils and its maximum content was observed in LV11 (perferric) (226.2 g kg
-1), formed from itabirite (Table 1). However, a considerable amount of goethite (Gt) was also observed in LV11, which was not expressed in color because of the high pigmenting power of Hm (Resende, 1976; Fontes and Carvalho Jr., 2005). The same behavior was observed in LV12. Curi and Franzmeier (1987) reported the presence of significant quantities of Gt, higher than Hm, in a Rhodic Oxisol formed from itabirite. The authors highlight that the lithogenetic heritage of Gt, concentrated in its pigmenting effect on the coarse fraction (sand and silt), explains the redder colors in soils formed from basalt, with Hm contents greater than Gt contents.
The occurrence of Hm and Gt oxides in soils is generally assigned to neoformation from the weathering of primary minerals containing Fe in their structure, or inherited directly from the parent material, as reported for Hm (Barbosa and Lagoeiro, 2010; Costa et al., 2014; Ávila et al., 2015) and Gt (Curi and Franzmeier, 1987) of ferriferous formations in the Ferriferous Quadrilateral in Minas Gerais. However, the predominance of Hm or Gt is controlled by the environmental conditions of soil formation (Curi and Franzmeier, 1984; Schwertmann and Taylor, 1989; Kämpf and Curi, 2000). The higher Fe content, common in soils from mafic rocks, associated with a lower degree of moisture, favored Hm formation and the predominance of this mineral over Gt in all soils studied. In contrast, LV6 (3.5 YR hues) and LVA1 (5 YR hue) had nearly equal Hm and Gt contents, indicating wetter pedoenvironmental conditions.
Maghemite (ferromagnetic Fe oxide - Mh) occurred in all soils, even if virtually inexpressive in LVA1 and LV6 (Table 1). In Brazil, for soils developed from mafic rocks, Mh formation is more associated with magnetite oxidation inherited from the parent material (Curi and Franzmeier, 1987; Fontes and Weed, 1991) as well as transformation from other magnetic phases, such as magnesiumferrite commonly found in tuffite and in the sand fraction of soils originating from it (Fabris et al., 1997b; Silva et al., 2005). However, under conditions of redox oscillations that occur during the wetting and drying cycles, fine magnetite grains may also be formed and subsequently oxidized, giving rise to Mh (Maxbauer et al., 2016). Although less common, another formation of Mh under field conditions is from transformation of other pedogenic Fe oxides (Hm and Gt) when under high temperatures in the presence of organic C (Curi and Franzmeier, 1987; Fontes and Weed, 1991; Costa et al., 1999; Fontes et al., 2000). The low expression of Mh in LV6 and LVA1 might be attributable to lithological variations and/or preferential dissolution of Mh rather than Hm in wetter pedoenvironments (Curi and Franzmeier, 1984).
The presence of Mh, in some cases at higher rates than Hm or Gt (LV7, LV8, and LV9), highlights the need to quantitatively use the Mh contents or the magnetic properties of soils as criteria for taxonomic separation, especially for the Fe-rich Rhodic Oxisols (Carvalho Filho et al., 2015). In these cases, there is inconsistency in the exclusive use of color, dictated by the ratio Hm/(Hm + Gt) as criterion of the second-level category (suborder) in SiBCS (Santos et al., 2013). This consideration also applies to international classification systems, such as Soil Taxonomy (Soil Survey Staff, 2014) and the World Reference Base (IUSS, 2015), which do not have criteria for separating soil according to magnetic properties.
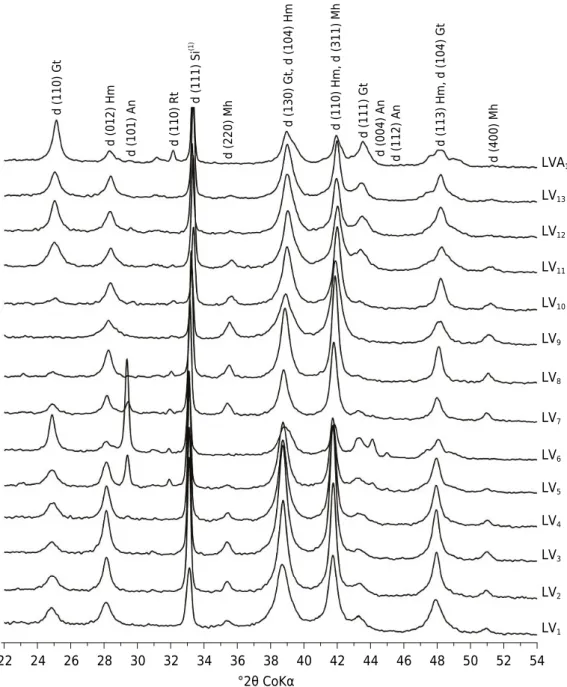
(Table 1). The genesis of these minerals may be related to weathering of minerals, such as ilmenite, or linked to the release of Ti during the weathering of silicates, such as pyroxene, amphibole, and biotite (Taylor et al., 1983). Anatase may also originate from Ti-magnetite (Taylor et al., 1983), fairly common in tuffite soils (Fabris et al., 1994). Soils formed from tuffite (LV5, LV6, LV7, LV8, LV9, LV10, and LVA1) had higher contents of anatase/rutile, exceeding the maximum limit of 30 g kg-1 generally found in the clay fraction of soils (Jackson, 1964). Rutile from XRD of Fe oxide concentrates also occurred in these soils (Figure 2). This shows the high influence of the parent material on Ti oxide content in the soil clay fraction.
Selective dissolution of Fe oxides
In general, all soils exhibited high contents of Fed, reaching 480.5 g kg
-1 of clay in soil LV11 (perferric). High Fed contents were also found by other authors for soils formed from itabirite (Table 2) (Curi and Franzmeier, 1987; Costa et al., 2014; Carvalho Filho et al., 2015). The lowest contents of Fed and FeH2SO4 were observed in LV6 and LVA1, suggesting both lower Fe content in the parent material, due to tuffite heterogeneity
°2θ CoKα
22 24 26 28 30 32 34 36 38 40 42 44 46 48 50 52 54
LV13 LVA1
LV12
LV11
LV10
LV9
LV8
LV7
LV6
LV5
LV4
LV3
LV2
LV1
d (110) G
t
d (012) Hm
d (101) A
n
d (110) R
t
d (111) S
i
(1)
d (220) M
h
d (400) M
h
d (130) Gt, d (104) H
m
d (110) Hm, d (311) M
h
d (111) G
t
d (004) A
n
d (112) A
n
d (113) Hm, d (104) G
t
Figure 2. X ray patterns from the clay fraction after treatment for Fe oxide concentration. (1)
Internal
(Guimarães, 1955), and deferrification processes occurring in wetter pedoenvironments (Curi and Franzmeier, 1984; Schwertmann and Taylor, 1989; Kämpf and Curi, 2000).
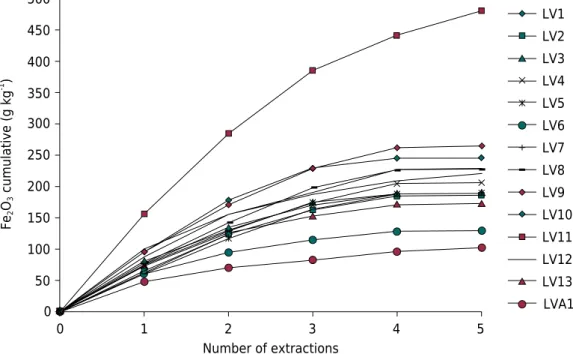
At least five successive extractions with CBD were required for total removal of the Fe contained in pedogenic Fe oxides (Figure 3). The slope of curves of cumulative Fed contents were lower in soils with greater participation of Gt (LVA1 and LV6). Conversely, Inda Junior and Kämpf (2003) highlighted that two successive extractions with CBD, heated at 80 °C, are enough to extract almost all (>98 %) pedogenic Fe oxides, regardless
Table 2. Silicon, Al, Fe, and Ti contents determined by sulfuric digestion of ADFE (Sis, Als, Fes , and Tis) and Fe and Al obtained in the clay fraction by sequential extractions with citrate-bicarbonate-dithionite (CBD) (Fed and Ald), only one extraction with acid oxalate
ammonium (AAO) (Feo and Alo) and 1.8 mol L-1 H2SO4 (FeH2SO4 and AlH2SO4) all presented as oxides
Soil Sulfuric digestion CBD AAO 1.8 mol L
-1
H2SO4 Feo Fed FeH2SO4 FeH2SO4 ISd(1)
ISH2SO4(2)
SiO2 Al2O3 Fe2O3 TiO2 Fe2O3 Al2O3 Fe2O3 Al2O3 Fe2O3 Al2O3 Fed Fes Fed Fes
g kg-1 mol mol-1
LV1 201.4 222.3 310.7 69.7 189.5 25.5 10.2 8.5 85.5 119.1 0.05 0.61 0.45 0.28 0.174 0.686
LV2 81.8 303.5 345.1 71.8 186.2 20.8 12.0 10.4 77.3 173.0 0.06 0.54 0.42 0.22 0.149 0.778
LV3 97.3 272.0 330.0 71.7 189.9 19.7 10.2 10.0 80.0 199.9 0.05 0.58 0.42 0.24 0.139 0.797
LV4 64.8 303.1 370.8 71.5 206.6 23.0 11.2 10.2 75.1 176.0 0.05 0.56 0.36 0.20 0.148 0.786
LV5 48.9 340.3 293.0 60.0 189.1 23.8 8.2 10.2 73.7 196.7 0.04 0.65 0.39 0.25 0.164 0.807
LV6 128.9 307.3 235.4 69.6 129.7 39.4 10.1 13.6 67.0 146.3 0.08 0.55 0.52 0.28 0.322 0.774
LV7 25.3 178.5 459.2 107.3 228.8 26.0 19.4 10.2 84.6 142.4 0.08 0.50 0.37 0.18 0.151 0.725
LV8 59.1 250.6 372.0 84.3 227.8 23.9 17.4 9.6 78.3 129.7 0.08 0.61 0.34 0.21 0.141 0.722
LV9 33.2 158.2 438.4 107.6 264.8 40.4 35.4 15.3 93.7 142.1 0.13 0.60 0.35 0.21 0.193 0.704
LV10 71.9 187.7 315.6 79.3 246.1 36.3 22.4 12.2 78.8 117.7 0.09 0.78 0.32 0.25 0.187 0.700
LV11 10.2 138.3 579.4 21.1 480.5 126.2 25.6 11.1 94.9 91.5 0.05 0.83 0.20 0.16 0.291 0.602
LV12 102.8 235.5 286.2 28.3 220.1 38.9 8.7 12.9 71.1 106.7 0.04 0.77 0.32 0.25 0.216 0.702
LV13 119.1 287.5 257.4 16.3 172.7 29.4 5.3 8.0 73.4 161.4 0.03 0.67 0.42 0.29 0.210 0.775
LVA1 91.5 373.1 161.4 48.3 102.4 30.9 3.1 9.8 26.4 166.4 0.03 0.63 0.26 0.16 0.320 0.908
(1) Isomorphic substitution of Fe by Al calculated from the molar ratio of the elements extracted by CBD, in which IS
d = [Ald/(Ald + 0.483Fed)] (Cornell and Schwertmann, 2003); (2) Isomorphic substitution of Fe by Al calculated from the molar ratio of the elements extracted by 1.8 mol L-1
H2SO4 in
which ISH2SO4 = [AlH2SO4/(AlH2SO4 + 0.483FeH2SO4)] (Cornell and Schwertmann, 2003).
Number of extractions
Fe
2
O3
cumulative (g kg
-1 )
0 0
1 2 3 4 5
50 100 150 200 250 300 350 400 450 500
LVA1 LV13 LV12 LV10 LV8 LV7 LV6 LV4 LV3 LV2 LV1
LV5
LV9
LV11
of the oxide content in the samples. This was not confirmed by Gualberto et al. (1987) and Corrêa et al. (2015), who reported the need for more than four extractions, due to the significant influence of crystallinity and isomorphic substitution of Fe by Al on the stability of Fe oxides in soils (Inda Junior and Kämpf, 2005; Correa et al., 2008; Corrêa et al., 2015; Carvalho Filho et al., 2015). Fontes (1988) observed that the slopes of the curves of cumulative Fe were higher as Hm and Gt showed lower isomorphic substitution of Fe by Al. The author concluded that only two extractions would not be enough to extract most aluminous Gt.
The Fe contents obtained from sulfuric digestion (Fes) (r = 0.92, p<0.01, n = 14), Fed (r = 0.80, p<0.01, n = 14), and FeH2SO4 (r = 0.72, p<0.01, n = 14) correlated with the Mh contents, which does not occur when these materials correlate with the ratios
FeH2SO4/Fes and FeH2SO4/Fed. These observations confirm the association of Mh with the
Fe content in the parent material (Costa et al., 1999; Silva et al., 2010; Carvalho Filho et al., 2015) and show the low efficiency of the method of selective dissolution with 1.8 mol L-1 H
2SO4 to quantify Fe from Mh. Costa et al. (1999) made changes to the original method of Schwertmann and Fechter (1984) by suggesting 2 h of extraction in an acidic solution rather than 7.5 h for different soil classes and parent materials. Inda et al. (2013) used 45 min for Argissols. This shows the high empiricism of the method and emphasizes the need to conduct further studies to establish appropriate protocols for Fe-rich Oxisols.
The Fe contents extracted by ammonium oxalate (Feo), usually lower than 20 g kg-1 (Table 2), resulted in a low Feo/Fed ratio, indicating the dominance of crystalline forms of Fe oxides, characteristic of more developed Oxisols. With the exception of tuffite-originated soils (LV6, LV7, LV8, LV9, and LV10), values <0.06 for the Feo/Fed ratio were observed. Kämpf et al. (1988) established the lower limit of 0.03 for the order of Oxisols in different regions of Brazil. The highest ratio values were established for most tuffite soils, especially in LV9 (0.13), which reflects the lower degree of evolution of these soils compared to the others with shorter oxide crystallization time. The main implications of low crystallinity minerals in soils are related to relevant participation in their chemical properties, especially with regard to sorption reactions (Fontes and Weed, 1996).
The Fed/Fes ratio, which indicates the participation of Fe forms linked to pedogenic Fe oxides in relation to total Fe sulfuric digestion (Fes) (Rolim Neto et al., 2009), was low, except for LV11. In Oxisols, the ratio should be between 0.8 and 1.0 (Kämpf et al., 1988). Resende et al. (2011) attribute this result to the high Fes values arising from the breakdown of other forms of more crystalline Fe in the coarse fractions (sand and silt from ADFE). However, in Oxisols, the lowest Fed/Fes ratios were always associated with yellowish soils, due to preferential dissolution of Mh and Hm and greater resistance of Gt, which was largely replaced by Al for reduction by CBD (Torrent et al., 1987; Fontes, 1988).
The values for isomorphic substitution of Fe by Al (ISd), calculated by the ratio of molar concentration Ald/(Ald+Fed), ranged from 0.139 to 0.322 mol mol
-1 (Table 2), consistent with results commonly found by other authors in studies on highly weathered soils from tropical and subtropical regions (Curi and Franzmeier, 1987; Fontes and Weed, 1991; Kämpf and Curi, 2000; Inda Junior and Kämpf, 2005; Correa et al., 2008; Corrêa et al., 2015) and also within the maximum limits established for the structures of Gt and Mh (0.33 mol mol-1) and Hm (0.15 mol mol-1) (Cornell and Schwertmann, 2003). The indirect relationship between slope of the curves of the cumulative Fed contents (Figure 3) and the ISd values confirm the stabilizing effect of Al on Gt structure (Torrent et al., 1987; Fontes, 1988; Inda Junior and Kämpf, 2005; Carvalho Filho et al., 2015) in LV6 and LVA1.
(Als) (r = -0.53, p<0.05, n = 14), indicate that the Al contents obtained by successive extractions with CBD are predominantly from the structure of Fe oxides, with negligible performance of other possible sources of this element, such as gibbsite and/or kaolinite (Inda Junior and Kämpf, 2003). This hypothesis is consistent with the absence of correlation between ISd and Als.
Conversely, higher contents of AlH2SO4, not correlated with those of FeH2SO4, suggest the contribution of Al sources, besides Mh, extracted after selective dissolution with 1.8 mol L-1 H
2SO4. In addition, the values for isomorphic substitution of Fe by Al (ISH2SO4) calculated by the ratio of molar concentration AlH2SO4/(AlH2SO4+FeH2SO4) were higher than those for the Mh structure (Cornell and Schwertmann, 2003) and correlated with the contents of Als (r = 0.90, p<0.01, n = 14), reinforcing the hypothesis of contribution of other Al sources (Costa et al., 1999).
Crystallographic characteristics of Fe oxides
The values of the Hm/(Hm+Gt) ratio between 0.55 and 1.00 indicate the higher rate of Hm in relation to Gt in all soils, explaining hues redder than 3.5 YR, with the exception of LVA1 (5 YR hue) (Table 3). The main factors that favor Hm formation in the soil, and therefore compete to increase this ratio, are greater Fe contents in the parent material, high temperatures, lower humidity, lower organic matter content, and higher pH values (Schwertmann and Taylor, 1989). In this study, excluding the LV11 sample, the value of the linear correlation coefficient between the Hm/(Hm+Gt) ratio and the Fed and Fes contents increased from 0.24 (ns, n = 14) to 0.88 (p<0.01, n = 13) and from 0.44 (ns, n = 14) to 0.80 (p<0.01, n = 13), respectively. This fact, in addition to indicating that the Fe content in the parent material was essential in the formation of Fe oxides (Melo et al., 2001; Carvalho Filho et al., 2015), suggests that LV11 (Fes = 570.4 g kg
-1),
originating from itabirite, shows significant amounts of Gt obtained from the parent material (Curi and Franzmeier, 1987).
The d-spacing (d) for Fe oxides (Hm, Gt, and Mh) in various directions (hkl) was corrected using Si as an internal standard (Table 3). The values were homogeneous overall; however, formed on the same parent material. The d110 and d111 reflexes of Gt were measured in all soils except for LV9 (Figure 2).
The values of MCSGt, perpendicular to planes d110 and d111, showed relative agreement with the values observed by other authors for Brazilian soils (Schwertmann and Kämpf, 1985; Curi and Franzmeier, 1987; Fontes and Weed, 1991; Melo et al., 2001; Carvalho Filho et al., 2015). The results for the MCSGt110/MCSGt111 ratio ranged from 0.95 to 2.63 (Table 3) and showed differences among the crystal morphologies in this mineral. Although some samples showed values of this ratio close to one, in others, the values are far higher (over 1.4), contrary to the common trend of equidimensionality of Gt along the three crystallographic axes (xyz) (Schwertmann, 1988). According to Schwertmann (1988), acicular crystals, in which MCSGt110 is greater than MCSGt111, are observed in Gt, displaying preferred growth along the z direction. However, the occurrence of both isodimensional and acicular Gt is common in Brazilian soils (Schwertmann and Kämpf, 1985; Fontes and Weed, 1991; Melo et al., 2001; Cornell and Schwertmann, 2003).
There is a great range of estimated values for SSAGt (32.2 to 157.2 m
2 g-1), as well as for ISGt (0.150 to 0.296 mol mol
The great variation in SSAGt values in tuffite soils highlights the occurrence of Gt with different degrees of crystallinity between soils originating from the same parent material. In this case, besides the possibility of variation in pedoenvironmental conditions favorable to the occurrence of IS, tuffites are basic unhardened heterogeneous rocks, with various proportions of pyroclastic debris and, consequently, different elementary levels (Guimarães, 1955), which may also cause variations in mineral crystallinity. Another aspect is the clear difference of the soil under the influence of detrital materials in the South American plain (LV1), where SSAGt and ISGt values were well below those observed in the other basalt soils. There was no correlation between ISGt and the contents of Als, disagreeing with the general trend observed in Brazilian soils (Costa et al., 2014). The direct relationship between ISGt and Al activity in the soil indicates a pedogenetic environment with strong desilication, where Al would be more susceptible to be incorporated into the Gt structure (Schwertmann and Kämpf, 1985). However, generalizations should be avoided because the intensity of this phenomenon cannot be based solely on Al availability in the system. Gibbsite formation is competitive to IS in Gt, that is, environments with high Al contents may prioritize gibbsite formation and reduce IS in Fe oxides.
In general, higher values of MCSHm were observed compared to those obtained for Gt (Table 3), mainly in the d110 direction. This was also verified by other authors (Schwertmann and Kämpf 1985; Kämpf et al., 1988; Fontes and Weed, 1991; Melo et al., 2001, Carvalho Filho et al., 2015), indicating greater development of crystals in the x-y direction compared to the z direction. According to Fontes and Weed (1991) and Melo et al. (2001), this pattern of growth also suggests greater crystallinity of Hm compared to Gt.
Values of the MCSa/MCSc ratio (MCSa = MCS110 ×0.72; MCSc = MCS012 × 0.59) higher than the unit in all soils, except for LVA1, indicate predominance of placoid morphology for Hm. ISHm values ranged from 0.057 to 0.188 mol mol
-1 (Table 3). These results are lower than those observed for Gt, except in LVA1. This reinforces the hypothesis that when these two minerals occur simultaneously in soils, Hm tends to be smaller than IS (Schwertmann et al., 1979; Schwertmann and Kämpf, 1985; Singh and Gilkes, 1992). Singh and Gilkes (1992), based on the linear regression coefficient adjusted between ISGt and ISHm (line slope = 0.5), Table 3. d-spacing (d) corrected, mean crystal size (MCS), specific surface area (SSA), isomorphic substitution of Fe by Al (IS) in
goethite (Gt), hematite (Hm), and maghemite (Mh), and Hm/(Hm + Gt) ratio for the clay fraction
Soil d-spacing MCS MCS ratios
(2) Hm/ (Hm+Gt)
SSA IS
Gt110 Gt111 Hm012Hm104Hm110 Mh220 Mh400 Gt110 Gt111 Hm012Hm104Hm110 Mh220 Mh400 A B C Gt Hm Gt Hm Mh
nm m2
g-1
mol mol-1
LV1 0.416 0.243 0.369 0.271 0.251 0.295 0.208 26.57 14.86 24.33 13.93 30.83 38.91 47.93 1.79 1.55 0.81 0.85 89.0 43.9 0.175 0.057 0.033
LV2 0.416 0.242 0.372 0.269 0.251 0.294 0.208 17.03 13.82 33.54 20.04 39.74 45.41 36.04 1.23 1.45 1.26 0.85 141.7 36.4 0.296 0.154 0.125
LV3 0.414 0.242 0.366 0.269 0.251 0.294 0.208 15.22 16.00 33.55 20.04 39.73 27.46 24.29 0.95 1.45 1.13 0.89 159.1 36.5 0.270 0.130 0.194
LV4 0.413 0.242 0.367 0.270 0.251 0.294 0.208 15.23 13.23 29.89 20.03 34.82 54.49 47.94 1.15 1.42 1.14 0.83 159.0 42.3 0.253 0.106 0.163
LV5 0.413 0.242 0.367 0.269 0.251 0.294 0.207 19.36 11.29 24.58 20.04 34.82 30.44 32.14 1.71 1.73 0.95 0.83 124.0 34.8 0.171 0.125 0.175
LV6 0.414 0.243 0.367 0.269 0.250 n.d. n.d. 38.02 14.47 22.60 11.55 23.47 n.d. n.d. 2.63 1.27 n.d. 0.63 60.7 70.4 0.176 0.188 n.d.
LV7 0.415 0.242 0.367 0.270 0.251 0.294 0.208 20.78 17.89 38.27 20.04 34.83 23.01 36.05 1.16 1.11 0.64 0.84 115.2 54.1 0.207 0.147 0.129
LV8 0.416 0.243 0.367 0.269 0.251 0.294 0.208 66.47 46.55 22.60 18.75 46.30 30.44 24.29 1.43 2.50 1.25 0.97 32.6 18.1 0.150 0.126 0.174
LV9 n.d. n.d. 0.368 0.269 0.251 0.294 0.208 n.d. n.d. 17.15 11.55 18.94 21.31 18.43 n.d. 1.35 1.16 1.00 n.d. 82.0 n.d. 0.148 0.151
LV10 0.416 0.243 0.367 0.270 0.251 0.294 0.208 26.78 23.58 19.49 15.76 31.04 27.46 26.42 1.14 1.94 1.04 0.94 88.3 34.7 0.191 0.145 0.108
LV11 0.417 0.242 0.367 0.270 0.251 0.294 0.207 17.03 12.68 20.92 17.63 18.94 21.31 19.61 1.34 1.10 1.09 0.72 141.7 100.1 0.260 0.167 0.192
LV12 0.414 0.242 0.366 0.269 0.251 0.294 0.207 20.78 13.22 19.49 13.03 23.47 34.17 59.26 1.57 1.47 0.58 0.74 115.2 60.7 0.224 0.171 0.127
LV13 0.416 0.242 0.367 0.269 0.251 0.295 0.208 20.78 19.03 26.97 18.76 31.04 18.57 19.60 1.09 1.40 0.95 0.74 115.2 48.0 0.227 0.146 0.085
LVA1 0.414 0.242 0.368 0.269 0.251 n.d. n.d. 33.32 19.04 29.89 12.00 21.72 n.d. n.d. 1.75 0.89 n.d. 0.55 70.0 108.7 0.207 0.095 n.d.
(1) d-spacing corrected using silicon as an internal standard. Hm/(Hm + Gt), MCS, SSA and IS ratios were calculated from the X ray patterns of the concentrated Fe oxides; n.d. not detected; (2)
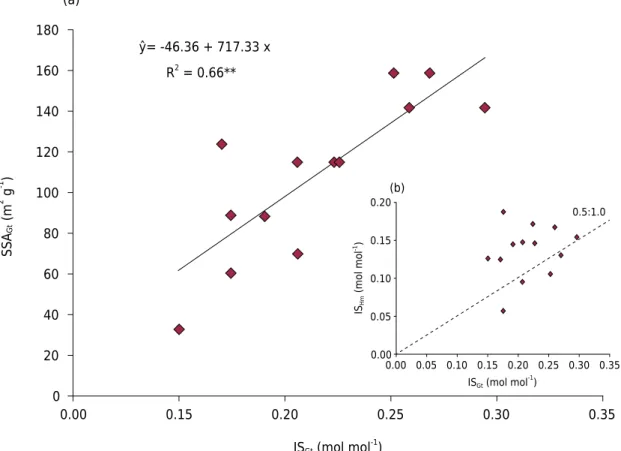
reported that Hm may accommodate approximately half of Al present in Gt in soils when these minerals coexist, which was also observed in this study (Figure 4b). However, the occurrence of ISHm values higher than half the values observed for Gt indicates that in soils with significant Hm contents, under favorable conditions, the occurrence of this phenomenon in Hm may be more effective.
In addition to the higher values of MCSHm, SSAHm values lower than those for Gt were observed, with few exceptions (LV6 and LVA1), in agreement with the results observed by Melo et al. (2001) and Carvalho Filho et al. (2015). The lack of correlation between ISHm and SSAHm, as well as between ISHm and MCSHm012, and MCSHm104 and MCSHm110, show high variability of the factors involved in Hm crystallinity in the Oxisols studied.
In general, the MCSMh values were higher than those found for Hm and Gt, which reflects better crystallinity of Mh in soils derived from mafic rocks where their genesis is more associated with oxidation of magnetite inherited from the parent material (Curi and Franzmeier, 1987; Fontes and Weed, 1991; Costa et al., 1999). With values close to one, the MCSMh220/MCSMh400 ratio indicates equal dimensions in the d220 and d400 directions of Mh. ISMh values ranged from 0.033 to 0.194 mol mol
-1, similar to the values found by other authors in tropical and subtropical soils (Schwertmann and Fechter, 1984; Fontes and Weed, 1991; Costa et al., 1999; Carvalho Filho et al., 2015) and generally lower than those estimated for Hm and Gt. Thus, it can be suggested that in well-drained soils from mafic rocks, IS in Mh would occur throughout pedogenesis from its direct transformation after oxidation of magnetite inherited from the parent material.
The IS values estimated by mathematical equations of Schulze (1984), Schwertmann et al. (1979), and Schwertmann and Fechter (1984) for Gt (ISGt), Hm (ISHm), and Mh (ISMh), respectively, were not consistent with those obtained through chemical dissolution by CBD (ISd). Correa et al. (2008) also did not observe correlation between the ISGt determined by
Figure 4. Relationship between specific surface area (SSA) and isomorphic substitution of Fe by Al (IS) values in Gt (a); and relationship between IS values in Hm and Gt (b). **
: significant at 1 %.
0.00 0
0.15 0.20 20
40 60 80 100 120 140 160 180
ŷ= -46.36 + 717.33 x
R2 = 0.66**
SSA
Gt
(m
2 g -1 )
ISGt (mol mol -1
) (a)
0.00 0.00
0.05 0.15 0.20 0.25 0.35 0.05
0.10 0.15 0.20
0.10 0.30
0.5:1.0
ISHm
(mol mo
l
-1)
ISGt (mol mol -1
) (b)
chemical methods and that estimated by mathematical equations in soils of the Barreiras Group and, therefore, highlighted the need for studies to demonstrate the relationships between the crystallographic parameters of Gt and their chemical properties.
CONCLUSIONS
The occurrence of Mh contents higher than those of Hm and Gt in some Rhodic Oxisols underscores the importance of this mineral for soils originating from mafic rocks and suggests the need to reflect on the use of magnetic properties as criteria for taxonomic classification.
The estimate of Fe from Mh obtained for selective dissolution with 1.8 mol H2SO4 may not correspond to actual existence in the soil. In addition, the contents of Al extracted may be heavily influenced by other minerals that are sources of Al.
ISGt was higher than ISHm in all Rhodic Oxisols. This phenomenon has a strong influence on SSAGt; however, for Hm, other factors seem to exert a greater effect on crystallinity. Hm crystals predominantly displayed a placoid shape in all Rhodic Oxisols and lower SSAHm in comparison to Gt crystals, which occurred both in the isodimensional and acicular forms.
The higher Mh crystallinity and ISMh values generally lower than those of Hm and Gt suggest that in well-drained soils originating from mafic rocks, the IS phenomenon in Mh seems to be a result of pedogenetic advances after its formation from magnetite oxidation.
REFERENCES
Ávila CF, Lagoeiro L, Barbosa PF, Graça L. EBSD analysis of rhombohedral twinning in hematite crystals of naturally deformed iron formations. J Appl Cryst. 2015;48:212-19. https://doi.org/10.1107/S1600576714025928
Barbosa PF, Lagoeiro L. Crystallographic texture of the magnetite-hematite transformation: Evidence for topotactic relationships in natural samples from Quadrilátero Ferrífero, Brazil. Am Miner. 2010;95:118-25. https://doi.org/10.2138/am.2010.3201
Carmo DN, Curi N, Resende M. Caracterização e gênese de Latossolos da Região do Alto Paranaíba (MG). Rev Bras Cienc Solo. 1984;8:235-40.
Carvalho Filho A, Inda AV, Fink JR, Curi N. Iron oxides in soils of different lithological
origins in Ferriferous Quadrilateral (Minas Gerais, Brazil). Appl Clay Sci. 2015;118:1-7. https://doi.org/10.1016/j.clay.2015.08.037
Cervi EC, Costa ACS, Souza Junior IG. Magnetic susceptibility and the spatial variability
of heavy metals in soils developed on basalt. J Appl Geophys. 2014;111:377-83. https://doi.org/10.1016/j.jappgeo.2014.10.024
Cornell RM, Schwertmann U. The Iron Oxides: structure, properties, reactions, occurrences and
uses. 2nd ed. Weinheim, Germany: Wiley-VHC Verlag GmbH and Co. KGaA; 2003.
Correa MM, Ker JC, Barrón V, Fontes MPF, Torrent J, Curi N. Caracterização de óxidos de ferro de solos do ambiente tabuleiros costeiros. Rev Bras Cienc Solo. 2008;32:1017-31. https://doi.org/10.1590/S0100-06832008000300011
Corrêa MM, Ker JC, Araújo Filho JC, Camêlo DL. Formas de ferro, silício e, ou, alumínio na gênese de fragipãs e horizontes coesos dos tabuleiros costeiros. Rev Bras Cienc Solo. 2015;39:940-9. https://doi.org/10.1590/01000683rbcs20140679
Costa ACS, Bigham JM, Rhoton FE, Traina SJ. Quantification and characterization of maghemite
in soils derived from volcanic rocks in southern Brazil. Clays Clay Miner. 1999;47:466-73.
Costa SAD, Ker JC, Simões DFF, Fontes MPF, Fabris JD, Andrade FV. Pedogênese e classificação
Curi N, Franzmeier DP. Effect of parent rocks on chemical and mineralogical
properties of some Oxisols in Brazil. Soil Sci Soc Am J. 1987;51:153-8. https://doi.org/10.2136/sssaj1987.03615995005100010033x
Curi N, Franzmeier DP. Toposequence of Oxisols from the Central Plateau of Brazil. Soil Sci Soc Am J. 1984;48:341-6. https://doi.org/10.2136/sssaj1984.03615995004800020024x
Dearing J. Environmental magnetic susceptibility: Using the Bartington MS2 System. 2nd ed. Keniloworth: Chi Publishing; 1999.
Donagema GK, Campos DVB, Calderano SB, Teixeira WG, Viana JHM, organizadores. Manual de métodos de análise do solo. 2a ed. rev. Rio de Janeiro: Embrapa Solos; 2011.
Fabris JD, Coey JMD, Jesus Filho MF, Santana DP, Goulart AT, Fontes MF, Curi N. Mineralogical
analysis of a weathering mantle derived from tuffite. Hyperfine Interact. 1994;91:751-7.
https://doi.org/10.1007/BF02064602
Fabris JD, Jesus Filho MF, Coey JMD, Mussel WN, Goulart AT. Iron-rich spinels from Brazilian soils. Hyperfine Interact. 1997a;110:23-32. https://doi.org/10.1023/A:1012619331408
Fabris JD, Mussel WN, Coey JMD, Jesus Filho MF, Goulart AT. Mg-rich iron oxide spinels from
tuffite. Hyperfine Interact. 1997b;10:33-40. https://doi.org/10.1023/A:1012611029591
Ferreira SAD, Santana DP, Fabris JD, Curi N, Nunes Filho E, Coey JMD. Relações entre magnetização, elementos traços e litologia de duas sequências de solos do Estado de Minas Gerais. Rev Bras Cienc Solo. 1994;18:167-174.
Fontes MPF. Iron oxide mineralogy in some Brazilian Oxisols [Thesis]. Raleigh: North Carolina
State University; 1988.
Fontes MPF, Carvalho Jr. IA. Color attributes and mineralogical characteristics, evaluated
by radiometry, of highly weathered tropical soils. Soil Sci Soc Am J. 2005;69:1162-72. https://doi.org/10.2136/sssaj2003.0312
Fontes MPF, Oliveira TS, Costa LM, Campos AAG. Magnetic separation and evaluation of
magnetization of Brazilian soils from different parent materials. Geoderma. 2000;96:81-99.
https://doi.org/10.1016/S0016-7061(00)00005-7
Fontes MPF, Weed SB. Iron oxides in selected Brazilian Oxisols: I. Mineralogy. Soil Sci Soc Am J.
1991;55:1143-9. https://doi.org/10.2136/sssaj1991.03615995005500040040x
Fontes MPF, Weed SB. Phosphate adsorption by clays from Brazilian Oxisols:
relationships with specific surface area and mineralogy. Geoderma. 1996;72:37-51.
https://doi.org/10.1016/0016-7061(96)00010-9
Guimarães D. Contribuição ao estudo dos tufos vulcânicos da Mata da Corda. Belo Horizonte:
Instituto de Tecnologia Industrial; 1955. (Boletim, 18).
Gualberto V, Resende M, Curi N. Química e mineralogia de Latossolos, com altos teores de ferro, da Amazônia e do Planalto Central. Rev Bras Cienc Solo. 1987;11:245-52.
Inda AV, Torrent J, Barrón V, Bayer C, Fink JR. Iron oxides dynamics in a subtropical
Brazilian Paleudult under long-term no-tillage management. Sci Agric. 2013;70:48-54. https://doi.org/10.1590/S0103-90162013000100008
Inda Junior AV, Kämpf N. Avaliação de procedimentos de extração dos óxidos de ferro
pedogênicos com ditionito-citrato-bicarbonato de sódio. Rev Bras Cienc Solo. 2003;27:1139-47. https://doi.org/10.1590/S0100-06832003000600018
Inda Junior AV, Kämpf N. Variabilidade de goethita e hematita via dissolução redutiva
em solos de região tropical e subtropical. Rev Bras Cienc Solo. 2005;29:851-66. https://doi.org/10.1590/S0100-06832005000600003
International Union of Soil Sciences/Working Group Word Reference Base – IUSS/WRB. World Reference Base for Soil Resources 2014, update 2015 International soil classification system for naming soils and
creating legends for soil maps. Rome: FAO; 2015. (World Soil Resources Reports, 106).
Jackson ML. Soil Clay mineralogical analysis. In: Rich CI, Kunze GW, editors. Soil clay mineralogy.
Jackson ML. Soil chemical analysis - advanced course: A manual of methods useful for instruction and research in soil chemistry, physical chemistry of soils, soil fertility, and soil
genesis. 2nd ed. Madison, WI: USA Dept. Soil Sci. Univ. of Wisconsin; 1979.
Kämpf N, Curi N. Óxidos de ferro: Indicadores de ambientes pedogênicos e geoquímicos.
Tópicos Cienc Solo. 2000;1:107-38.
Kämpf N, Resende M, Curi N. Iron oxides in Brazilian Oxisols. In: 8th International Soil
Classification Workshop: Classification, Characterization and Utilization of Oxisols; 1988; Rio de
Janeiro. Rio de Janeiro: Embrapa-SNLCS/SMSS/USDA-SCS/UPR; 1988. p.71-7.
Kämpf N, Schwertmann U. The 5-M-NaOH concentration treatment for iron oxides in soils. Clays Clay Miner. 1982;30:401-8.
King LC. A Geomorfologia do Brasil Oriental. Rev Bras. Geogr. 1956;18:147-263.
Klug HP, Alexander LE. X-ray diffraction procedures for polycrystalline and amorphous
materials. New York: John Wiley and Sons; 1954.
Maxbauer DP, Feinberg JM, Fox DL. Magnetic mineral assemblages in soils and paleosols as the basis for paleoprecipitation proxies: A review of magnetic methods and challenges. Earth Sci Rev. 2016;155:28-48. https://doi.org/10.1016/j.earscirev.2016.01.014
Mckeague JA, Day JH. Dithionite and oxalate-extractable Fe and Al as aids in differentiating
various classes of soils. Can J Soil Sci. 1966;46:13-22.
Mehra JP, Jackson ML. Iron oxides removal from soils and clays by a dithionite-citrate-bicarbonate system buffered with bicarbonate sodium. Clays Clay Miner. 1960;7:317-27.
Melo VF, Fontes MPF, Novais RF, Singh B, Schaefer CEGR. Características dos óxidos de ferro e de alumínio de diferentes classes de solos. Rev Bras Cienc Solo. 2001;25:19-32. https://doi.org/10.1590/S0100-06832001000100003
Moura Filho G, Resende M, Cruz CD. ALOCA – Programa de estimativa de minerais
do solo. Versão 1.0. In: 25° Congresso Brasileiro de Ciência do Solo; 1995; Viçosa.
Viçosa: SBCS; 1995. (Software)
Norrish K, Taylor RM. The isomorphous replacement of iron by aluminium in soil goethites. J. Soil Sci. 1961;12:294-306. https://doi.org/10.1111/j.1365-2389.1961.tb00919.x
Resende M. Mineralogy, chemistry, morphology and geomorphology of some soils of the Central Plateau of Brazil [Thesis]. West Lafayette: Purdue University; 1976.
Resende M, Bahia Filho AFC, Braga JM. Mineralogia da argila de Latossolos estimada por alocação a partir do teor total de óxidos do ataque sulfúrico. Rev Bras Cienc Solo. 1987;11:17-23.
Resende M, Curi N, Ker JC, Rezende SB. Mineralogia de solos brasileiros: interpretação e aplicações. 2a ed. Lavras: Universidade Federal de Lavras; 2011.
Rolim Neto FC, Schaefer CEGR, Fernandes Filho EI, Corrêa MM, Costa LM, Parahyba
RBV, Guerra SMS, Heck R. Topolitossequências de solos de Alto Paranaíba: atributos físicos, químicos e mineralógicos. Rev Bras Cienc Solo. 2009;33:1795-809.
https://doi.org/10.1590/S0100-06832009000600028
Santos HG, Jacomine PKT, Anjos LHC, Oliveira VA, Oliveira JB, Coelho MR, Lumbreras JF, Cunha
TJF. Sistema brasileiro de classificação de solos. 3a ed. Rio de Janeiro: Embrapa Solos; 2013. Schulze DG. The influence of aluminium on iron oxides. VIII. Unit-cell dimensions of
Al-substituted goethites and estimation of Al from them. Clays Clay Miner. 1984;32:36-44.
Schulze DG, Schwertmann U. The influence of aluminium on iron oxides. X. Properties of
Al-substituted goethites. Clay Miner. 1984;19:521-39.
Schwertmann U. Some properties of soil and synthetic iron oxides. In: Stucki JW, Goodman BA, Schwertmann U, editors. Iron in soils and clay minerals. Dordrecht: D. Reidel Publishing
Company; 1988. p.203-50.
Schwertmann U, Fechter H. The influence of aluminium on iron oxides: XI. Aluminium
Schwertmann U, Fitzpatrick RW, Taylor RM, Lewis DG. The influence of aluminium on iron oxides. Part II. Preparation and properties of Al-substituted hematites. Clays Clay Miner. 1979;27:105-12.
Schwertmann U, Kämpf N. Properties of goethite and hematite in kaolinitic soils of Southern and Central Brazil. Soil Sci. 1985;139:344-50.
Schwertmann U, Taylor RM. Iron oxides. In: Dixon JB, Weed SB, editors. Minerals in soil
environments. Madison: Soil Science Society of America; 1989. p.379- 438.
Silva AR, Souza Junior IG, Costa ACS. Suscetibilidade magnética do horizonte
B de solos do Estado do Paraná. Rev Bras Cienc Solo. 2010;34:329-37. https://doi.org/10.1590/S0100-06832010000200006
Silva FD, Couceiro PRC, Fabris JD, Goulart AT, Ker JC. Magnesioferrita e caminho
pedogenético de transformação de óxidos de ferro magnéticos em dois perfis de solo derivados de tufito da região do Alto Paranaíba (MG). Rev Bras Cienc Solo. 2005;29:763-75.
https://doi.org/10.1590/S0100-06832005000500012
Singh B, Gilkes RJ. Properties and distribution of iron oxides and their association with minor elements in the soils of south-western Australia. J Soil Sci. 1992;43:77-98. https://doi.org/10.1111/j.1365-2389.1992.tb00121.x
Soil Survey Staff. Keys to soil taxonomy. 12th ed. Washington, DC: United States Department of
Agriculture, Natural Resources Conservation Service; 2014.
Taylor RM, Mckenzie RM, Fordham AW, Gillman GP. Oxide minerals. In: Soils: an Australian viewpoint. London: Division of Soils, CSIRO, Melbourne Academic Press; 1983. p. 309-34.