Metabolizable energy in energy food for growing pigs and
cross-validation regression models
1Energia metabolizável de alimentos energéticos para suínos em crescimento e
validação cruzada de modelos de regressão
Newton Tavares Escocard de Oliveira2*, Paulo Cesar Pozza3, Leandro Dalcin Castilha3, Tiago Junior Pasquetti4
and Carolina Natali Langer2
ABSTRACT - The present study aimed to determine the apparent metabolizable energy (AME) of six corn cultivars, two sorghum cultivars and two wheat brans and to evaluate the cross-validation of predictive models of AME for corn, sorghum and wheat bran for growing pigs, as estimated from the data of chemical composition. Forty-four pigs, with an average initial weight of 24.3 kg, were distributed in a randomized block design, with 11 treatments (ten food treatments and the reference diet), four replicates and one pig per experimental unit. The reference diet was replaced by 30% for the ground corn and sorghum conditions and 20% for the wheat bran condition. The values of AME for corn, sorghum and wheat meal for pigs ranged from 3161 to 3275, 3317 to 3457 and 2767 to 2842 kcal kg-1 as a feed basis, respectively. The average metabolizability
of the gross energy did not differ between the corn and sorghum cultivars, which formed a homogeneous group of food. Next, linear regression models were fitted to the 1st degree of the observed values as a function of the predicted AME, to test
the hypothesis β0= 0 and β1= 1 in an experimental sample and 200 bootstrap samples. Fourteen predictive models had low percentages of cross-validation, ranging from 0-29.5%. The AME1A= 2.547 + 0.969ADE model was validated in experimental sample and 68% of bootstrap samples, proving its accuracy in estimating the AME of corn and sorghum from national data for growing pigs.
Key words:Bootstrap. Chemical composition. Metabolizability coefficient. Total excreta collection.
RESUMO - O presente estudo teve por objetivo determinar a energia metabolizável aparente (EMA) de seis cultivares de milho, dois cultivares de sorgo e dois farelos de trigo e avaliar a validação cruzada de modelos de predição da EMA do milho, sorgo e farelo de trigo para suínos em crescimento, estimados com base na composição química. Quarenta e quatro suínos, com peso médio inicial de 24,3 kg, foram utilizados em delineamento experimental de blocos ao acaso, com 11 tratamentos (dez alimentos e a ração referência), quatro repetições e um suíno por unidade experimental. A ração referência foi substituída, na base da matéria natural, em 30% para os milhos e sorgos, e em 20% para os farelos de trigo. Os valores de EMA dos milhos, sorgos e farelos de trigo para suínos variaram de 3161 a 3275, 3317 a 3457 e 2767 a 2842 kcal kg-1 de matéria natural,
respectivamente. A metabolizabilidade média da energia bruta não diferiu entre milhos e sorgos, que formaram um grupo homogêneo de alimentos. Em seguida, ajustaram-se modelos de regressão linear de 1º grau dos valores observados em função dos preditos de EMA, para teste da hipótese β0= 0 e β1= 1 em amostra experimental e em 200 amostrasbootstrap. Quatorze
modelos de predição apresentaram baixos percentuais de validação cruzada (0 a 29,5%). O modelo EMA1A= 2,547 + 0,969EDA foi validado em amostra experimental e em 68% das amostrasbootstrap, sendo acurado para estimar a EMA de milhos e sorgos
nacionais para suínos em crescimento.
Palavras-chave:Bootstrap. Coeficiente de metabolizabilidade. Coleta total de excretas. Composição química.
DOI: 10.5935/1806-6690.20180017 *Autor para correspondência
Recebido para publicação em 02/09/2016; aprovado em 24/03/2017
1Parte da Dissertação de Mestrado em Zootecnia do último autor, apresentada na Universidade Estadual do Oeste do Paraná/UNIOESTE
2Curso de Zootecnia, Centro de Ciências Agrárias, Universidade Estadual do Oeste do Paraná/UNIOESTE, Rua Pernambuco, 1777, Marechal Cândido
Rondon-PR, Brasil, 85.960-000, [email protected], [email protected]
3Departamento de Zootecnia, Universidade Estadual de Maringá/UEM, Av. Colombo, 5790, Jardim Universitário, Maringá-PR, Brasil, 87.020-900,
[email protected], [email protected]
4Curso de Zootecnia, Universidade Estadual do Mato Grosso do Sul/UEMS, Unidade de Aquidauana, Rodovia Graziela Maciel Barroso, Zona Rural,
INTRODUCTION
The precise quantification of energy that pigs can digest and metabolize from eating a food is essential for the formulation of balanced diets (SAKOMURA; ROSTAGNO, 2016) because protein, amino acid and other nutrient requirements are expressed in terms of energy levels of diets. Associated maladjustment may over- or underestimate nutrient intake and performance in
pigs (ROSTAGNOet al., 2011).
In many situations, the formulation of diets for pigs has been carried out based on food composition tables (ROSTAGNOet al., 2011). Thus, the update of the
chemical composition data of the food is indispensable for achieving greater precision in the formulation and performance of animals, because factors such as climate, genetics, among others, altering the nutritional quality of food and can modify the use of nutrients by pigs, as reported by National Research Council - NRC (2012).
Average values of apparent metabolizable energy (AME) in energy feed for pigs vary widely in the published literature. On a dry-matter basis, AME levels found for corn were 3765, reported by Empresa Brasileira de Pesquisa Agropecuária - Embrapa (1991),
and 3818 kcal kg-1(ROSTAGNO et al., 2011). For the
low-tannin sorghum, the authors mentioned 4220 and
3771 kcal kg-1, respectively. For wheat bran, average
observed was 2801 (EMBRAPA, 1991) and 2704 kcal
kg-1(ROSTAGNOet al., 2011).
Otherwise, the use of equations for predicting AME energy feed for pigs based on proximal composition of foods has been studied because of the difficulty that the pig industry has to adopt conventional methods to determine the AME food, which require experiments on live animals, and require infrastructure, time and financial resources (POZZAet al., 2010).
The prediction of AME energy feed for pigs using models that have chemical composition of predictors has the advantages of speed and low cost (PELIZZERI
et al., 2013), in addition to considering the lot of food
characteristics to prepare the diet.
Although many researchers have estimated prediction models for the AME of food for pigs based
on food composition (FERREIRAet al., 1997; LEKULE
et al., 1990; NOBLET; PEREZ, 1993), in recent
studies reporting on assessment validation equations
for independent-sample data (CASTILHA et al., 2011;
PELIZZERI et al., 2013), the validation tests have been
applied only once, which does not allow for a consistent evaluation of a given model’s predictive ability.
The bootstrap method can simulate real situations and be used repeatedly in various samples, to test the
power of validation and reliability of equations in independent sets of data. This method consists of a set of resampling procedures from the original database, to obtain a significant amount of estimates of linear
regression of 1st degree parameters, allowing the
hypothesis test application in each sample bootstrap
(COELHO-BARROSet al., 2008).
In the evaluation of the validity of regression models, the use of the bootstrap method is advantageous because from the original database, it is possible to increase the number of samples and tests to evaluate the joint null hypothesis β0 = 0 and β1 = 1 upon linear regression parameters (MONTGOMERY; PECK; VINING, 2006).
In this context, this research was conducted in order to determine the AME of six corn cultivars, two sorghum cultivars and two wheat brans for growing pigs and evaluates the cross-validation of the 15 predictive models of EMA in experimental sample and 200 bootstrap samples.
MATERIAL AND METHODS
The metabolism assay was conducted in the pig metabolism room of the Experimental Farm at the State University of Parana West, UNIOESTE.
Forty-four pigs, crossbred barrows with an average initial weight of 24.3 (1.12) kg, were distributed into completely randomized blocks design, with 11 treatments and 10 foods (six corn cultivars, two sorghum cultivars and two wheat bran) and the reference diet, four replicates and a pig for experimental unit (metabolism cage). The blocks were made during four periods.
The cultivars of corn and sorghum replaced by 30% basal diet, while the wheat brans replaced 20% (SAKOMURA; ROSTAGNO, 2016). The basal diet (Table 1), based on corn and soybean meal, was formulated considering the chemical composition of the ingredients and the nutritional requirements of high genetic potential swine, with average performance in the initial phase (15 to 30 kg body weight) presented by Rostagnoet al. (2011),
except for the crude protein level.
The trial period lasted 12 days, seven days for the animals to adapt to metabolism cages and feed, and five days of total collection of faeces and urine.
The amount of feed supplied daily to each animal was based on metabolic weight (kg0.75). To avoid losses of
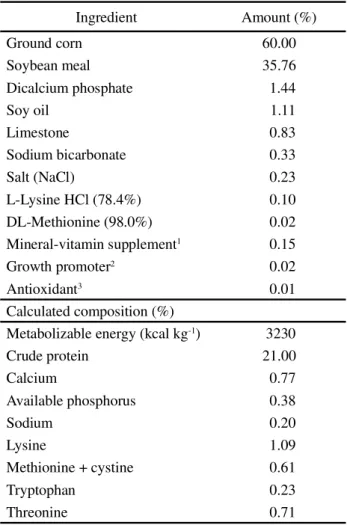
Table 1 - Centesimal and calculated composition of the reference diet as a feed basis
1Guaranteed level per kg of product: vit. A = 10,000,000 IU; vit. D 3=
2,000,000 IU; vit. E = 60,000 IU; vit. B1= 1g; vit. B2= 5g; vit. B6= 2g; vit. B12= 30,000 mcg; nicotinic acid = 30,000 mcg; pantothenic acid = 15,000 mcg; vit. K3= 1,000 mg; folic acid = 1,500 mg; biotin = 250 mg; selenium = 350 mg; iron = 100 g; copper = 10 g; cobalto = 1 g; manganese = 50 g; zinc = 100 g; iodine = 1 g and carrier q.s. for 1000 g;
2Tylosinphosphate 25%;3Butylatedhydroxytoluene
The samples of faeces and urine were held twice a day, at 7:30 and 18:30. The beginning and end of the faeces collection period were determined by the appearance of labelled faeces from the use of ferric oxide (Fe2O3) in diets.
Faeces were individually identified, weighed, wrapped in plastic bags and stored in a freezer at -18 °C, until the end of the collection period. At the end of this period, the samples were thawed, homogenized and withdrawn individual samples equivalent to 20% of each plastic bag. Next, the individual samples were collected for treatment, dried in a forced air oven (55 °C/72 h), ground and stored for further analysis of dry matter and gross energy.
The urines were filtered as excreted and individually collected in plastic buckets with 20 ml of HCl 1:1. Then, the volumes were measured with the aid of measuring cylinder and in each collection, 10% of the total were removed and transferred to glass jars identified by animal, that were stored in the refrigerator (3 °C) for further analysis of gross energy.
The ten food and the reference diet were submitted to analysis of dry matter (DM), gross energy (GE), crude protein (CP), ether extract (EE), crude fibre (CF), neutral detergent fibre (NDF), acid detergent fibre (ADF), ash, calcium and phosphorus as described by Silva and Queiroz (2005). The diets and faeces samples were analysed for DM and nitrogen content (SILVA; QUEIROZ, 2005). The GE values of the ten food, reference diet, faeces and urine were quantified using an adiabatic calorimeter (Parr® -6200).
For each food were evaluated digestibility coefficient of GE (DCGE), apparent digestible energy (ADE), metabolizability coefficient of GE (MCGE), apparent metabolizable energy (AME) and the AME:ADE ratio (SAKOMURA; ROSTAGNO, 2016). The effects of food on the DCGE and MCGE were checked by analysis of variance and average values of foods were grouped by the Scott-Knott test.
In the evaluation phase of model validation, chemical and energetic composition values for corn, sorghum and wheat bran, as obtained in the laboratory, and ADE measurements obtained experimentally were replaced in 15 regression models estimated from the chemical and energetic composition of these foods, as reported in the national and international scientific literature, via meta-analysis, to obtain the predicted values of apparent metabolizable energy (PAME). The observed values of apparent metabolizable energy (OAME) were obtained in the experiment, based on dry matter.
The models AME1A= 2.547 + 0.969ADE and
AME1B= 39.33 + 0.969ADE were obtained jointly to
estimate the AME of corn and sorghum, but national and
international origin, respectively. The models AME1C
= 2.547 + 0.969ADE - 4.217CP and AME1D= 39.33 +
0.969ADE - 4.217CP have been proposed to estimate the AME wheat brans national and international source, respectively. These models were adjusted considering the additive effects of intercept, ADE, GE, CF, EE, CP, ash,
source dummy (SD), food dummy 1 (FD1), food dummy
2 (FD2) and the effects of interactions between dummies with regressive chemical and energy composition (LANGER, 2013).
National data yielded the AME2A= 2306.26 +
0.39GE - 123.95CF + 33.05EE model. International data
Ingredient Amount (%)
Ground corn 60.00
Soybean meal 35.76
Dicalcium phosphate 1.44
Soy oil 1.11
Limestone 0.83
Sodium bicarbonate 0.33
Salt (NaCl) 0.23
L-Lysine HCl (78.4%) 0.10
DL-Methionine (98.0%) 0.02
Mineral-vitamin supplement1 0.15
Growth promoter2 0.02
Antioxidant3 0.01
Calculated composition (%)
Metabolizable energy (kcal kg-1) 3230
Crude protein 21.00
Calcium 0.77
Available phosphorus 0.38
Sodium 0.20
Lysine 1.09
Methionine + cystine 0.61
Tryptophan 0.23
yielded the AME2B= 2306.26 + 0.39GE - 123.95CF + 33.05EE - 49.63ash model. These models were used jointly to estimate the AME of corn, sorghum and wheat brans. The models were fitted without the use of regressive ADE,
ADE*SD, ADE*FD1 and ADE*FD2 (LANGER, 2013).
The AME of corn and sorghum from national and
international sources was estimated using the AME3A=
3675.39 + 50.02EE and AME3B= 3675.39 + 50.02EE
- 25.62CF models, respectively. For national source
wheat bran, the proposed model was AME3C= 3675.39
+ 50.02EE - 91.23CF. The international origin wheat
bran had the AME estimated from the model EMA3D
= 3675.39 + 50.02EE - 116.85CF. These models were fitted without inclusion as regressive, of ADE, GE and interactions of ADE and GE with the auxiliary variables (LANGER, 2013).
The models AME4A= 3824.44 - 105.29ash +
45.01EE and AME4B= 3824.44 105.29ash + 45.01EE
-37.26CP have been proposed to estimate the AME of corn and sorghum (AME4A) and wheat brans (AME4B) for both pooled sources. These models were fitted without initial inclusion of ADE, GE, CF and their interactions with the indicator variables (LANGER, 2013).
The models AME5A= 3982.99 - 79.97ash (corn),
AME5B= 3982.99 - 123.39ash (sorghum) and AME5C=
3982.99 - 79.97ash - 44.78CP (wheat bran) have been proposed to estimate AME these foods, from both sources.
The AME5 models corresponded to the complete model
(AME1) without the regressive ADE, GE, CF, EE and their interactions with dummies (LANGER, 2013).
Before fitting linear regression models 1st degree
(yi= b0+ b1xi+ εi) of OAME values as a function of PAME values, using the method of ordinary least squares, we proceeded to the analysis of standardized residual Student (RStudent) to diagnose influential observations or outliers that could interfere with the estimates of the regression parameters β0 and β1. Based on the normal distribution curve, RStudent values larger than two standard deviations, in absolute value, were considered influential and removed from its database.
The significance of the β1 parameter estimates
was checked using the partial “t” test to test the null hypothesis β1= 0. Validation of the 1st-degree models and,
therefore, the regression models was observed when the joint hypothesis β0= 0 and β1= 1 for linear regression
parameters was accepted, while applying the “F” test (MONTGOMERY; PECK; VINING, 2006).
Then, pairs of observed and predicted values of AME were replicated using the resampling method nonparametric bootstrap, generating 200 bootstrap samples of the same size as the original database,
with replacement, by selecting the values randomly
(COELHO-BARROSet al., 2008).
To check the percentage of validation of the models in 200 bootstrap samples (PVB), in each bootstrap sample were fitted linear regression models 1st degree of OAME
values as a function of PAME values and applying the “F” test (MONTGOMERY; PECK; VINING, 2006), to test the joint null hypothesis β0= 0 and β1= 1. From the significance probability (p) values of 200 “F” validation tests, PVB was calculated by: PVB = (number of results probability (p) greater than 0.05/200) x 100.
The significance level of 0.05 was used for all statistical tests. The statistical analyses were performed using the R Core Team (2013).
RESULTS AND DISCUSSION
The dry matter of the food ranged from 87.43 to 89.83% (Table 2) and is in line with the recommendation of 10 to 14% moisture (ASSOCIAÇÃO NACIONAL DOS FABRICANTES DE RAÇÕES, 1985), to prevent fermentation and proliferation of fungi that affect the quality of the diet and grain.
The crude protein (CP) values of corn ranged from 7.00 to 8.82% (Table 2). In different hybrids of
corn, Rostagno et al. (2011) found 7.29 to 8.48%. The
protein levels of two sorghum cultivars were 10.28 and
10.41% (Table 2), greater than 8.98 (ROSTAGNOet al.,
2011) and 9.71% (EMBRAPA, 1991). However, Antunes
et al. (2008) found values of 12.71, 13.05 and 13.40%,
and Antunes et al. (2007) reported varying from 8.77
to 15.92% CP in grain of 33 sorghum genotypes with different endosperm textures as a feed basis. For wheat bran, the CP values were 17.55 and 17.42%, higher levels than 16.76% (EMBRAPA, 1991) and 13.01 and 13.81% (NUNESet al., 2008).
The fibre content of corn ranged from 1.82 to 2.74% (ADF), 7.84 to 9.40% (NDF) and 1.31 to 1.87% (CF) (Table 2). The ADF and NDF values were less than 2.80% (ADF) and 9.6% (NDF) (NRC, 2012) and 4.42 to 5.35% (ADF) and 12.39 to 16.70% (NDF) (CASTILHA
et al., 2011). The NDF of sorghum were 9.11 and 10.07%,
similar to 10.03% (ROSTAGNO et al., 2011). The ADF
sorghum ranged from 2.14 to 4.74% (CV = 53.44%) (Table 2). The variability of the ADF was also high (CV = 47.18%) in 74 samples of corn (PELIZZERIet al., 2013).
32.27 to 33.96% (Table 2), lower results to 13.64% (ADF)
and 40.1% (NDF) (ROSTAGNOet al., 2011) and 11.65%
(ADF) and 40.45% (NDF) (NUNESet al., 2008).
The ether extract content (EE) of corn ranged from 3.51 to 4.28% (Table 2) and were within the respective minimum and maximum values of EE (0.70 to 5.96 and 2.14 to 6.01%), expressed on dry matter (DM),
obtained in surveys containing 67 (PELIZZERI et al.,
2013) and 97 results of scientific articles (OLIVEIRA; WARPECHOWSKI, 2009). The EE of sorghum had a high variation (CV = 17.60%) and the value of 1.97% was
lower than 2.35 and 2.96% (ROSTAGNO et al., 2011)
and 2.63 to 2.79% on DM (ANTUNESet al., 2008). Both
wheat bran presented 3.00% of EE, value below 3.15%
(EMBRAPA, 1991), 3.5% (ROSTAGNOet al., 2011) and
3.78 and 3.97% (NUNESet al., 2008).
The ash levels of the corn ranged from 0.91 to 1.27% (Table 2) and were similar to the range from 1.20 to
1.33% (ROSTAGNOet al., 2011). Sorghum ash content
(0.95 and 1.06%) was lower than the values obtained
by Rostagnoet al. (2011) and Embrapa (1991). The ash
values of the wheat bran were very close (5.06 and 5.08%)
(Table 2) and were higher than 4.7% (ROSTAGNOet al.,
2011) and 4.57% (EMBRAPA, 1991).
The calcium (Ca) levels of corn ranged from 0.01 to 0.02% and phosphorus total (P) ranged from 0.18 to 0.52% (Table 2). The value of 0.52% was very discrepant in relation to others. The nutrients that showed higher coefficients of variation (CV) among the six corn cultivars were P (45.87%) and Ca (34.99%). These results partially corroborate those obtained by Pelizzeri et al.
(2013), which found greater instability for the Ca (CV = 62.5%) and acid detergent fibre content (CV = 47.18%),
in chemical composition data corn collected in scientific literature. The Ca content (0.11%) and P (1.09 and 1.12%) of wheat bran were higher than their respective levels of Ca and P of the corn and sorghum (Table 2).
The gross energy (GE) contents of corn ranged
from 3780 to 3931 kcal kg-1(Table 3), which are in
accordance with the GE values of corn with different nutritional profiles (3825 to 3929 kcal kg-1) obtained by
Oliveira et al. (2011), and the value of 3940 kcal kg-1
(ROSTAGNO et al., 2011). The variation between the
GE values for two sorghum cultivars was low (3946 and
3953 kcal kg-1) and the values found were higher than
3910 kcal kg-1(ROSTAGNOet al., 2011). GE values of
the wheat brans were 4040 and 3999 kcal kg-1(Table 3).
These values were similar to 4023 kcal kg-1 and greater
than 3914 kcal kg-1 of GE (ROSTAGNOet al., 2011).
The variability found between GE values of corn, sorghum and wheat brans was consistent with reports in the literature, and can be attributed to the observed variation in the chemical composition of food, because the GE of food is directly related to the amount of heat it can be released by each fraction of food (NRC, 2012). However, despite the lower content of EE (1.97 and 2.53%) compared to corn (from 3.51 to 4.28%), the GE values of sorghums were higher than those of corn (Table 3), with no plausible justification for this fact.
The ADE and AME values of the six corn types
ranged from 3259 to 3500 and 3161 to 3275 kcal kg-1,
respectively. For both sorghum cultivars, the values
obtained were 3509 and 3638 kcal kg-1 (ADE) and 3317
and 3457 kcal kg-1 (AME) (Table 3). The respective ADE
and AME values for sorghum were higher than 3277
(ADE) and 3193 kcal kg-1 (AME) (FERREIRA et al.,
Table 2 - Chemical composition (%) of food as a feed basis1
1DM - Dry matter; CP - Crude protein; CF - Crude fibre; ADF - Acid detergent fibre; NDF - Neutral detergent fibre; EE - Ether extract; Ca
- Calcium; P - Phosphorus
Food DM CP CF ADF NDF EE ash Ca P
Corn 1 89.31 7.99 1.87 2.40 9.40 4.00 1.15 0.01 0.22
Corn 2 88.79 8.17 1.84 2.32 9.05 3.70 1.10 0.02 0.21
Corn 3 87.43 7.24 1.31 1.82 7.84 4.28 1.08 0.01 0.52
Corn 4 89.00 7.00 1.66 2.72 8.91 3.82 0.91 0.01 0.18
Corn 5 88.99 8.82 1.56 2.16 8.83 3.51 1.01 0.01 0.22
Corn 6 87.76 7.12 1.50 2.74 8.30 3.55 1.27 0.01 0.31
Sorghum 1 89.36 10.28 1.83 2.14 9.11 1.97 1.06 0.03 0.17
Sorghum 2 89.83 10.41 1.95 4.74 10.07 2.53 0.95 0.02 0.15
Wheat bran 1 89.82 17.55 7.88 8.20 32.27 3.00 5.06 0.11 1.09
1997) but near 3646 (ADE) and 3456 kcal kg-1 (AME)
(EMBRAPA, 1991). The wheat brans had 3159 and 3169
kcal kg-1 (ADE) and 2767 and 2842 kcal kg-1 (AME)
(Table 3). These values were higher than 2623 (ADE)
and 2458 kcal kg-1 (AME) (EMBRAPA, 1991), and 2504
(ADE) and 2390 kcal kg-1 of AME (ROSTAGNOet al.,
2011).
The variation of the ADE and AME values between samples of the same food can be attributed to the influence of factors such as soil conditions, climate, genetics, among others, that affect the food chemical composition, the main determinant of ADE (NRC, 2012). The experimental coefficient of variation was 6.41% (ADE) and 7.50% (AME). Therefore, nutritionists should perform routine chemical analysis of the respective lots of food, aiming to formulate diets that meet more precision the nutritional requirements of animals, as these variabilities can compromise the precision in the formulations of diets for pigs, interfering with the performance, given the amplitude of the average values of AME between corn (114), sorghum (140) and wheat brans (75 kcal kg-1) (Table 3).
The ether extract (EE) and crude protein (CP) have a positive correlation with the apparent metabolizable energy (AME), i.e., the higher the lipid or CP content, the
greater the value of AME food (LEKULE et al., 1990).
The EE has a positive effect in AME due to the high heat produced in the oxidation (POZZAet al., 2010). However,
in CP are compounds that are not used by the animal and AME food depends on the quality and how much the animal can take advantage of the protein, because it can be catabolized, increasing nitrogen losses via urine and energy demand (NRC, 2012).
Sorghum had higher CP values in relation to corn, but their EE values remained below those obtained for corn (Table 2), indicating that the high correlation between
EE and AME, reported by Lekule et al. (1990), was not
sufficient to explain the higher numerical values of AME sorghum compared to corn. The difference between the highest value of AME of sorghum (3457) and the highest
value of AME of corn (3275) was 182 kcal kg-1. The
difference between the lowest energy value of sorghum and corn was 156 kcal kg-1(Table 3).
The ash, CF and NDF had negative correlation with AME (NOBLET; PEREZ, 1993). The ash acted as dilutive effect of GE and reduced organic matter content of the food (PELIZZERI et al., 2013). In this study, the
highest ADF value (4.74%) to one of sorghum may have contributed to reducing the value of AME (3317 kcal kg-1)
when compared to the value of 3457 kcal kg-1 the other
cultivar of sorghum. However, observing the AME values of all corn and sorghum (Table 3) and its fibrous and ash content (Table 2), it was not possible to establish reasons for the differences in AME values between these foods based the correlations exhibited by Noblet and Perez (1993), except for the fibrous content of second sorghum, the ash and fibre values did not differ markedly between the two foods.
The higher fibre content in wheat brans resulted in lower values of AME compared to corn and sorghum (Table 3). The presence of higher fibre content in food can reduce the energy use of dietary nutrients, due to the low degradation of indigestible carbohydrates in the large intestine, especially in the lower body weight pigs (NRC, 2012). The CF can reduce dietary fat and protein
Food GE DCGE1 ADE MCGE1 AME AME:ADE
Corn 1 3885 90.08 a 3500 84.29 a 3275 0.94
Corn 2 3911 85.80 a 3356 80.98 a 3167 0.95
Corn 3 3780 90.61 a 3425 84.93 a 3211 0.94
Corn 4 3878 88.77 a 3443 82.97 a 3218 0.94
Corn 5 3931 87.03 a 3421 83.00 a 3262 0.95
Corn 6 3810 85.55 a 3259 82.97 a 3161 0.97
Sorghum 1 3946 92.19 a 3638 87.61 a 3457 0.95
Sorghum 2 3953 88.78 a 3509 83.91 a 3317 0.94
Wheat bran 1 4040 78.43 b 3169 70.35 b 2842 0.90
Wheat bran 2 3999 78.98 b 3159 69.18 b 2767 0.88
Coefficient of variation (%) - 6.45 6.41 7.59 7.50 4.14
Table 3 - Gross energy (GE), apparent digestible energy (ADE) and apparent metabolizable energy (AME), expressed in kcal kg-1,
digestibility (DCGE) and metabolizability coefficients (MCGE) of the GE, expressed in %, and the AME:ADE ratio of corn, sorghum and wheat brans for growing pigs as a feed basis
digestion enhancing endogenous secretion. Additionally, the fermentation of the fibre produces volatile fatty acids, which is lower metabolic efficiency (NOBLET; PEREZ, 1993).
The AME:ADE ratio ranged from 0.94 to 0.97, for corn and sorghum, and 0.88 to 0.90 for wheat brans (Table 3). Except for the corn had the highest value (0.97), the other corn had lower AME:ADE ratio (0.94 and 0.95), less than 0.98 (FERREIRAet al., 1997) and 0.96 and 0.97
(CASTILHAet al., 2011). The smallest values of AME:
ADE ratio for wheat brans (Table 3) indicated that the energy losses in the urine were important, possibly resulting from increased catabolism of protein and increased energy demand (NRC, 2012), as wheat brans had higher protein content than corn and sorghum (Table 2).
There was no statistical difference (p>0.05) between the DCGE and MCGE of the corn and sorghum (Table 3), confirming the finding of no apparent justification, based on chemical compositions, for the differences between ADE and AME values between the two foods. These results showed that corn and sorghum cultivars formed a homogeneous group of food on the digestibility and metabolizability, suggesting the possibility of replacing corn with sorghum in pig diets.
In this study, the average values of DCGE and MCGE of corn ranged from 85.55 to 90.61% and from 80.98 to 84.93%, respectively (Table 3), and were similar to those described by Castilha et al. (2011), who found
DCGE between 87.42 and 89.37% and MCGE between 84.01 and 86.00%. The DCGE (92.19 and 88.78%) and the MCGE (87.61 and 83.91%) of sorghum were discrepant between both cultivars, but the AME:ADE ratio was next (0.95 and 0,94) and remained similar to that obtained for corn (Table 3).
For wheat brans, the average DCGE (78.43 and 78.98%) and MCGE (69.18 and 70.35%) were lower (p<0.05) to those obtained for corn and sorghum (Table 3), indicating the formation of a heterogeneous group of lower digestibility and metabolizability energy, due to the higher fibre content (Table 2), confirming the low digestibility of the fibre content in the gastrointestinal tract of pigs (NRC, 2012).
The single-validation test yielded acceptance (p > 0.05) of the joint null hypothesis β0= 0 and β1= 1, when fitting the AME1 model for national corn and sorghum data, and rejection (p<0.05), while the other models fit (Table 4).
The results indicated that the observed AME values (Y) were similar to the predicted AME values (Ŷ) using
Food/Source Regression model1 n p2 PVB
C, S/N AME1a = 2.547 + 0.969ADE 31 0.2510 68.00
C, S/I AME1b = 39.33 + 0.969ADE 31 0.0298 29.50
WB/N AME1c = 2.547 + 0.969ADE - 4.217CP 7 * 4.50
WB/I AME1d = 39.33 + 0.969ADE - 4.217CP 7 * 4.00
C, S, WB/N AME2a = 2306.26 + 0.39GE - 123.95CF + 33.05EE 29 6.75x10⁻⁶ 0
C, S, WB/I AME2b = 2306.26 + 0.39GE - 123.95CF + 33.05EE - 49.63ash 29 2.51x10⁻⁷ 0
C, S/N AME3a = 3675.39 + 50.02EE 23 * 0
C, S/I AME3b = 3675.39 + 50.02EE - 25.62CF 23 * 0
WB/N AME3c = 3675.39 + 50.02EE - 91.23CF 7 * 2.00
WB/I AME3d = 3675.39 + 50.02EE - 116.85CF 7 * 0
C, S/N, I AME4a = 3824.44 - 105.29ash + 45.01EE 24 * 0
WB/N, I AME4b = 3824.44 - 105.29ash + 45.01EE -37.26CP 7 * 0
C/N, I AME5a = 3982.99 - 79.97ash 16 4.54x10⁻⁵ 0
S/N, I AME5b = 3982.99 - 123.39ash 8 * 11.50
WB/N, I AME5c = 3982.99 - 79.97ash - 44.78CP 7 * 0
1ADE - Apparent digestible energy; CP - Crude protein; GE - Gross energy; CF - Crude fibre; EE - Ether extract; n = number of observations; 2*: There
was no linear relationship between observed AME and estimated AME (accepting of H0:b1= 0)
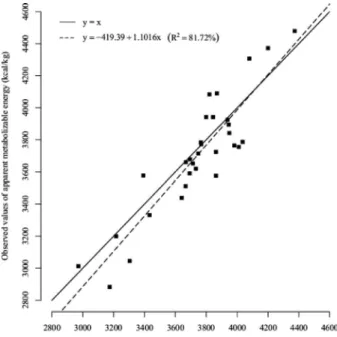
equation AME1a= 2.547 + 0.969ADE, i.e., the residual values (εi= Y - Ŷ) in the regression analysis were low. In the graphical analysis of the single validation AME1a test model (Figure 1), confirmed the similarity between observed and predicted values of AME, in which the straight linear model of 1st degree presented angle with
the horizontal axis of 47.77º. This value is close (p>0.05) to the ideal condition of straight angle (y = x), which is 45º, indicating that the AME1a model can be used as a tool to obtain AME values of corn and sorghum national for growing pigs.
Castilla et al. (2011) did not find a significant
Spearman correlation (p>0.05) between average observed values of AME for cultivars of corn and estimated values of AME obtained by the model (AME = 989.76 + 0.86ADE,
R2= 0.79); however, the authors found that the AME =
1.00ADE - 0.68CP (R2= 0.99) and AME = 0.997ADE
-0.68CP + 0.23EE (R2= 0.99) models, proposed by Noblet
and Perez (1993), who used ADE and CP as regressors, provided estimates of AME with significant correlation (p<0.05) with the observed AME values.
The single validation test for the hypothesis β0=
0 and β1= 1 associated with the model AME1b= 39.33 +
0.969ADE presented descriptive level value (p) equal to
0.0298 (Table 4), indicating that the observed values and estimated AME of the corn and sorghum international were close, but not enough, with the error (α = 0.05) used in this study.
The rejection of the joint hypothesis β0= 0 and
β1= 1 observed in single validation tests for EMA1c and
EMA1d models, adjusted with the ADE as regressor, and
AME2, AME3, AME4 and AME5 models, adjusted with
chemical and energy composition as regressor, can be explained by the lower observed AME values obtained in the experiment regarding AME values found in scientific articles. In addition, the estimates of the model parameters were based upon the chemical composition values and energy feeds available in the scientific literature, which were distinct from food composition values used in the assay, analysed in a laboratory, which values were used to obtain AME estimated by the models.
However, the models AME = 1.099 + 0.740GE - 5.5ash - 3.7ADF, AME = 16.13 -9.5NDF + 16EE + 23CP*NDF - 138ash*NDF and AME = 5.42 - 17.2NDF - 19.4ash + 0.709GE were valid for predicting corn AME for pigs, in a single validation test, using a sample of observed values of AME obtained in scientific literature
(PELIZZERI et al., 2013). The validation of prediction
models in independent data samples is critical for them to have applicability in the feed formulation industry (OLIVEIRA; WARPECHOWSKI, 2009).
The validation results by bootstrap simulation
revealed that the model AME1a= 2.547 + 0.969ADE,
related to national corn and sorghum cultivars, had the highest percentage validation (68%) in 200 bootstrap
samples (Table 4). The model AME1b= 39.33 + 0.969ADE,
referring to corn and sorghum international, presented the second largest validation index (29.5%), however, this percentage was not satisfactory, given that corresponded to only 59 validations in 200 tests. We found no references in the scientific literature validation tests, through bootstrap simulation, of AME prediction models of energy foods from different sources for pigs.
Models that have the ADE as regressor are not the most suitable for use in feed formulation in practical situations, because they require to carry out the experiment. However, the use of these reduces the need for hand labour in the collection and storage of urine, and allows reduction in time and cost of research.
Although it is recommended the use of models with independent variables of chemical composition, being easily applied in zootechnical practice, models that had the CP, CF, EE, ash and GE as regressive showed unsatisfactory percentage of cross-validation (0 to 11.5%), showing a low reliability for the prediction of AME.
Figure 1 - Graphical analysis of the single validation test of AME1A model for corn and sorghum national: Straight of the ideal condition (solid line) and model of 1st degree of the observed
The criteria to be adopted for a model to be classified as suitable for the validation of independent data is subjective, depending on the requirement of the researcher and the research objectives. In the conditions of work and considering the lack of information related to the use of bootstrap simulation in zootechnical area, 68% validation index (136 validations in 200 samples)
presented by the AME1a model for national corn and
sorghum cultivars can be considered satisfactory, with intermediate reliability.
Other studies on the use of bootstrap simulation in assessing the validation of AME prediction models for pigs should be performed, in order to provide more information related to the predictive ability of models.
CONCLUSIONS
The apparent metabolizable energy values of food energy for growing pigs on the basis of feed
ranged from 3161-3275 kcal kg-1 for corn cultivars,
3317-3457 kcal kg-1 for sorghum cultivars and
2767-2842 kcal kg-1 for wheat bran. The AME
1a= 2.547 +
0.969ADE model is valid for the estimation of AME of national corn and sorghum cultivars and can be used as a tool for formulating diets for pigs.
REFERENCES
ANTUNES, R. C. et al. Composição bromatológica e
parâmetros físicos de grãos de sorgo com diferentes texturas de endospermas. Arquivo Brasileiro de Medicina Veterinária e Zootecnia, v. 59, n. 5, p. 1351-1354, 2007.
ANTUNES, R. C. et al. Valor nutritivo de grãos de sorgo
com diferentes texturas do endosperma para leitões. Arquivo Brasileiro de Medicina Veterinária e Zootecnia, v. 60, n. 3, p. 713-718, 2008.
ASSOCIAÇÃO NACIONAL DOS FABRICANTES DE RAÇÕES. Matériasprimas para alimentação animal -padrão. 4. ed. 1985. 65 p.
CASTILHA, L. D.et al. Modelos matemáticos para predição
dos valores energéticos do milho para suínos. Revista Brasileira de Saúde e Produção Animal, v. 12, n. 2, p. 456-467, 2011.
COELHO-BARROS, E. A. et al. Métodos de estimação em regressão linear múltipla: aplicação a dados clínicos. Revista Colombiana de Estadística, v. 31, n. 1, p. 111-129, 2008.
EMPRESA BRASILEIRA DE PESQUISA AGROPECUÁRIA. Centro Nacional de Pesquisa de Suínos e Aves. Tabela de composição química e valores energéticos de alimentos para suínos e aves. 3. ed. Concórdia, 1991. 97 p.
FERREIRA, E. R. A.et al. Avaliação da composição química e determinação de valores energéticos e equação de predição de alguns alimentos para suínos.Revista Brasileira de Zootecnia, v. 26, n. 3, p. 514-523, 1997.
LANGER, C. N. Energia metabolizável de alimentos energéticos para suínos: predição via meta-análise, determinação e validação por simulação bootstrap. 2013. 99 f. Dissertação (Mestrado em Zootecnia) - Centro de Ciências Agrárias, Universidade Estadual do Oeste do Paraná, Marechal Cândido Rondon, 2013.
LEKULE, F. P.et al. Nutritive value of some tropical feedstuffs
for pigs. Chemical composition, digestibility and metabolizable energy content.Animal Feed Science and Technology, v. 28, p. 91-101, 1990.
MONTGOMERY, D. C.; PECK, E. A.; VINING, G. G. Introduction to linear regression analysis. 4th ed. New Jersey:
John Wiley & Sons, 2006. 612 p.
NATIONAL RESEARCH COUNCIL.Nutrient requirements of swine. 11th ed. Washington, D. C.: The National Academies
Press, 2012. 420 p.
NOBLET, J.; PEREZ, J. M. Prediction of digestibility of nutrients and energy values of pig diets from chemical analysis.Journal of Animal Science, v. 71, n. 12, p. 3389-3398, 1993.
NUNES, R. V. et al. Coeficientes de metabolizabilidade da
energia bruta de diferentes ingredientes para frangos de corte. Revista Brasileira de Zootecnia, v. 37, n. 1, p. 89-94, 2008.
OLIVEIRA, G. C. et al. Corn types with different nutritional
profiles, extruded or not, on piglets (6 to 15 kg) feeding.Revista Brasileira de Zootecnia, v. 40, n. 11, p. 2462-2470, 2011.
OLIVEIRA, V.; WARPECHOWSKI, M. Avaliação de modelos para predição da energia metabolizável do milho para aves. Ciência Rural, v. 39, n. 5, p. 1514-1520, 2009.
PELIZZERI, R. N.et al. Avaliação de modelos de predição da
energia metabolizável do milho para suínos.Arquivo Brasileiro de Medicina Veterinária e Zootecnia, v. 65, n. 2, p. 460-468, 2013.
POZZA, P. C. et al. Determinação e predição de valores energéticos de silagens de grãos úmidos de milho para suínos. Ciência e Agrotecnologia, v. 34, n. 1, p. 226-232, 2010.
R CORE TEAM.R: a language and environment for statistical computing. Vienna, Austria: R Foundation for Statistical Computing, 2013. Disponível em: <http://www.R-project.org/>. Acesso em: 26 ago. 2016.
ROSTAGNO, H. S. et al. Tabelas brasileiras para aves e suínos: composição de alimentos e exigências nutricionais. 3. ed. Viçosa, MG: UFV, 2011. 252 p.
SAKOMURA, N. K.; ROSTAGNO, H. S. Métodos de pesquisa em nutrição de monogástricos. 2. ed. Jaboticabal, SP: Funep, 2016. 262 p.
SILVA, D. J.; QUEIROZ, A.C.Análise de alimentos: métodos químicos e biológicos. 3. ed. Viçosa, MG: UFV, 2005. 235 p.