Food Science and Technology ISSN 0101-2061
DII:
D httpI://dx.doi.org/10.1590/1678-457X.22016
1 Introduction
In a commercial perspective, turmeric rhizomes are traded as dye, spice, and non-conventional source of industrial starch (Ching et al., 2014; Santana & Meireles, 2014). Hydrothermal hydrolysis, also known as hydrothermal treatment, hydrothermolysis, liquid hot water and compressed hot water hydrolysis, is an environmentally benign method that has been the object of extensive research since the process requires water and heat (Drozco et al., 2012).
Although glucose can be obtained from starch by hydrolysis in the presence of acid or enzyme, neutralization of the hydrolysate is required after acid hydrolysis, and enzymatic hydrolysis is costly (Nagamori & Funazukuri, 2004). In addition to produce low-chain sugars, hydrothermal hydrolysis acts a physical method used to modify the characteristics of the plant biowastes (Alcázar-Alay et al., 2015; Alcázar-Alay & Meireles, 2015).
Working recently with turmeric our research group has been studying the deodorization of crude rhizomes using supercritical fluid extraction with CD2 (Carvalho et al., 2015), depigmentation of deflavored turmeric rhizomes using pressurized liquid ethanol (Dsorio-Tobón et al., 2014) and
starch recovery from deflavored and depigmented turmeric, DDT (Santana et al., 2017) which is the raw material used in this work.
Partial hydrothermal hydrolysis was applied on DDT in order to investigate the reaction performance, composition and marketing potential of two new products obtained from reaction assays, i.e., turmeric hydrolysates (TH), which is the liquid fraction, and partial-hydrolyzed deflavored and depigmented turmeric (PHDDT), the solid fraction.
2 Material and methods
2.1 Material
Deflavored and depigmented turmeric (DDT) was obtained from the crude raw material purchased from Dficina de Ervas Farmácia de Manipulação Ltda (lot 065DM, Ribeirão Preto, Brazil), from which volatile oil was removed using supercritical CD2 at 60 °C and 25 MPa (Carvalho et al., 2015), while curcuminoids were extracted using pressurized ethanol at 60 °C and 10 MPa (Dsorio-Tobón et al., 2014).
Partial-hydrothermal hydrolysis is an effective way to recover bioactives
from turmeric wastes
Ádina Lima de SANTANA1, Juan Felipe DSDRID-TDBÓN2, Fiorella Patricia CÁRDENAS-TDRD3,
Caroline Joy STEEL4, Maria Angela de Almeida MEIRELES1*
Received 03 Feb., 2017 Accepted 03 Sept., 2017
1 Food Engineering Department – DEA, School of Food Engineering - FEA, Universidade de Campinas – UNICAMP, Campinas, SP, Brazil 2 Faculty of Health Sciences, University Institution Colegio Mayor de Antioquia – COLMAYOR, Medellín, Colombia
3 Section of Industrial Engineering, Department of Engineering, Pontifical Catholic University of Peru, San Miguel, Lima, Peru 4 Food Technology Department - DEA, School of Food Engineering - FEA, Universidade de Campinas – UNICAMP, Campinas, SP, Brazil
*Corresponding authorI: [email protected] Abstract
Partial-hydrothermal hydrolysis using pressurized hot water was applied in waste turmeric, derived from extraction processes that employed supercritical and pressurized fluids, as a sustainable alternative for the recovery of bioactive constituents from this material. The reaction products consisted of a liquid extract of fermentable sugars and a solid fraction, which is a mixed biopolymer with relevant composition in terms of starch and antioxidant constituents. The effects of reaction conditions on resulting products were investigated. Economic evaluation was also performed showing that application of partial-hydrothermal hydrolysis from a residual feedstock is feasible in terms of low spend of energy and materials.
Keywords: biowastes; carbohydrates; partial hydrolysis; phenolic compounds.
2.2 Experimental
A home-made pressurized liquid extraction (PLE) apparatus was used for the reaction assays. Three levels of temperature (40, 70 and 100 °C) and seven levels of pressure (1, 2, 3, 4, 5, 6 and 7 MPa) were used. Milli-Q water (EMD Millipore Corporation, Merck, Darmstadt, Germany) was used as solvent, which was pumped with the aid of a high-performance liquid chromatography (HPLC) pump (Thermoseparation Products, Model ConstaMetric 3200 P/F, Fremoni, USA) into the reaction vessel which was placed in an electrical heating jacket at the desired temperature, until the required pressure was obtained. All connections within the system were made using stainless steel tubes. Approximately 3.3 g of DDT was placed in a 5 mL reaction vessel (MV-10 ASFE, Waters, Milford, USA) containing a sintered metal filter at the bottom and upper parts.
The reaction vessel containing the raw material was heated for 5 min to ensure that the reaction vessel would be at the desired temperature. Afterwards the first blocking valve was opened to pressurize the vessel with solvent, until the desired pressure for 20 minutes (static time). Established the static time, the second blocking valve and the back pressure valve were carefully opened.
Preliminary tests established 20 minutes as static time (period of inserting water inside the reaction vessel at the desired temperature and pressure) and 15 minutes as dynamic time (period of hydrolysate collecting) at 1 mLmin-1 (Santana &
Meireles, 2016). After experiments, partial-hydrolyzed deflavored and depigmented turmeric (PHDDT) and turmeric hydrolysates (TH) were maintained at -18 oC, in the dark, until further analysis.
Calculations
Global yield (%, in dry basis) was calculated according to Equation 1 as the ratio of the total mass of hydrolysates (mH, in g) and the mass of feed (F0, in g).
0 0 100 H m X F = ×
(1)
Degree of hydrolysis (DH, %), or material conversion, is defined by Equation 2I:
1 0 0 100 H F F D F − = × (2)
Where F1 is the mass of PHDDT quantified in the reaction vessel, after reaction.
Reducing sugars reaction yield (XRS, %) is defined by Equation 3.
0 100 E W RS RS RS X F + = ×
(3)
Where RSE is the mass of reducing sugar in the product stream (in the collected TH), RSW is the mass of reducing sugar in the unreacted solid material, i.e., PHDDT.
Total sugars reaction yield (XTS, %) is defined by Equation 4I:
0 100 E W TS TS TS X F + = ×
(4)
Where TSE is the mass of total sugar in the product stream, TSW is the mass of total sugar quantified in the unreacted material.
2.3 Solid fraction composition
For the calculations of XRS and XTS parameters, the content of sugars from TH and DDT, i.e., reducing (g glucose/100 g) and total sugars (g sucrose/100 g) were determined according to Somogyi (1937) method adapted by Nelson (1944).
The raw material, i.e. DDT, was characterized in terms ofI: starch, using an enzymatic kit purchased from Megazyme (Bray Business
Park, Bray, Co. Wicklow, Ireland), method number 996.11 (American Association of Cereal Chemists, 1976). The following analysis were carried out using standard methods (Association of Dfficial Analytical Chemists, 1995)I: protein was determined using the micro-Kjedahl method (976.05), ash (ignition at 550 °C in an electric furnace, number 923.03), total fiber (method number 991.43, using a Megazyme enzymatic kit), lipids (Soxhlet apparatus, method
920.39), moisture content (over-drying at 60 °C until constant weight, method 925.40).
Total phenols (g gallic acid/100 g), were analyzed using the Folin-Ciocalteau reagent (Singleton et al., 1999). Curcuminoids were quantified by High Performance Liquid Chromatography (HPLC), according to Dsorio-Tobón et al. (2014) using a Waters Alliance Separation Module (269SD, Milford, USA), diode array detector (2998), flow rate of 1.25 mL min-1 and a C18 column
(150 × 4.6 nm, id., 2.6. μm, Phenomenex, Torrance, USA) that was maintained at 50 oC. The mobile phases were solvent A, which
consisted of 0.1% glacial acetic acid (Ecibra, Brazil) in Milli-Q water (Millipore), and solvent B, which consisted of 0.1% glacial
acetic acid in acetonitrile (JT Baker, USA). Curcuminoids were separated by increasing the content of solvent B from 45% to 65% at a constant flow rate.
Antioxidant activity (AA) expressed as % protection against oxidation, was obtained according to the methodology of Hammerschmidt & Pratt (1978) adapted by Leal et al. (2003).
The moisture of PHDDT was identified using an infrared digital moisture balance (A&D, AD4714A, San Jose, USA), in which 5 g of sample (a single homogenized sample that represents all the analyzed conditions) was injected in the apparatus for 15 minutes, which temperature increased gradually until 125 oC. Because of low
sample availability PHDDT samples from each reaction condition could be characterized only according to starch, total phenols, curcuminoids, and antioxidant activity. All analysis were performed in triplicate, except for fibers and curcuminoids that were made by duplicate, and antioxidant activity that was carried out once.
Scanning Electron Microscopy (SEM)
The structure of turmeric products was examined using a scanning electron microscope (Leo 440i, Cambridge, England), accelerating potential of 15 kV, current of 50 pA and resolution of 1500 ×. The samples were applied on circular aluminum stubs with double carbon sticky tape and coated with 200 Å of gold on the Sputter Coater (EMITECH, K450, Kent, United Kingdom).
Differential Scanning Calorimetry (DSC)
with 5 mg of sample and 15 mg of distilled water were weight in a microanalytic balance (Mettler Toledo, MX5, Zurich, Switzerland). The sample pans with a thin hole in the covers were heated at a rate of 10 °C/min from 20 °C to 120 °C. The heat flow curves, on set temperature (TDS), peak temperature (TPEAK), endset temperature (TES) and enthalpy of gelatinization (∆HGEL) were obtained.
Pasting properties
The Rapid Visco Analyser, RVA (4500, Perten Instruments, Hägersten, Sweden), was used to measure the pasting properties and viscosity curves according to AACC method number 76.21-01 (American Association of Cereal Chemists, 2000).
2.4 Liquid fraction composition
The reaction products were characterized with respect to the quantities of total phenols, curcuminoids and antioxidant activity.
2.5 Statistical analysis
Analysis of variance (Tukey test) using Minitab v.16 software was performed to determine the overall performance of partial-hydrothermal hydrolysis on the composition of TH and PHDDT samples.
2.6 Process simulation
SuperPro Designer 8.5 (Intelligen Inc., Scotch Plains,
NJ, USA) software was used to simulate partial-hydrothermal hydrolysis in a PLE apparatus. The process consisted of a solvent storage tank, a pump to pressurize the system, a heating bath and two extractors allowing for semi-continuous operation (while one reaction vessel was in operation, the other one was cleaned and prepared for the next reaction cycle). Initially, DDT is loaded in the reaction vessel Afterwards, water is pressurized (1 MPa) using a pump and heated (40 oC) using heating bath.
Dnce reached the temperature and pressure conditions into the vessel, 20 min of static time are counted. The reaction begins, TH is collected and PHDDT is recovered.
2.7 Economic evaluation
Economic evaluation parameters
To scale the equipment cost to the required capacity is possible using Equation 5, where C1 is the equipment cost with capacity Q1, C2 is the known base cost for equipment with capacity Q2 and n is a constant related to the type of equipment. Values of n were collected from literature (Green & Perry, 2007; Silla, 2003; Smith, 1995; Turton et al., 2009).
2 1 2 1 n Q C C Q = (5)
Cost of manufacturing (CDM) was estimated according to the methodology proposed by Turton et al. (2009), which components for each process section were estimated in terms of five major costsI: fixed capital of investment (FCI), cost of operational labor (CDL), cost of utilities (CUT), waste treatment cost (CWT) and cost of raw material (CRM). The FCI involves
expenses related to the implementation of the production line, CDL is related to the operators of the units and the CUT considers the energy used in the solvent cycle for steam generation, water refrigeration and electricity requirements. The CRM consists of raw material and solvent costs. In this work, the cost of the raw material is zero because it is the waste from deodorization and depigmenting processes. Finally, CWT was considered to be zero because the waste generated by the process is harmless and clean. The base costs, and the input economic parameters used for simulation are available in the Appendix A.
Scale-up process
For the scale-up, it was assumed that the yield and composition of the reaction products obtained at laboratory scale would also be obtained in industrial scale (Santos et al., 2012). The process was designed to operate for 7920 h per year, which corresponds to 3 daily shifts for 330 days per year considering reaction vessels in volumes of 2 × 5 L, 2 × 50 L and 2 × 500 L. The number of required operators were 1, 2 and 3 for the units of 2 × 5 L, 2 × 50 L and 2 × 500 L, respectively (Veggi et al., 2014). The amount DDT to be processed in each stage was calculated based on the extractor size and apparent density of raw material (838 kg/m-3).
3 Results and discussion
3.1 Hydrothermal hydrolysis experiments
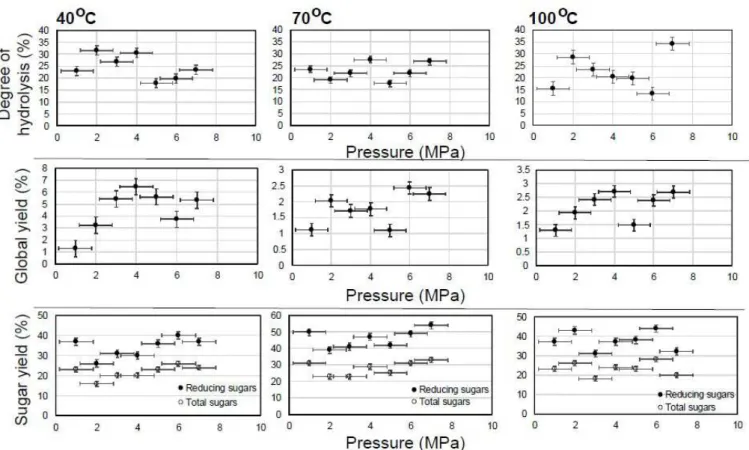
Partial hydrolysis assays resulted on less than 50% of starch from DDT converted into glucose (Figure 1). Degree of hydrolysis close to 80% was found on acid hydrolysis applied to turmeric and ginger wastes using supercritical CD2 and subcritical water at 130-150 °C (Moreschi et al., 2006).
According to Tukey test, reaction conditions had no effect on the reaction parameters as stated in Figure 1. Nevertheless, in terms of a qualitative approach, the increasing of temperature decreased the quality of sugars from TH, analyzed using thin-layer chromatography (Santana & Meireles, 2016).
Converted material (or degree of hydrolysis) obtained in this work were comparable to that reported to hydrothermal hydrolysis of sweet potato starch (Nagamori & Funazukuri, 2004), and lower than those reported to acid hydrolysis applied to avocado seeds (Woldu & Tsigie, 2015), and defatted annatto, Brazilian ginseng and pressed palm fiber (Alcázar-Alay et al., 2015).
3.2 Solid fraction composition
The reaction temperature influenced the resulting composition of PHDDT samples in terms of starch, antioxidant activity and total phenols, on the contrary of pressure, as showed in Table 1 (Tukey test). The content of starch from PHDDT was comparable to those from semi-defatted annatto seeds (Alcázar-Alay et al., 2016). Considering total curcuminoids, bisdemethoxycurcumin occupied approximately 50% of composition (Table 1), differently from those reported elsewhere for crude turmeric and its recovered starch (Santana et al., 2017), from which most of the curcuminoids composition was attributed to curcumin.
Antioxidant activity values were lower (Table 1) when compared to those reported in literature for turmeric extracts microparticles (Santana & Meireles, 2017) and turmeric extracts obtained by supercritical fluid extraction (Braga et al., 2003). Total phenols were higher than that registered for semi defatted annatto seeds (Torres et al., 2015) and lower than in breads prepared by the substitution of wheat flour with crude turmeric powder (Lim et al., 2011).
Differential Scanning Calorimetry
The DSC transition temperatures and enthalpy of gelatinization of solid turmeric were next (Table 2). These variables are comparable (Santana et al., 2017) and different (Leonel et al., 2003) from those reported for turmeric starches, because of differences attributed to the cultivation conditions applied to the raw material.
The gelatinization temperature (TDS) and enthalpy (∆HGEL) of starches depend on the microstructure, the degree of crystallinity
within the granule and on the amylose to amylopectin ratio. Normally, a smaller granule will result in a greater gelatinization temperature (Hansdah et al., 2015).
Thermal behavior of starch is complex because of the physicochemical changes that occur during heating that may involve gelatinization, melting, glass transition and crystallization, change of crystal structure, volume expansion, molecular degradation and motion of water. All these thermal behaviors depend upon the moisture content and the water contained in starch is not stable during heating (Yu & Christie, 2001).
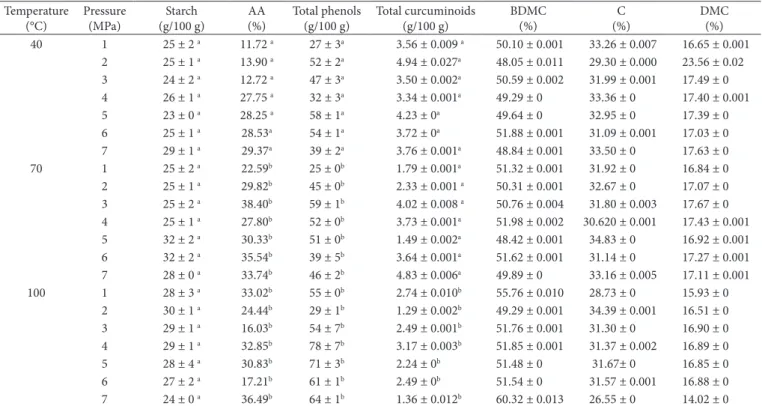
Scanning Electron Microscopy
Solid turmeric presented cellulosic structures and oval-elliptical starch granules with fissures (Figure 2). The exposure, dispersing and fissures of starch granules on DDT are attributed to the previous extraction stages that acted as pretreatments of turmeric for the subsequent reaction assays (Figure 2A). The presence of ruptured cellulosic structures together with starch granules (Figure 2) occurred because cellulose is more difficult to be hydrolyzed than the starch (Nagamori & Funazukuri, 2004). According to the SEM photos, there is no visible morphological changes in the products obtained for most of reaction conditions (Figures 2B-2F). This indicate that reaction conditions, mainly the pressure, may enhance the diffusion of water into the granules, without affect the granule structure (Liu et al., 2009). Nevertheless, it is noted that the conditions of 100 °C and 7 MPa contributed to the leaching of soluble portion of starch into solvent, transforming the granules into formless sacs (Figure 2G).
The impact of partial-hydrothermal hydrolysis on these products has taken the form of heat-moisture-treatments, which is a type of hydrothermal treatment considered natural and safe when compared to chemical modification (Khunae et al., 2010). The reaction assays modified the starch structure promoting the pre-gelatinization the granules (Walter, 1998).
Pasting properties
Rapid Visco Analyser (RVA) is used to evaluate all phases of extruded product during production, including crude raw material, dough, intermediates, dried half-products and final products (Elliott et al., 2015).
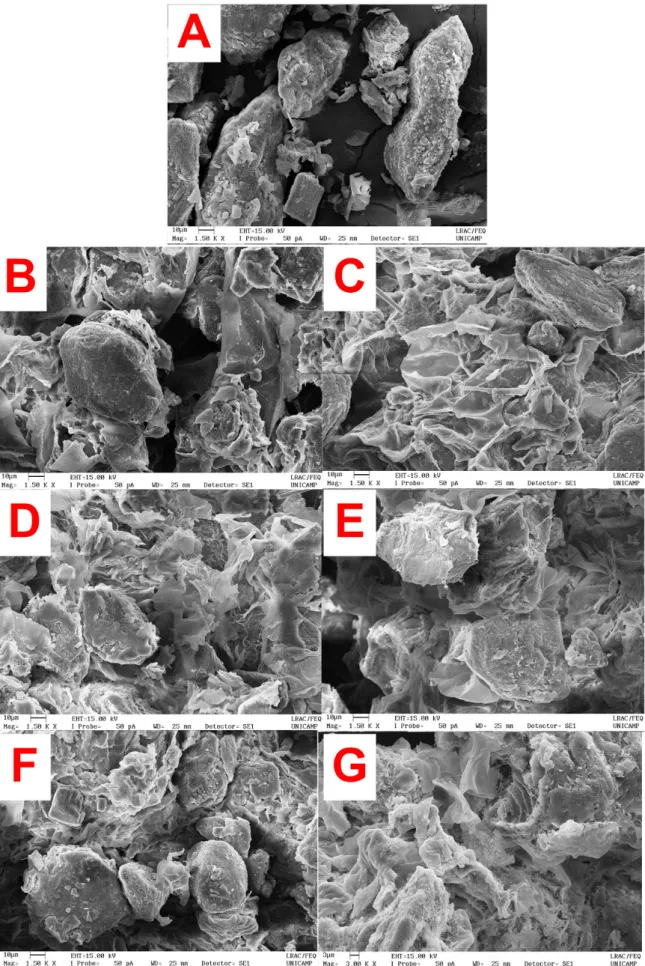
The RVA curves of solid hydrolyzed products (Figures 3B-3D) are characterized by a peak rise time followed by constant increasing, similar as isolated starches from white turmeric (Leonel et al., 2003). The behavior of these curves differs from DDT in terms
of a stationary phase after the peak rise followed by constant increasing (Figure 3A). There is no decrease in viscosity, therefore the breakdown viscosity does not exist.
Partial hydrolysis increased substantially moisture content in solid turmeric. This factor, associated to the reaction conditions contributed to the partial gelatinization of starch granules. Partial gelatinization contributed to the increasing of viscosity values (Figures 3B-3D), which are comparable to the starches from turmeric (Braga et al., 2006), corn and potato (Santana et al., 2017). High viscosity is desirable for industrial uses which objective is the thickening power. The curves denote a high setback behavior (Figure 3), which indicate strong tendency to retrograde.
For the materials hydrolyzed at 40 °C it is noted an almost linear influence of pressure on pasting properties, and high pasting behavior at lower pressures, differently from the materials hydrolyzed at higher pressures, except for 6 MPa, which curve was overlapped by the product hydrolyzed at 4 MPa.
Nevertheless, considering the solid materials hydrolyzed at 70 °C and 100 °C, the effects of pressure resulted in a complex behavior described by absence of linearity, when compared to the curves obtained from the materials hydrolyzed at 40 °C.
3.3 Liquid fraction composition
Reaction temperature variations influenced antioxidant activity and total phenols (Table 3), which increased slightly as a function of temperature, on the contrary of most phenolic compounds that are unstable and highly susceptible to thermal Table 1. Composition of PHDDT samples.
Temperature (°C) Pressure (MPa) Starch (g/100 g) AA (%) Total phenols (g/100 g) Total curcuminoids (g/100 g) BDMC (%) C (%) DMC (%) 40 1 25 ± 2 a 11.72 a 27 ± 3a 3.56 ± 0.009 a 50.10 ± 0.001 33.26 ± 0.007 16.65 ± 0.001
2 25 ± 1 a 13.90 a 52 ± 2a 4.94 ± 0.027a 48.05 ± 0.011 29.30 ± 0.000 23.56 ± 0.02
3 24 ± 2 a 12.72 a 47 ± 3a 3.50 ± 0.002a 50.59 ± 0.002 31.99 ± 0.001 17.49 ± 0
4 26 ± 1 a 27.75 a 32 ± 3a 3.34 ± 0.001a 49.29 ± 0 33.36 ± 0 17.40 ± 0.001
5 23 ± 0 a 28.25 a 58 ± 1a 4.23 ± 0a 49.64 ± 0 32.95 ± 0 17.39 ± 0
6 25 ± 1 a 28.53a 54 ± 1a 3.72 ± 0a 51.88 ± 0.001 31.09 ± 0.001 17.03 ± 0
7 29 ± 1 a 29.37a 39 ± 2a 3.76 ± 0.001a 48.84 ± 0.001 33.50 ± 0 17.63 ± 0
70 1 25 ± 2 a 22.59b 25 ± 0b 1.79 ± 0.001a 51.32 ± 0.001 31.92 ± 0 16.84 ± 0
2 25 ± 1 a 29.82b 45 ± 0b 2.33 ± 0.001 a 50.31 ± 0.001 32.67 ± 0 17.07 ± 0
3 25 ± 2 a 38.40b 59 ± 1b 4.02 ± 0.008 a 50.76 ± 0.004 31.80 ± 0.003 17.67 ± 0
4 25 ± 1 a 27.80b 52 ± 0b 3.73 ± 0.001a 51.98 ± 0.002 30.620 ± 0.001 17.43 ± 0.001
5 32 ± 2 a 30.33b 51 ± 0b 1.49 ± 0.002a 48.42 ± 0.001 34.83 ± 0 16.92 ± 0.001
6 32 ± 2 a 35.54b 39 ± 5b 3.64 ± 0.001a 51.62 ± 0.001 31.14 ± 0 17.27 ± 0.001
7 28 ± 0 a 33.74b 46 ± 2b 4.83 ± 0.006a 49.89 ± 0 33.16 ± 0.005 17.11 ± 0.001
100 1 28 ± 3 a 33.02b 55 ± 0b 2.74 ± 0.010b 55.76 ± 0.010 28.73 ± 0 15.93 ± 0
2 30 ± 1 a 24.44b 29 ± 1b 1.29 ± 0.002b 49.29 ± 0.001 34.39 ± 0.001 16.51 ± 0
3 29 ± 1 a 16.03b 54 ± 7b 2.49 ± 0.001b 51.76 ± 0.001 31.30 ± 0 16.90 ± 0
4 29 ± 1 a 32.85b 78 ± 7b 3.17 ± 0.003b 51.85 ± 0.001 31.37 ± 0.002 16.89 ± 0
5 28 ± 4 a 30.83b 71 ± 3b 2.24 ± 0b 51.48 ± 0 31.67± 0 16.85 ± 0
6 27 ± 2 a 17.21b 61 ± 1b 2.49 ± 0b 51.54 ± 0 31.57 ± 0.001 16.88 ± 0
7 24 ± 0 a 36.49b 64 ± 1b 1.36 ± 0.012b 60.32 ± 0.013 26.55 ± 0 14.02 ± 0
Mean ± standard deviation of determinations. Different letters in the same column inidicate significant difference related to the effects of temperature (p<0.05). BDMC – bisdemethoxycurcumin; C – curcumin; DMC – demethoxycurcumin.
Table 2. DSC gelatinization parameters of DDT and PHDDT samples.
Temperature (°C)
Pressure (MPa)
∆HGEL
(J/g) TDS (°C)
TPEAK (°C) TES (°C) Before hydrolysis
29.93 97.4 101.88 142.74
40 1 28.75 98.07 105.36 141.56
7 27.94 97.81 105.26 147.24
70 1 29.07 97.37 104.89 140.14
7 29.98 97.04 102.77 137.81
100 1 29.51 97.31 102.42 142.85
Figure 3. Pasting Properties of DDT (A) and PHDDT at 40 oC (B), 70 oC (C) and 100 oC (D).
Table 3. Composition of TH samples.
Temperature (°C)
Pressure (MPa)
AA (%)
Total phenols (g/100g)
Total curcuminoids (g/100g)*
BDMC (%)
C (%)
DMC (%)
40 1 1.68a 16 ± 4 a 0.44a 27.27 39.20 33.52
2 0 a 16 ± 2 a 0.36 a 26.56 39.61 33.84
3 12.44 a 7 ± 3 a 0.46 a 25.96 39.97 34.08
4 0.50 a 12 ± 5 a 0.30 a 25.13 40.87 34.00
5 7.06 a 11 ± 4 a 0.32 a 22.22 36.61 30.89
6 1.18 a 16 ± 2 a 0.41 a 25.63 40.37 34.00
7 0 a 16 ± 5 a 0.29 a 32.83 49.54 42.44
70 1 19.73b 48 ± 1b 0.39 a 28.10 41.79 35.67
2 13.68 b 31 ± 3 b 0.35 a 30.05 45.90 39.23
3 22.48 b 25 ± 0 b 0.47 a 32.10 51.40 43.95
4 14.63 b 19 ± 1 b 0.41 a 23.68 37.65 32.80
5 9.64 b 49 ± 1 b 0.42 a 24.84 39.55 34.48
6 12.78 b 23 ± 2 b 0.44 a 30.15 47.06 41.37
7 20.96 b 25 ± 0 b 0.41 a 35.83 53.45 46.04
100 1 13.85 b 27 ± 1 b 0.28 a 36.63 53.50 44.87
2 16.03 b 20 ± 2 b 0.56 a 28.10 44.32 37.34
3 7.23 b 25 ± 3 b 0.32 a 30.23 55.05 47.09
4 13.12 b 32 ± 4 b 0.57 a 33.96 50.01 43.34
5 13.85 b 34 ± 1 b 0.43 a 39.41 54.78 48.07
6 15.92 b 32 ± 0 b 0.25 a 34.96 48.86 41.72
7 12.11 b 38 ± 4 b 0.43 a 35.41 48.36 41.70
degradation. The quality of curcuminoids detected in TH differs from the PHDDT with respect to the total quantity and to the highest proportion of curcumin (Table 3). Total curcuminoids detected in TH is lower when compared to that reported to ethanolic extracts obtained from deodorized turmeric wastes (Dsorio-Tobón et al., 2014).
Antioxidant activity values of TH were lower than those higher than 50% reported for turmeric volatile oil and curcuminoids extracts (Santana & Meireles, 2017), and Brazilian ginseng extracts (Debien et al., 2015).
Because the raw material used in this work is a waste from extraction processes, it was already expected the bioactives constituents quantified would be lower than those from crude or minimally extracted plant materials. Nevertheless, the quality of the products obtained is relevant in terms of carbohydrates and curcuminoids, which contribute to the antioxidant effectiveness. Therefore, partial hydrolysis is an interesting alternative to prevent DDT from being discarded.
3.4 Economic evaluation of the process
The CDM of PHDDT was US$ 0.90 kg−1 for a process capacity
of 2 × 5 L, US$ 0.31 kg−1 for 2×50 L plant and US$ 0.14 kg−1 for
a 2 × 500 L (Figure 4A). The CDMs of TH were estimated to be US$ 2.56 kg−1, US$ 0.96 kg−1 and US$ 0.43 kg−1 for processes
with capacity of 2 × 5 L, 2 × 50 L and 2 × 500 L, respectively (Figure 4B). The process employed in this work is advantageous due to the relatively short duration of reaction assays and the use of water, a cheap and safe solvent.
Considering a process using a two 50 L vessel system, the calculated CDMs for TH and PHDDT were approximately 5.6 and 17.38 times lower than the CDMs obtained by Dsorio-Tobón et al. (2014) in the extraction of curcuminoids from deflavored turmeric via PLE using ethanol as solvent and considering the cost of the raw material equal to zero.
As have been established by other researchers, the CRM plays a very important role in CDM. However, in this work, as the cost of raw material is zero and the extract solvent is
water, it was possible to obtain a very low CDM. Therefore, partial-hydrothermal hydrolysis appears to be an attractive and economically feasible technique for obtaining new products from plant wastes. The raw material used is a waste with no monetary value, thus the participation of DDT in the CDM is zero. However, the solvent contributes with a slight increase in the participation of the CRM in the CDM when the process is scaled-up, i.e., participation of the CRM in the CDM increased from 0.71% to 4.41% when the process is scale-up from 5 L to 500 L (Figure 4C).
As the process scale increased, the CDL decreased its impact on the CDM, whereas as the process scale increased, the FCI increased its impact on the CDM. For example, the CDL decreased from 63.64% to 17.05%, whereas the FCI increased from 35.48% to 77.5% when the process is scale-up from 5 L to 500 L (Figure 4C). Although with the scale-up process is necessary more quantity of workers, the impact related with the implementation of the production line at higher scales, contributed with a decrease in the participation of CDL in the CDM, instead of an increased in the participation in CDM due to the increased in the number of workers. The CUT almost had not participation in CDM (Figure 4C).
A slight increase in the participation of the CUT in the CDM was observed. Factors such as quantities of solvent, energetic expenditures and energy requirements, product of the longer processing time, contributed with the increase in the participation of the CUT in the CDM due to the scale-up procedure.
This section provided an economic evaluation of partial hydrolysis using pressurized hot water for the recovery of bioactive constituents from waste turmeric to the scientific community and companies. In this context, the presented behavior gives relevant information for further systematic and more accurate studies or projects. Besides, further studies on economic evaluation of application of partial hydrolysis should evaluate carefully the characteristics of the raw material, demand, the market that is focused, the country, the quality requirements and local fees, among other issues, to provide more deterministic results.
4 Conclusions
Partial hydrolysis using pressurized hot water contributed to the polymer modification of deflavored and depigmented turmeric waste, which can attribute to this material application in industry as complementary starch source to the conventional ones, like corn and rice, besides adding color and improving antioxidant effectiveness on products. Furthermore, the process provided a liquid fraction source of simple sugars and curcuminoids, which can be used as a nutritional additive for food formulations.
The effects of temperature and pressure on the composition of liquid fraction were statistically irrelevant, except in terms of total phenolics, which increase in temperature contributed to increase the availability of these constituents. Nevertheless, reaction conditions provided pregelatinized granules on the solid fraction with viscosity values comparable to those reported on literature.
Economic evaluation showed that the process applied in this work appears to be an attractive and economically feasible technique to reuse deflavored and depigmented turmeric due to
the short duration and the use of water, a cheap and considered safe solvent.
References
Alcázar-Alay, S. C., & Meireles, M. A. A. (2015). Physicochemical properties, modifications and applications of starches from different botanical sources. Food Science and Technology (Campinas), 35(2), 215-236. httpI://dx.doi.org/10.1590/1678-457X.6749.
Alcázar-Alay, S. C., Cardenas-Toro, F. P., Santos, D. T., & Meireles, M. A. A. (2015). Study of an extraction process as the pretreatment step for sugar production from acid hydrolysis. Food and Public Health, 5, 47-55. httpI://dx.doi.org/10.5923/j.fph.20150502.03.
Alcázar-Alay, S. C., Dsorio-Tobón, J. F., Forster-Carneiro, T., Steel, C .J., & Meireles, M. A. A. (2016). Polymer modification from semi-defatted annatto seeds using hot pressurized water and supercritical CD2. The Journal of Supercritical Fluids, (In press).
American Association of Cereal Chemists – AACC. (1976). Approved methods of the AACC: method 996.11. St. PaulI: AACC.
American Association of Cereal Chemists – AACC. (2000). Internacional approved methods of analysis (10th ed.). St. PaulI: AACC.
Association of Dfficial Analytical Chemists – ADAC. (1995). Official methods of analysis of Association of Official Analytical Chemists International. ArlingtonI: ADAC.
Braga, M. E. M., Leal, P. F., Carvalho, J. E., & Meireles, M. A. A. (2003). Comparison of yield, composition, and antioxidant activity of turmeric (Curcuma longa L.) extracts obtained using various techniques. Journal of Agricultural and Food Chemistry, 51(22), 6604-6611. PMidI:14558784. httpI://dx.doi.org/10.1021/jf0345550.
Braga, M. E. M., Moreschi, S. R. M., & Meireles, M. A. A. (2006). Effects of supercritical fluid extraction on Curcuma longa L. and Zingiber officinale R. starches. Carbohydrate Polymers, 63(3), 340-346. httpI:// dx.doi.org/10.1016/j.carbpol.2005.08.055.
Carvalho, P. I. N., Dsorio-Tobón, J. F., Rostagno, M. A., Petenate, A. J., & Meireles, M. A. A. (2015). Techno-economic evaluation of the extraction of turmeric (Curcuma longa L.) oil and ar-turmerone using supercritical carbon dioxide. The Journal of Supercritical Fluids, 105, 44-54. httpI://dx.doi.org/10.1016/j.supflu.2015.03.020. Ching, W. Y., Yusoff, Y. B., & Wan-Amarina, W. N. B. (2014). Extraction of essential oil from Curcuma longa. Journal of Food Chemistry and Nutrition, 2, 1-10.
Debien, I. C. N., Vardanega, R., Santos, D. T., & Meireles, M. A. A. (2015). Pressurized liquid extraction as a promising and economically feasible technique for obtaining Beta-Ecdysone-Rich extracts from Brazilian Ginseng (Pfaffia glomerata) roots. Separation Science and Technology, 50(11), 1647-1657. httpI://dx.doi.org/10.1080/0149639 5.2014.975361.
Elliott, B., Dang, J. M. C., & Bason, M. L. (2015). How the RVA can contribute to understanding extruded foods and feeds. AustraliaI: Newport Scientific.
Green, D., & Perry, R. (2007). Perry’s chemical engineers’ handbook (8th ed.). New YorkI: McGraw-Hill.
Hammerschmidt, P. A., & Pratt, D. E. (1978). Phenolic antioxidants of dried soybeans. Journal of Food Science, 43(2), 556-559. httpI:// dx.doi.org/10.1111/j.1365-2621.1978.tb02353.x.
Santana, Á. L., & Meireles, M. A. A. (2016). Thin-layer chromatography profiles of non-commercial turmeric (Curcuma longa L.) products obtained via partial hydrothermal hydrolysis. Food and Public Health, 6, 15-25.
Santana, Á. L., & Meireles, M. A. A. (2017). Coprecipitation of turmeric extracts and polyethylene glycol with compressed carbon dioxide. The Journal of Supercritical Fluids, 125, 31-41. httpI://dx.doi.org/10.1016/j. supflu.2017.02.002.
Santana, Á. L., Zabot, G. L., Dsorio-Tobón, J. F., Johner, J. C. F., Coelho, A. S., Schmiele, M., Steel, C. J., & Meireles, M. A. A. (2017). Starch recovery from turmeric wastes using supercritical technology. Journal of Food Engineering, 214, 266-276. httpI://dx.doi.org/10.1016/j. jfoodeng.2017.07.010.
Santos, D. T., Veggi, P. C., & Meireles, M. A. A. (2012). Dptimization and economic evaluation of pressurized liquid extraction of phenolic compounds from jabuticaba skins. Journal of Food Engineering, 108(3), 444-452. httpI://dx.doi.org/10.1016/j.jfoodeng.2011.08.022. Silla, H. (2003). Chemical process engineering: design and economics.
Boca RatonI: Taylor & Francis.
Singleton, V. L., Drthofer, R., & Lamuela-Raventos, R.M. (1999). Analysis of total phenols and other oxidation substrates and antioxidants by means of Folin-Ciocalteu reagent. Methods in Enzymology, 299, 152-178.
Smith, R. (1995). Chemical process design. New YorkI: McGraw-Hill. Somogyi, M. (1937). A reagent for the cooper-iodometric determination
of very small amounts of sugar. The Journal of Biological Chemistry, 117, 771-776.
Torres, R. A. C., Santos, D. T., & Meireles, M. A. A. (2015). Novel Extraction method to produce active solutions from plant materials. Food and Public Health, 5, 38-46. httpI://dx.doi.org/10.5923/j.fph.20150502.02. Turton, R., Bailie, R. C., & Whiting, W. B. (2009). Analysis, synthesis, and design of chemical processes. Upper Saddle RiverI: Prentice Hall. U.S. Bureau of Labor Statistics – BLS. (2015). Country at a Glance:
Brazil. Washington, DCI: BLS. Retrieved from httpI://www.bls.gov/ fls/country/brazil.htm
U.S. Energy Information Administration – EIA. (2015). Washington, DCI: EIA. Retrieved from httpI://www.eia.gov
Veggi, P. C., Cavalcanti, R. N., & Meireles, M. A. A. (2014). Production of phenolic-rich extracts from brazilian plants using supercritical and subcritical fluid extractionI: experimental data and economic evaluation. Journal of Food Engineering, 131, 96-109. httpI://dx.doi. org/10.1016/j.jfoodeng.2014.01.027.
Walter, R. H. (1998). Polysacccharide association strucutres in food. New YorkI: Marcel Dekker.
Woldu, A. R., & Tsigie, Y. A. (2015). Dptimization of Hydrolysis for reduced sugar determination from Avocado seed wastes. American Journal of Environment Energy and Power Research, 3, 1-10. Yu, L., & Christie, G. (2001). Measurement of starch thermal transitions
using differential scanning calorimetry. Carbohydrate Polymers, 46(2), 179-184. httpI://dx.doi.org/10.1016/S0144-8617(00)00301-5. Khunae, P., Tran, T., & Sirivongpisal, P. (2010). Water properties in
food, health, phamaceutical and biological systems. HobokenI: John Wiley & Sons.
Leal, P. F., Braga, M. E. M., Sato, D. N., Carvalho, J. E., Marques, M. D. M., & Meireles, M. A. A. (2003). Functional properties of spice extracts obtained via supercritical fluid extraction. Journal of Agricultural and Food Chemistry, 51(9), 2520-2525. PMidI:12696930. httpI://dx.doi.org/10.1021/jf0260693.
Leonel, M., Sarmento, S. B. S., & Cereda, M. P. (2003). New starches for the food industryI: Curcuma longa and Curcuma zedoaria. Carbohydrate Polymers, 54(3), 385-388. httpI://dx.doi.org/10.1016/ S0144-8617(03)00179-6.
Lim, H. S., Park, S. H., Ghafoor, K., Hwang, S. Y., & Park, J. (2011). Quality and antioxidant properties of bread containing turmeric (Curcuma longa L.) cultivated in South Korea. Food Chemistry, 124(4), 1577-1582. httpI://dx.doi.org/10.1016/j.foodchem.2010.08.016. Liu, H., Yu, L., Dean, K., Simon, G., Petinakis, E., & Chen, L. (2009). Starch gelatinization under pressure studied by high pressure DSC. Carbohydrate Polymers, 75(3), 395-400. httpI://dx.doi.org/10.1016/j. carbpol.2008.07.034.
Moreschi, S. R. M., Leal, J. C., Braga, M. E. M., & Meireles, M. A. A. (2006). Ginger and turmeric starches hydrolysis using subcritical water + CD2I: the effect of the SFE pre-treatment. Brazilian Journal of Chemical Engineering, 23(2), 235-242. httpI://dx.doi.org/10.1590/ S0104-66322006000200011.
Nagamori, M., & Funazukuri, T. (2004). Glucose production by hydrolysis of starch under hydrothermal conditions. Journal of Chemical Technology and Biotechnology (Oxford, Oxfordshire), 79(3), 229-233. httpI://dx.doi.org/10.1002/jctb.976.
Nelson, N. (1944). A photometric adaption of the Somogyi method for the determination of glucose. The Journal of Biological Chemistry, 153, 375-380.
Drozco, R. L., Redwood, M. D., Leeke, G. A., Bahari, A., Santos, R. C. D., & Macaskie, L. E. (2012). Hydrothermal hydrolysis of starch with CD2 and detoxification of the hydrolysates with activated carbon for bio-hydrogen fermentation. International Journal of Hydrogen Energy, 37(8), 6545-6553. httpI://dx.doi.org/10.1016/j. ijhydene.2012.01.047.
Dsorio-Tobón, J. F., Carvalho, P. I. N., Rostagno, M. A., Petenate, A. J., & Meireles, M. A. A. (2014). Extraction of curcuminoids from deflavored turmeric (Curcuma longa L.) using pressurized liquidsI: process integration and economic evaluation. The Journal of Supercritical Fluids, 95, 167-174. httpI://dx.doi.org/10.1016/j. supflu.2014.08.012.
Peters, M. S., Thimmerhaus, K. D., & West, R. (2003). Plant design and economics for chemical engineers. (5th ed.). New YorkI: McGraw-Hill. Sanasa. (2015). CampinasI: SANASA. Retrieved from httpI://www.bls.
gov/fls/country/brazil.htm
Appendix A. Supplementary materialI: cost of manufacture and pasting properties data.
Figure A.1. Home-made PLE apparatus used for the hydrolysis assays.
Table A.1. Base cost for equipment composing the extraction plant.
Equipment na Unit base cost (US$) b
PLE apparatus
Storage tank 0.57 300.00
Jacketed extraction vessel c 0.82 5,540.00
Electric liquid pump 0.55 3,920.00
Heater 0.59 820.00
Manometer 0 410.00
Block valve 0.60 220.00
Back-pressure valve 0.60 1,780.00
Micrometering valve 0.60 1,090.00
Flowmeter 0.60 700.00
Safety Valve 0.60 310.00
Temperature controller 0.60 310.00
Piping. connectors. crossheads. mixers and splitters d 0.60 3,660.00
Structural material for supporting the equipment d 0.60 4,060.00
Partial-hydrothermal hydrolysis ̶ 23,120.00
a n - constant depending on equipment type (Green & Perry, 2007; Silla, 2003; Smith, 1995; Turton et al., 2009); b Based on an operating plant with extractors of 1 L; c Supporting pressures up to 60 MPa; d Total cost.
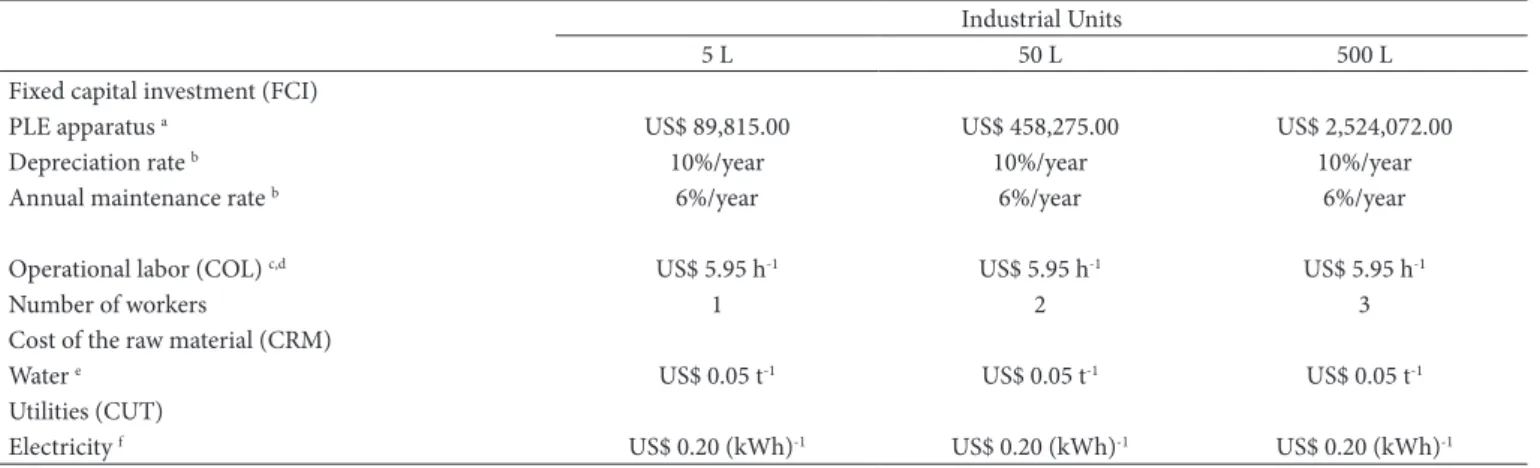
Table A.2. Input economic parameters used in the SuperPro Designer 8.5 software.
Industrial Units
5 L 50 L 500 L
Fixed capital investment (FCI)
PLE apparatus a US$ 89,815.00 US$ 458,275.00 US$ 2,524,072.00
Depreciation rate b 10%/year 10%/year 10%/year
Annual maintenance rate b 6%/year 6%/year 6%/year
Dperational labor (CDL) c,d US$ 5.95 h-1 US$ 5.95 h-1 US$ 5.95 h-1
Number of workers 1 2 3
Cost of the raw material (CRM)
Water e US$ 0.05 t-1 US$ 0.05 t-1 US$ 0.05 t-1
Utilities (CUT)
Electricity f US$ 0.20 (kWh)-1 US$ 0.20 (kWh)-1 US$ 0.20 (kWh)-1
a Estimated cost using the Equation 5; b Based on Peters et al. (2003); c U.S. Bureau of Labor Statistics (2015); d Turton et al. (2009); e Sanasa (2015); f U.S. Energy Information Administration (2015).
Table A.3. Cost of manufacturing parameters for partial hydrolysis.
Partial Hydrolysis Size Total Capital
Investment Dperating Cost CDM TH CDM PHDDT
Cost Basis Annual Rate
Raw Material Labor Facility Utilities
CMR CDL FCI CUT
L US$ US$.year-1 US$.kg-1 kg.year-1 % % % %
5 193,000.00 108,000.00 2.56 0.90 120,010.00 0.71 63.64 35.48 0.17
50 964,000.00 361,000.00 0.96 0.31 1,166,930.00 1.97 43.6 53.96 0.47
500 5,259,000.00 1,384,000.00 0.43 0.14 10,016,624.00 4.41 17.05 77.5 1.04
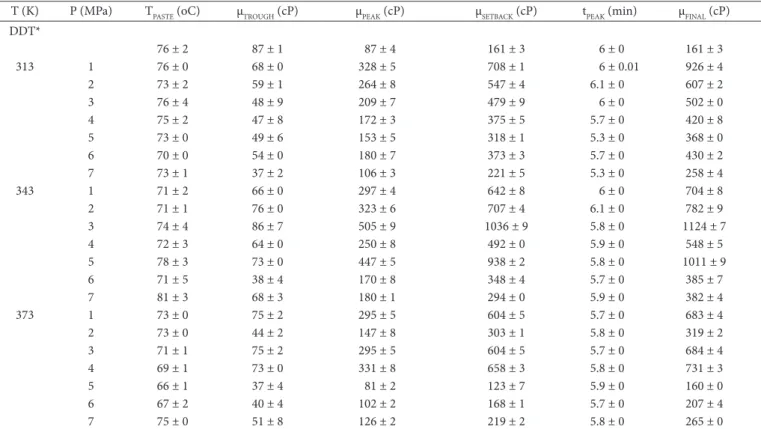
Table A.4. Pasting properties of PHDDT.
T (K) P (MPa) TPASTE (oC) μTRDUGH (cP) μPEAK (cP) μSETBACK (cP) tPEAK (min) μFINAL (cP) DDT*
76 ± 2 87 ± 1 87 ± 4 161 ± 3 6 ± 0 161 ± 3
313 1 76 ± 0 68 ± 0 328 ± 5 708 ± 1 6 ± 0.01 926 ± 4
2 73 ± 2 59 ± 1 264 ± 8 547 ± 4 6.1 ± 0 607 ± 2
3 76 ± 4 48 ± 9 209 ± 7 479 ± 9 6 ± 0 502 ± 0
4 75 ± 2 47 ± 8 172 ± 3 375 ± 5 5.7 ± 0 420 ± 8
5 73 ± 0 49 ± 6 153 ± 5 318 ± 1 5.3 ± 0 368 ± 0
6 70 ± 0 54 ± 0 180 ± 7 373 ± 3 5.7 ± 0 430 ± 2
7 73 ± 1 37 ± 2 106 ± 3 221 ± 5 5.3 ± 0 258 ± 4
343 1 71 ± 2 66 ± 0 297 ± 4 642 ± 8 6 ± 0 704 ± 8
2 71 ± 1 76 ± 0 323 ± 6 707 ± 4 6.1 ± 0 782 ± 9
3 74 ± 4 86 ± 7 505 ± 9 1036 ± 9 5.8 ± 0 1124 ± 7
4 72 ± 3 64 ± 0 250 ± 8 492 ± 0 5.9 ± 0 548 ± 5
5 78 ± 3 73 ± 0 447 ± 5 938 ± 2 5.8 ± 0 1011 ± 9
6 71 ± 5 38 ± 4 170 ± 8 348 ± 4 5.7 ± 0 385 ± 7
7 81 ± 3 68 ± 3 180 ± 1 294 ± 0 5.9 ± 0 382 ± 4
373 1 73 ± 0 75 ± 2 295 ± 5 604 ± 5 5.7 ± 0 683 ± 4
2 73 ± 0 44 ± 2 147 ± 8 303 ± 1 5.8 ± 0 319 ± 2
3 71 ± 1 75 ± 2 295 ± 5 604 ± 5 5.7 ± 0 684 ± 4
4 69 ± 1 73 ± 0 331 ± 8 658 ± 3 5.8 ± 0 731 ± 3
5 66 ± 1 37 ± 4 81 ± 2 123 ± 7 5.9 ± 0 160 ± 0
6 67 ± 2 40 ± 4 102 ± 2 168 ± 1 5.7 ± 0 207 ± 4
7 75 ± 0 51 ± 8 126 ± 2 219 ± 2 5.8 ± 0 265 ± 0