http://dx.doi.org/10.1590/1806-9061-2016-0279
Author(s)
Lopes WRTI
Orrico ACAI
Garcia RGI
Orrico Jr MAPI
Manarelli DMI
Fava AFI
Nääs IAI
I Federal University of Grande Dourados,
College of Animal Sciences, Rodovia Dou-rados - Itahum, km 12. Caixa Postal: 533, CEP: 79804-970 - Dourados - MS. Brazil.
Mail Address
Corresponding author e-mail address Ana Carolina Amorim Orrico
Federal University of Grande Dourados, College of Animal Sciences, Rodovia Dourados - Itahum, km 12. Caixa Postal: 533, CEP: 79804-970 - Dourados - MS. Brazil.
Phone: +556734102374 Email: [email protected]
Keywords
Poultry production, biogas, methane, total solids, volatile solids.
Submitted: June/2016 Approved: August/2016
ABSTRACT
The objective of this study was to determine the optimal inclusion level of liquid egg hatchery waste for the anaerobic co-digestion of dairy cattle manure. A completely randomized experimental was applied, with seven treatments (liquid hatchery waste to cattle manure ratios of0: 100, 5:95, 10:90, 15:85, 20:80, 25:75 and 30:70), with five replicates (batch digester model) each. The evaluated variables were disappearance of total solids (TS), volatile solids (VS), and neutral detergent fiber (NDF), and specific production of biogas and of methane. Maximum TS and VS disappearance of 41.3% and 49.6%, were obtained at 15.5% and 16.0% liquid hatchery waste inclusion levels. The addition of 22.3% liquid hatchery considerably reduced NDF substrate content (53.2%). Maximum specific biogas production was obtained with 17% liquid hatchery waste, with the addition of 181.7 and 229.5 L kg-1TS and VS,
respectively. The highest methane production, at 120.1 and 151.8 L CH4 kg-1TS and VS, was obtained with the inclusion of 17.5 and 18.0%
liquid hatchery waste, respectively. The addition of liquid hatchery waste atratios of up to 15.5%in co-digestion with cattle manure reduced solid and fiber levels in the effluent, and improved biogas and methane production.
INTRODUCTION
The global demand for food is increasing every year under the pressure of the worldwide population growth. Food supply has been possible due to the expansion and intensification of the meat production systems. However, these systems also produce a significant amount of waste, which is characterized by high organic and nutrient load, and therefore, it is highly polluting. On the other hand, these components may also favor biological treatment processes, recycling energy and nutrients, thereby resulting in lower environmental impact.
Thousands of eggs are incubated in Brazil, and the average efficiency of incubation is near 85%, producing a large volume of waste (Kobashigawa et al., 2008). Carvalho et al. (2013) estimated that the daily incubation waste is around 1.6 and 1.3 tons per 100,000 incubated eggs, both in broiler and laying hen hatcheries.
Anaerobic digestion is one of the most common techniques for the treatment of effluents with high concentrations of organic matter (Nuchdang & Phala-kornkule, 2012; Aggarangsi et al., 2013). During this process, the organic matter in waste is broken down in the absence of oxygen, yielding biogas, which contains high levels of methane. Also, the remaining digested and stabilized material can be used as biofertilizer.
Hatchery liquid waste can be submitted to anaerobic digestion because it can be easily added to the digesters. However, it cannot be individually digested because it contains high nitrogen (expressed as crude protein content) and ether extract levels. Therefore, anaerobic co-digestion, associating two or more types of waste, may be used as an alternative method for hatchery waste treatment. The anaerobic digestion of hatchery liquid waste with other waste materials may supplement deficiencies, and result in more efficient breakdown of the organic fractions and increase biogas and methane production.
According to Mata-Alvarez et al. (2014), the co-digestion of dairy cattle manure with energy-rich agroindustry waste provides better carbon (C) to nitrogen (N) ratio, resistance to acidification of the medium, and higher levels of nutrients available for digestion. An alternative for the digestion of liquid hatchery waste is the association with cattle manure. Although cattle waste can be individually biodigested and its anaerobic digestion is widely used, its high fiber content and limited N levels maybe balanced by the high lipid and N concentrations found in hatchery waste. There is a considerable body of research (Orrico Jr. et al., 2012) on the anaerobic digestion of cattle manure; however, there are few studies on the anaerobic digestion of hatchery waste, and often discuss only the limitations of the use of its solid and liquid fractions.
This study aimed at determining the optimal addition level of liquid hatchery waste to dairy cattle manure submitted to anaerobic co-digestion to reduce solid and fiber content and to increase biogas and methane production.
MATERIAL AND METHODS
The study was carried out in Dourados, state of Mato Grosso, Brazil (latitude 22º11’55” S, longitude 54º56’7” W, and altitude of 452 m). The climate of this region is wet mesothermal (Cwa, according to Köppen climate classification), with 20-24 ºC average environmental temperature and 1250-1500 mm annual rainfall.
A completely randomized experimental design was adopted, with seven treatments. Treatments consisted of the anaerobic digestion of different ratios of liquid hatchery waste to dairy-cattle manure (0:100; 5:95; 10:90; 15:85; 20:80; 25:85; and 30:70, respectively), on total solid (TS) content basis, in five different biodigesters (replicates), totaling 35 experimental units.
Cattle waste was collected on a dairy farm by scraping the floor where the cows were housed, prioritizing fresh manure and trying to avoid contamination from the floor. A commercial hatchery provided the liquid hatchery waste, which primarily consisted of infertile and abnormal eggs of the last egg batch transferred on day 18 of incubation from the setter to the hatcher. During disposal at the hatchery, the waste was separated in two fractions: one consisting of eggshells (solid fraction), and the other of egg contents (liquid fraction), which was used for the anaerobic co-digestion process in the present experiment. After collection, both cattle manure and hatchery waste were submitted to the Agricultural Waste Management Laboratory of the Federal University of Grande Dourados for chemical analyses (Table 1).
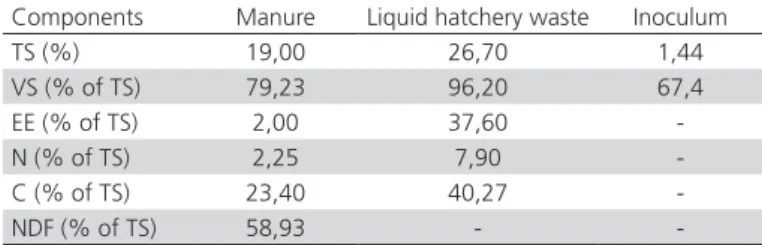
Table 1 – The chemical composition of the wastes and inoculum used for the preparation of the substrates.
Components Manure Liquid hatchery waste Inoculum
TS (%) 19,00 26,70 1,44
VS (% of TS) 79,23 96,20 67,4
EE (% of TS) 2,00 37,60
-N (% of TS) 2,25 7,90
-C (% of TS) 23,40 40,27
-NDF (% of TS) 58,93 -
-Before the substrates were prepared for digestion, the inoculum was produced by feeding batch digesters with dairy manure diluted in water at a concentration of 3% TS. The inoculum was considered ready when maximum methane concentration was achieved and maintained at 82.3%. The inoculum was added at 10% TS to each digester at the beginning of the experimental period.
The digesters basically consisted of with two straight PVC cylinders, measuring 150 and 100 mm diameters each, and a 65-mm diameter container for the storage of the material to be fermented, with an average volumetric capacity of 1.3 L of substrate in fermentation each. The 100-mm cylinder was inserted into the 150-mm cylinder so allow the space between the outer wall of the inner cylinder and the inner wall of the outer cylinder to hold a volume of water (“water seal”). The top end of the 100-mm diameter cylinder was closed end and had a opening for the release of biogas. It was kept immersed in the water seal to provide anaerobic conditions and to store the biogas produced, as shown by Sunada et al. (2014). The volume of biogas produced per day was determined by measuring the vertical displacement of tubes according to their cross-sectional area. The gas volume was corrected according to standard conditions for temperature and pressure.
Biogas composition was analyzed weekly to determine the volume (L) of methane produced. Biogas composition was determined using a gas chromatograph (Finnigan GC-2001, equipped with Porapack Q molecular sieve columns), and a thermal conductivity detector gas analyzer (GA-21 Plus). The production of biogas and methane were calculated
considering the volume (L) and the amount (kg) of TS and volatile solids (VS) added to the digesters.
TS and VS levels and hydrogen ionic potential (pH) were determined in the beginning (affluent) and end (effluent) of the biodigestion, according to the methodology described by APHA (2005). Neutral detergent fiber (NDF) content was measured according to the method proposed by Detmann et al.
(2012). Organic carbon contents in the substrates and effluents were estimated by the method described by Kiehl (1985), and the ether extract was determined according to the recommendations of Silva & Queiroz (2006).
The results were submitted to analysis of variance (ANOVA), considering the amounts of addition of liquid hatchery waste as a source of variation. Orthogonal contrasts were applied to evaluate linear, quadratic, and cubic effects. Calculations and analyses were carried out using the R software (version 3.1.0 for Windows).
RESULTS AND DISCUSSION
The disappearance of TS and VS presented a qua-dratic behavior (Table 3 and Figure 1), with optimal doses of liquid hatchery waste addition to cattle ma-Table 2 – Chemical composition and pH of the evaluated substrates and effluents, according to treatment.
Variables Experimental treatments (%liquid hatchery waste)
0 5 10 15 20 25 30
TS (%) 4.63 5.21 5.05 5.03 4.83 5.53 5.89
VS (% of TS) 78.05 78.90 79.74 80.59 81.44 82.29 83.14
EE (% of TS) 1.80 3.58 5.36 7.14 8.92 10.70 12.48
N (% of TS) 2.03 2.31 2.59 2.87 3.16 3.44 3.72
C (% of TS) 21.06 21.90 22.75 23.59 24.43 25.28 26.12
NDF (% of TS) 53.04 50.09 47.14 44.20 41.25 38.30 35.36
Initial pH 7.71 7.77 7.88 7.93 7.77 7.89 7.88
Final pH 7.30 7.61 7.61 7.57 7.70 7.74 7.74
Table 3 – Modelof regression, followed by r², P (probability), and CV (coefficient of variation) values, of the disappearance of total solids (TS), volatile solids (VS), and neutral detergent fiber (NDF), and biogas and methane (CH4) production during the co-digestion of the substrates prepared with cattle manure and theaddition on increasingliquid hatchery waste levels.
Evaluated parameter Regression model r² P CV
TSdisappearance (%) y = -0.0728x2+2.2601x+23.731 0.93 <0.001 4.2
VSdisappearance (%) y = -0.067x2 + 2.1414x + 31.753 0.91 <0.001 4.2
NDFdisappearance (%) y = -0.0614x²+2.7385x+22.649 0.91 <0.001 4.3
Biogas (L kg-1ofTS added) y = -0.2489x2+8.5435x+108.43 0.62 <0.001 5.4
Biogas (L kg-1ofVSadded) y = -0.2774x2+9.8434x+142.2 0.79 <0.001 5.6
CH4 (% in biogas) y = -0.049x2 + 1.650x + 54.50 0.87 <0.001 4.9
CH4 (L kg-1ofTSadded) y = -0.2004x2+7.0378x+58.354 0.82 <0.001 5.1
nure of 15.5 and 16.0%, respectively, which resulted in 41.3% and 49.6% disappearance of TS and VS in the effluents relative to the substrates. These results in-dicate better degradation of solids during biodigestion with the inclusion of liquid hatchery waste, which in-creased TS disappearance in74.0%compared with the control treatment; while VS in 56.2%. This suggests that substrate quality improved with the addition of hatchery residue, increasing substrate nutrient levels, which allowed better degradation (Table 2).
The addition of liquid hatchery waste at ratios higher than 16.0% limited TS and VS degradation (Figure 1), suggesting that the effectiveness of digestion was impaired. A possible explanation is that the lipid or nitrogen levels added to the substrate by the hatchery waste may have been excessive. The adverse effects of lipids on biodigestion were reported by Orrico et al. (2015), who used cooking oil waste for the co-digestion of pig manure, and found that oil ratios higher than 5.7% reduced the ST and SV degradation during anaerobic digestion due to the accumulation of long-chain fatty acids resulting from lipid digestion.
Markou (2015) emphasized the impact of waste containing high N levels, and consequently low C:N ratios, on biodigestion efficiency. That author recommends C:N ratios greater than 8:1 to prevent the accumulation of ammonia, which may limit the development of microbes, particularly of the methanogenic flora. Substrates containing liquid hatchery waste ratios higher than 15% of (Table 2) presented degradation rates, as shown by the lower TS disappearance.
Figure 1 – Disappearance of total solids (TS), volatile solids (VS), and neutral deter-gent fiber (NDF) during the co-digestion of cattle manure with increasing liquid hatchery waste levels.
The maximum VS degradation rates obtained in the present study were lower than those reported by El-Mashad & Zhang (2010), of 68%, when evaluating the co-digestion of cattle manure with food waste. This difference may be associated with the concentration of solids being digested. In the study by El-Mashad & Zhang (2010), TS contents in the substrates were
only 2.1%, while in the present research the waste contained concentrations between 4.6 and 5.9% TS. In addition, the level of fibrous compounds may have limited the extension of VS breakdown, since in the present study NDF levels ranged from 35.3 to 53.0%, while those reported by El-Mashad & Zhang (2010) were not higher than 26.7%.
Substrate NDF disappearance (Table 3, Figure 2) in-creased up to 22.3% of liquid hatchery waste inclusion, reaching 53.2% maximum disappearance, which cor-responds to 134.0% higher disappearance compared with the control treatment. This effective reduction of fiber in the substrates may be explained by the degra-dation of hemicellulose during biodigestion, because hemicellulose is the most available compound in NDF. In a similar study, Manarelli et al. (2014), evaluating the anaerobic co-digestion of cattle manure with cooking oil waste, obtained 49.5% NDF reduction in with an oil inclusion of 6.5%, and verified that hemicellulose frac-tion was the main component of the degraded fiber.
The degradation of organic material produces biogas, which volume depends on the degradation of solids. Hatchery liquid waste ratios of up to 17% increased biogas production (Figure 2), corresponding to 181.7 and 229.5 L kg-1 of TS and VS addition. These
values were 67.5 and 61.39% higher than those obtained in biodigester containing no hatchery liquid waste.
Figure 2 – Specific biogas production as a function ofTSandVS addition tosubstrates-consisting of cattle manure and increasing liquid hatchery waste levels.
the present study. This difference is may be due to the lower proportion of cattle manure used by Zhang et al. (2013), rendering the substrate more accessible to degradation.
The time biogas starts to be produced determines the substrate residence time in the biodigesters. Its determination is essential to plan the use of biodigesters under field conditions, with the aim of optimizing the volume of waste treated as a function of time. The experimental results (Figure 3) show that the time of biogas started to be produced was anticipated and biogas production increased with the increase of liquid hatchery waste inclusion levels in the substrate. In the 5th week of the retention of the
substrates in the biodigesters, total biogas production was 39.2% for the substrate with no liquid hatchery waste inclusion and 46.4, 52.2, 54.3, 58.5, 58.8, and 59.9% in the biodigester with substrates containing 5, 10, 15, 20, 25, and 30% of liquid hatchery waste, respectively.
Figure 3 – Time distribution of biogas production by substratesconsisting of cattle manure and increasing liquid hatchery waste levels.
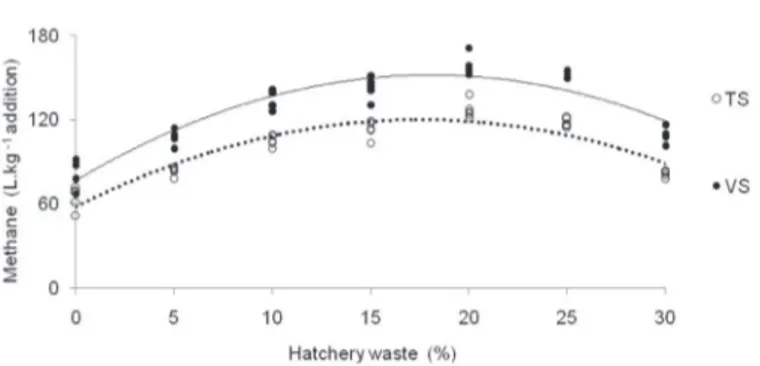
In addition to biogas production, methane concentration is also an important factor to be considered due to the energy potential of this gas. The highest specific methane productions (Figure 4) were obtained with17.5 and 18% liquid hatchery waste inclusion ratios at120.1 and 151.8 L. CH4 kg-1 of TS
and VS addition, respectively, corresponding to 105 and 97.6% higher methane production compared with the control treatment (with no liquid hatchery waste inclusion). This indicates that the inclusion of more available nutrients in the digestion environment by the addition of the liquid hatchery waste favored the fermentation of the substrate.
The pH values of the substrates (Table 2) show that the pH of the effluents were slightly alkaline, and consequently did not limit the activity of the methanogenic microorganisms.
Figure 4 – Methane specific production as a function of TS and VS addition to substra-tesconsisting of cattle manure and increasing liquid hatchery waste levels.
Orrico Junior et al. (2015) evaluated the anaerobic co-digestion of sheep manure with crude glycerin, which is a readily-available energy source. Those authors obtained 440.0L of methane/kg VS addtion with 6% glycerin inclusion in the substrate. This methane volume is higher than that verified in the current study, probably due to the high energy levels of crude glycerin and of the manure, because the sheep were fed high levels of a concentrate. In the study of Orrico Junior et al. (2015), a maximum methane content of 83.8% was achieved the inclusion of 11.73% crude glycerin, with a calorific value of 30,960 KJ m-3 of biogas, which was 13.16% higher
than that of the biogas generated by the substrate with no crude glycerin inclusion. That calorific value was calculated using the equations proposed by Mitzaff (1998), which can be applied to the results obtained in the present study. Considering the methane ratio in the biogas obtained in the control treatment (54.5%), and the maximum methane ratio of 68.4% obtained with 16.8% hatchery liquid waste inclusion (regression model shown in Table 3), calorific values of 18,519 and 23,242 kJ m-3 of biogas were
calculated for inclusions of 0 and 16.8% of liquid hatchery waste, respectively. This result indicates that the substrate with 16.8% of liquid hatchery waste produced 25.5% more methane.
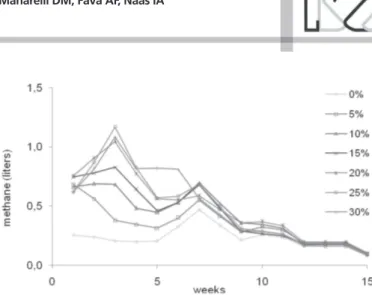
The distribution of methane production (Figure 5) as a function of time is consistent with the distribution of biogas production, indicating that the addition of liquid hatchery waste to cattle manure allowed higher methane production.
Figure 5 – Time distribution of methane production by substrates consisting of cattle manure and increasing liquid hatchery waste levels
CONCLUSIONS
The anaerobic co-digestion cattle manure with inclusion of up to 15.5% liquid hatchery waste increases the degradation of solids and fibrous compounds in the substrate, and the production of biogas and methane. The inclusion of any dose of liquid hatchery waste to cattle manure submitted to anaerobic digestion anticipated the production of biogas and methane, which achieved higher volumes at shorter digestion times.
ACKNOWLEDGEMENTS
This research was carried out with financial support of the Federal University of Grande Dourados (UFGD) and of the research support agency Fundação de Apoio ao Desenvolvimento do Ensino, Ciência e Tecnologia
do Estado de Mato Grosso do Sul (Fundect). The
authors also thank the Higher Education Personnel Improvement Coordination (Capes) for the M.Sc. grant given to the first author.
REFERENCES
APHA - American Public Health Association. Standard methods for the examination of water and wastewater. 21th ed. Washington: American Public Health Association; 2005.
Aggarangsi P, Tippayawong N, Moran JC, Rerkkriangkrai P. Overview of livestock biogas technology development and implementation in Thailand. Energy Sustainable Development 2013;17:371–377.
Araújo, WAG, Albino, LFT. Commercial incubation (incubação comercial). Kerala: Transworld Research Netword; 2011. p.157.
Carvalho SMM, Barros MR, Bastos FJF. Resíduos na produção de frangos de corte: Incubatório. Anais do 3º Simpósio Internacional sobre Gerenciamento de Resíduos Agropecuários e Agroindustriais; 2013; São Pedro, São Paulo. Brasil: SBERA; 2013.
Detmann E, Souza, MA, Valadares Filho SC, Queiroz AC de, Berchielli TT, Saliba EOS, et al. Métodos para análise de alimentos. Visconde do Rio Branco: Suprema; 2012.
El-Mashad HM, Zhang R. Biogas production from co-digestion of dairy manure and food waste. Bioresource Technology 2010;101:4021-4028 [cited 2014 Oct 07]. Available from: http://www.sciencedirect. com/science/article/pii/S0960852410000842.
Glatz P, Miao Z, Rodda B. Handling and treatment of poultry hatchery waste: a review. Sustainability 2011;3:216-237.
Hunter Long J, Aziz TN, Reyes III FL, Ducoste JJ. Anaerobic co-digestion of fat, oil, and grease (FOG): A review of gas production and process limitations. Process Safety and Environmental Protection 2012;9:231– 245 [cited 2014 Oct 07]. Available from: http://www.sciencedirect. com/science/article/pii/S0957582011001054.
Kiehl EJ. Fertilizantes orgânicos. 5.ed. São Paulo: Agronômica Ceres; 1985. 492p.
Kobashigawa E, Murarolli RA, Gameiro AH. Destino de resíduos de incubatórios da avicultura no estado de São Paulo: adequação à legislação e possibilidade de uso econômico. Anais do 46º Congresso da Sociedade Brasileira de Economia, Administração e Sociologia Rural; 2008. Rio Branco, Acre. Brasil: SOBER, 2008.
Manarelli DM, Orrico ACA, Orrico Jr MAP, Lopes WRT, Fava AF, Castro AN. Reduções de constituintes físicos e coliformes durante a co-digestão anaeróbia dos dejetos de bovinos leiteiros e diferentes níveis de óleo de descarte. Anais do 13º Encontro de Ensino, Pesquisa e Extensão; 2014 Out 20-23. Presidente Prudente, São Paulo. Brasil: Sociedade, Equidade e Sustentabilidade; 2014.
Markou G. Improved anaerobic digestion performance and biogas production from poultry litter after lowering its nitrogen content. Bioresource Technology 2015;196:726-730.
Mata-Alvarez J, Dosta J, Romero-Güiza MS, Fonoll X, Peces M, Astals S. A critical review on anaerobic co-digestion achievements between 2010 and 2013. Renewable and Sustainable Energy Reviews 2014;36:412-427.
Nuchdang S, Phalakornkule C. Anaerobic digestion of glycerol and co-digestion of glycerol and pig manure. Journal Environmental Management 2012;101:164-172.
Orrico ACA, Sunada NS, Lucas Jr J, Orrico Jr MAP, Schwingel AW. Co-digestão anaeróbia de dejetos de suínos e níveis de inclusão de óleo de descarte. Revista Engenharia Agrícola 2015;35(4):657-664.
Orrico Junior MAP, Orrico ACA. Quantification, characterization, and anaerobic digestion of sheep manure: the influence of diet and addition of crude glycerin. Environmental Progress Sustainable Energy 2015;34:1038-1043.
Silva, D.J.; Queiroz, A.C. Análise de alimentos: métodos químicos e biológicos. 3.ed. Viçosa: Editora Universitária. 2006. 166 p.
Sunada NS, Lucas Junior J, Orrico ACA, Orrico Junior MAP, Schwingel AW, Costa MSSM. Addition of lipolytic enzyme in anaerobic co-digestion of swine manure and inclusion levels of waste vegetable oil. International Journal of Agricultural Policy and Research 2014;2:468-474.