Recebido para publicação em 19/12/2008 Aceito para publicação em 16/5/2009 (004002)
1 Departamento deCiência de Alimentos, Faculdade de Engenharia de Alimentos, Universidade Estadual de Campinas – UNICAMP, CEP 13083-970, Campinas - SP, Brasil 2 Departamento de Engenharia de Alimentos, Faculdade de Zootecnia e Engenharia de Alimentos, Universidade de São Paulo – USP, CEP 13635-900, Pirassununga - SP, Brasil,
E-mail: [email protected]
*A quem a correspondência deve ser enviada
A method to determine volatile contaminants in polyethylene terephthalate (PET)
packages by HDC-GC-FID and its application to post-consumer materials
Determinação de contaminantes voláteis em embalagens de polietileno tereftalato (PET)
por CDEL-CG-DIC e sua aplicação a materiais pós-consumo
Samanta FABRIS1, Maria Teresa de Alvarenga FREIRE2*, Roger WAGNER1, Felix Guillermo REYES1
1 Introduction
The increase in production of solid urban residue is a worldwide reality, and it depends on the population size and local economic development. In recent years, the concern about the increase in plastic-based residues has received greater attention. As a result, the recycling of plastic materials discarded in urban and residential areas has gained support throughout the world, especially from entities concerned about environmental preservation.
Among the plastic packaging materials available on the consumer market, PET (polyethylene terephthalate) is one of the most widely applied polymers (INTERNATIONAL..., 2000; FREIRE; REYES, 1997).
With regard to the recycling process for subsequent use of the recycled material in food packaging, one must consider not only contamination of the packages by chemical compounds coming from the packaged food, for example, fruit juice aromas, but also substances resulting from the inappropriate use of the package by the consumer before discarding it (BAYER, 2002). The presence
of intrinsic contaminants from the recycling process, such as chemical additives and their degradation products, should be equally considered because the conventional recycling processes occur at high temperatures (WIDÉN; LEUFVÉN; NIELSEN, 2004). Thus one must ensure that the recovered material, when destined to come into contact with food, shows the same characteristics presented by the virgin material approved by regulatory agencies (KUZNESOF; VANDERVEER, 1995).
The application of recycled plastics for contact with food has become possible on account of the development of decontamination technologies. The main processes commonly applied to PET packaging include conventional washing and super washing. Conventional washing involves only selecting, grinding, washing, and drying of the PET flakes. The super washing process involves the conventional process followed by steps of deep cleaning that include washing the bottles with hot chemical agents such as sodium hydroxide and detergents, followed by drying of the material (FRANZ; MAUER; WELLE,
Resumo
Um método simples e de baixo custo foi desenvolvido e validado para a determinação de contaminantes voláteis em flakes de PET pós-consumo reciclado por Concentração Dinâmica do Espaço Livre e Cromatografia em fase Gasosa com Detecção por Ionização de Chama (CDEL-CG-DIC). Os parâmetros analíticos avaliados pelo uso de substâncias modelo incluíram: coeficiente de correlação, limite de detecção, limite de quantificação, exatidão, precisão intra-ensaio e inter-ensaio. Com o objetivo de comparar a eficiência do método proposto com técnicas automáticas reconhecidas, amostras de embalagens PET pós-consumo coletadas no Brasil foram utilizadas. CG-EMS foi utilizada para a confirmação da identificação das substâncias identificadas no PET. Alguns dos contaminantes identificados foram estimados quantitativamente no material pós-consumo em concentrações superiores a 220 ng.g-1. Os resultados obtidos neste trabalho corroboram os dados disponíveis na literatura científica, evidenciando a adequação do método analítico proposto.
Palavras-chave: extração; validação; cromatografia gasosa; PET.
Abstract
A simple and low cost method to determine volatile contaminants in post-consumer recycled PET flakes was developed and validated by Headspace Dynamic Concentration and Gas Chromatography-Flame Ionization Detection (HDC-GC-FID). The analytical parameters evaluated by using surrogates include: correlation coefficient, detection limit, quantification limit, accuracy, intra-assay precision, and inter-assay precision. In order to compare the efficiency of the proposed method to recognized automated techniques, post-consumer PET packaging samples collected in Brazil were used. GC-MS was used to confirm the identity of the substances identified in the PET packaging. Some of the identified contaminants were estimated in the post-consumer material at concentrations higher than 220 ng.g-1. The findings in this work corroborate data available in the scientific literature pointing out the suitability of the proposed analytical method.
Keywords: extraction; validation; gas chromatography; PET packaging.
Considering the limited analytical resources available in developing countries, constraints and barriers faced by those countries should be considered when developing and validating analytical methods, especially when requirements are not practical for their needs. International organizations that provide guidelines related to the validation of analytical methods for food control emphasize the importance of establishing practical and cost effective methods. However, methods of analysis should only be recommended if their reliability and performance has been recognized (FOOD..., 1998).
Considering the importance of packaging recycling in food safety, the aim of this work was to develop and validate a simple and low cost analytical method to determine the volatile contaminants from conventionally cleaned up post-consumer PET packaging collected from landfills. For this purpose, dynamic headspace concentration for the extraction step, and chromatographic techniques (GC-FID and GC-MS) for separation, identification, and quantification steps were used. The method efficiency was evaluated using post-consumer PET flakes obtained from two different washing regimes widely applied in Brazil.
2 Material and methods
2.1 Chemicals
Toluene (99.9% pure), chlorobenzene (99% pure), benzaldehyde (99% pure), and linalool (98% pure), all from Merck (Germany); and (R) - (+) – limonene (97% pure) from Sigma-Aldrich (USA), n-hexane (HPLC grade, 98% pure) from Merck (Germany).
2.2 Samples
Samples of virgin PET bottles were supplied by Engepack
Embalagens S.A., São Paulo - SP, Brazil. Samples of post-consumer PET were supplied by a Brazilian recycling company in the State of São Paulo and consisted of samples submitted to washing with water (Washing Regime 1: samples A, B, and C) and of samples submitted to Washing Regime 1 followed by processing stages that included: washing of the flakes with hot sodium hydroxide and detergents and washing by friction and drying of the material (Washing Regime 2: Samples A1, B1, and
C1). All samples were ground in a Marconi model MA580 mill
(Brazil) to a granule size below 20 mesh (850 µm).
2.3 Extraction process
The volatile contaminants were extracted using a modification of the dynamic headspace concentration technique described by Franco and Rodriguez (1983). Figure 1 shows the system used to obtain the extracts. Twenty-eight grams of sample, corresponding to the weight of a 510 mL PET bottle, were placed in a 250 mL flask. The trap, containing 100 mg Tenax TA 60/80 mesh (Supelco, USA), was connected to the flask exit and placed in a cooling bath at –10 ± 3 °C. The analytical conditions were: reduced pressure of 14.6 kPa (11 cmHg), temperature of 155 °C (± 5 °C), and 90 minutes of extraction. The volatile substances trapped on the Tenax were eluted using enough n-hexane to reach a volume of 1.5 mL, and then added directly to 2 mL flasks together with 30 µL of 17.4 µg.L-1 linalool (internal standard).
2004; TRIANTAFYLLOU et al., 2002). Some companies even apply an additional cleaning by friction, consisting of a rinsing of the flakes after the hot washing step, in a process in which the material suffers considerable abrasion (flake against flake), eliminating the majority of the contaminants. Modern super washing methods include a final extrusion step followed by Solid State Post-condensation (SSP) that increases the intrinsic viscosity of the polymer and also promotes its decontamination since the material is submitted to high temperatures (ca. 225 °C) and high vacuum in this step (FRANZ; MAUER; WELLE, 2004; FRANZ; WELLE, 2002). After this last process, the recycled product is comparable to the virgin material, and its application in packaging for direct contact with foods can be considered viable. However, despite the positive results obtained with this technology, in Brazil its application to post-consumer PET bottles has been questioned. This questioning is based on the different characteristics of post-consumer materials in Brazil, where there is no efficient selective collection system, and the majority of the post-consumer material is directed to large-scale municipal rubbish dumps.
Consequently, it is important to evaluate the chemical quality of recycled materials (NIELSEN; DAMANT; CASTLE, 1997; SADLER, 1995), and thus there is a need to develop and apply analytical methods to determine contaminants coming from virgin and recycled packaging in order to help manage consumer health risks.
The techniques for the extraction of the volatile compounds absorbed by the packaging material include the use of solvents, concentration of the extract, and subsequent determination by Gas Chromatography (GC) using a flame ionisation (FID) or Mass Spectrometry (MS) detector (LEBOSSÉ; DUCRUET; FEIGENBAUM, 1997; PAIK, 1992; REYNIER et al., 2004; FREIRE et al., 1998; KALJURAND; SMIT, 1994; WIDÉN; LEUFVÉN; NIELSEN, 2005). Currently, the most used extraction systems involve headspace analysis. There are many variations to this analytical technique such as the direct analysis of the headspace, and static and dynamic concentration of the headspace using traps consisting of porous polymers, especially tenax (FRANZ; MAUER; WELLE, 2004; van WILLIGE et al., 2003; KALJURAND; SMIT, 1994; HAKKARAINEN; GRONING; ALBERTSSON, 2003; SOTO-VALDEZ; GRAMSHAW; VANDENGURG, 1997; WIDÉN; LEUFVÉN; NIELSEN, 2005; NONGONIERMA et al., 2006). Recent advances include automatic systems that allow the coupling of the headspace sampler to the gas chromatograph injector, known as the purge and trap injection system (LEBOSSÉ; DUCRUET; FEIGENBAUM, 1997; WEZL; LANKMAYR, 2002; REYNIER et al., 2004; VILLBERG; VEIJANEN; GUSTAFSSON, 1998; KALJURAND; SMIT, 1994). The solid phase micro-extraction system is a recent modification introduced for the analysis of matrixes such as packaging materials (ZHANG; PAWLISZYN, 1993; EZQUERRO; PONS; TENA, 2003; PAWLISZYN, 1997).
289, and 78 mg.kg-1 for limonene. The Limit Of Detection (LOD)
and Limit Of Quantification (LOQ) for each model substance were calculated according to Miller and Miller (1993) using the following expressions: LOD=3sy/x/m and LOQ=10 sy/x/m, where sy/x is the standard deviation and m the slope of the analytical curve, respectively.
The intra-assay precision of the method, expressed as the relative standard deviation (% RSD) of peak-area measurement (n = 3) was evaluated from the results obtained over one day under the same conditions using the solutions of each model substance at three different concentrations as follows: 1.2xLOQ, 2xLOQ, and 5xLOQ. The inter-assay precision was determined for these same concentrations on 3 different days, also expressed as % RSD.
The selectivity was evaluated comparing the chromatograms of the extracts obtained for the matrix without the substance of interest to those obtained for the matrix for each model substances added. The accuracy of the method was determined from the recovery of the nine extractions from a single concentration on different days for each model substance, expressed as a percentage of recovery.
2.6 Statistical analysis
The SIMCA – P software (v. 11.0, Umetrics, Umea, Sweden) was used for the statistical evaluation of the data at the optimisation step, under the extraction conditions, for the
principle component analysis using the Loading Column Plot.
To construct the analytical curves and obtain the data for validation, the programme GraphPad Software, version 2.01 was used.
3 Results and discussion
3.1 Choice of the model substances
In the present study, toluene, chlorobenzene, benzaldehyde, and limonene were chosen as the model substances to represent the volatile contaminants. Thus, according to the US-FDA 2006 protocol, toluene and chlorobenzene were selected to represent the non-polar volatile substances, and benzaldehyde and limonene to represent the flavour compounds, which are frequently determined in post-consumer analyses. The presence of benzaldehyde in recycled PET packages has been reported by various authors, and is also considered as a flavour compound (BAYER, 2002; NIELSEN; DAMANT; CASTLE, 1995; NERÍN et al., 2003).
3.2 Optimisation of the chromatographic conditions
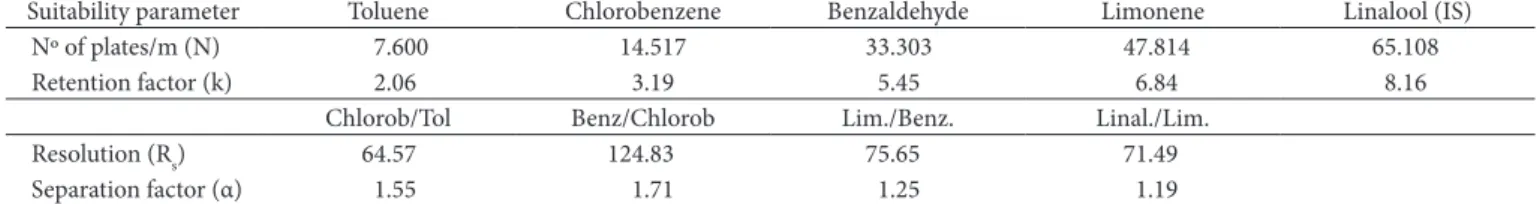
Due to the complexity of the samples, the first phase of the present study was based on the determination of the optimal conditions for the chromatographic analysis. In order to develop the chromatographic method, the system suitability parameters [No of plates/m (N), retention factor (k), resolution
(Rs) and separation factor (α)] were considered and calculated according to Bruce, Minkkinen and Riekkola (1998). The results are shown in Table 1.
2.4 Equipment
GC/FID (Gas Chromatograph with Flame Ionisation Detector)
A Varian model 3400 gas chromatograph was used with a model 1075 split/splitless injector, DB-5 (J & W Scientific,
USA) 60 m × 0.32 mm i.d. × 0.25 µm column. The operating
conditions were as follows: carrier gas (N2) at a constant pressure of 20 psi and flow rate of 1.3 mL/minute (at the oven temperature of 100 °C); injector temperature of 250 °C; detector temperature of 300 °C; and splitless time of 0.75 minutes. The injection volume was 2 µL. The initial oven temperature was 40 °C, held for 8 minutes, followed by heating to 130 °C at 3 °C/ minute, held for 1 minute, then heated from 130 to 250 °C at 6 °C/minute, and held for 5 minutes.
GC-MS (Gas Chromatograph coupled to a Mass Spectrometer)
A Shimadzu QP5000 system with a mass-range from 35 to 450 m/z, equipped with a (60 m × 0.32 mm i.d. × 0.25) DB-5 column (J & W Scientific, USA), was used. The GC operational conditions were as follows: carrier gas (He) at a constant pressure of 69.6 kPa and flow rate of 1.3 mL/minute (at the oven temperature of 100 °C); injector and detector temperatures of 250 °C; and splitless time of 0.75 minutes. The injection volume was 2 µL. The initial oven temperature was 40 °C, held for 8 minutes, followed by heating to 130 °C at 3 °C/minute, held for 1 minute, then heated from 130 to 250 °C at 6 °C/minute, and held for 5 minutes.
2.5 Method validation
The method was in-house validated according to the
following criteria: linearity and linear range, sensitivity, selectivity, intra-assay and inter-assay precision, detection and quantification limits, and accuracy (LIN et al., 1997; RIBANI et al., 2004).
The linearity, linear range, sensitivity and detection and quantification limits were established using the analytical curve from triplicate analyses of four model substances (toluene, chlorobenzene, benzaldehyd, and limonene) at five concentrations: 36, 83, 155, 298, and 597 mg.kg-1 for toluene;
34, 80, 148, 285, and 571 mg.kg-1 for chlorobenzene; 16, 32, 76,
140, 270, and 540 mg.kg-1 for benzaldehyde and 17, 35, 81, 150,
Figure 1. Dynamic headspace concentration extraction system with
Based on these results, a temperature of 155 °C was selected and the extraction time varied to evaluate the recovery levels of the model substances. Figure 3 shows the recovery profiles at 4 different times: 30, 60, 90, and 120 minutes.
The loading column plot of the data presented in Figure 3 indicated that the best condition for extracting the volatile contaminants was 155 °C for 90 minutes showing a percent recovery above 89% for all the substances evaluated.
3.4 Validation of the analytical method
Recognised protocols recommend the use of Certified Reference Materials (CRM) for quality control methods in order to obtain reliable recovery results in the validation process (BRUCE; MINKKINEN; RIEKKOLA, 1998). In the case of dynamic headspace extraction methods, the analytes would have to be introduced into the material, e.g., by spiking during the preform production. Nonetheless, such CRM is not available. Considering the lack of an appropriate CRM, the proposed method was carried out spiking the surrogates in the PET flakes. The validation parameters of the method, determined for each of the model substances, are shown in Table 2.
The method covers a large range for the analytical curve of the model compounds used in this study and, consequently, Since many different classes of volatile contaminants with
different polarities could be present in the post-consumer plastic material, the chromatographic conditions were established to obtain good resolution between toluene, chlorobenzene, benzaldehyde, limonene, and linalool (internal standard).
With respect to the retention (k) and separation (α) factors, all results were within the values recommended in the literature (k > 2 and 1.05 < α <2.0, respectively). On the other hand, for quantification, a minimum resolution of 1 between the two closest peaks is recommended, and all the results were within
this value (Rs > 1) (BRUCE; MINKKINEN; RIEKKOLA, 1998).
These parameters indicated adequate separation and resolution of the model contaminants under the established conditions.
Figure 2 shows a typical chromatographic profile obtained by GC/FID for the recycled PET flakes.
3.3 Optimisation of the chromatographic conditions
Preliminary trials for the extraction of the volatiles demonstrated that the use of temperatures above 170 °C caused colour changes (yellow) in the packaging material, indicating undesirable polymer degradation. Under these conditions, an equal accentuated degradation of limonene was shown, demonstrated by the low recovery levels found.
Table 1. Suitability parameters of the chromatographic system.
Suitability parameter Toluene Chlorobenzene Benzaldehyde Limonene Linalool (IS)
Nº of plates/m (N) 7.600 14.517 33.303 47.814 65.108
Retention factor (k) 2.06 3.19 5.45 6.84 8.16
Chlorob/Tol Benz/Chlorob Lim./Benz. Linal./Lim.
Resolution (Rs) 64.57 124.83 75.65 71.49
Separation factor (α) 1.55 1.71 1.25 1.19
Table 2. Validation parameters to determine the volatile contaminants by dynamic headspace concentration – GC/FID.
Validation parameters Toluene Chlorobenzene Benzaldehyde Limonene
Equation of the analytical curve y = 0.1556x + 0,0644 y = 0.1106x + 0,0583 y = 0.1129x + 0,0817 y = 0.1488x + 0,0353 Linear work range
(µg.kg-1)
40 to 600 35 to 570 20 to 540 20 to 580
Linearitya 0.9994 0.9997 0.9999 0.9999
Sensibility (u.a.ng-1) 0.1556 0.1106 0.1129 0.1488
Concentration (µg.kg-1)b
72 119 298 72 119 297 30 49 122 31 51 127
Intra-assay precision 1 (% RSD, n = 3)
3.8 6.3 7.8 9.3 1.6 9.1 8.5 4.7 8.0 4.5 4.5 17.7
Intra-assay precision 2 (%RSD, n = 3)
6.6 13.1 13.4 8.9 13.5 7.7 7.8 4.5 5.2 14.1 6.8 6.1
Intra-assay precision 3 (%RSD, n = 3)
5.4 5.6 5.9 1.3 3.5 2.9 0.6 2.0 0.2 4.9 19.6 2.3
Inter-assays precision (%RSD, n = 9)
9.4 11.6 9.6 17.8 11.7 6.2 6.3 5.8 6.5 9.5 14.3 11.3
Recovery n = 9 (%)c 105.4 119.0 90.3 80.5 105.6 91.8 115.5 110.3 108.3 109.8 112.5 95.8
Detection limits (µg.kg-1)d 15 10 7 7
Quantitation limits (µg.kg-1)d 40 35 20 20
aLinearity expressed as the linear correlation coefficient of the analytical curve. bConcentrations calculated based on 1.2× LQ / 2× LQ / 5× LQ, considering that the subsequent assays
would be carried out with 28 g PET (weight representing one 510 mL bottle). cRecovery was determined in samples of fortified virgin PET; dThe detection and quantitation limits
In general, both the intra and inter-assay precisions were below 15% (Table 2). According to Huber (1998), in analytical methods for trace substances and impurities, RSD values of up to 20% are acceptable, depending on the sample complexity.
The accuracy of the method was evaluated using recovery tests for the model substances. Acceptable recovery intervals for the analysis of residues are generally between 70 and 120% with RSD values of up to ± 20% (HUBER, 1998). Thus, the recovery values obtained for toluene (90-119%), chlorobenzene (80-105%), benzaldehyde (108-115%) and limonene (96-112%) demonstrated adequate accuracy of the method.
3.5 Analysis of the market samples – identification
The samples tested were post-consumer PET flakes submitted to two washing regimes: Washing Regime 1 (samples A, B, and C) and Washing Regime 2 (samples A1, B1, C1).
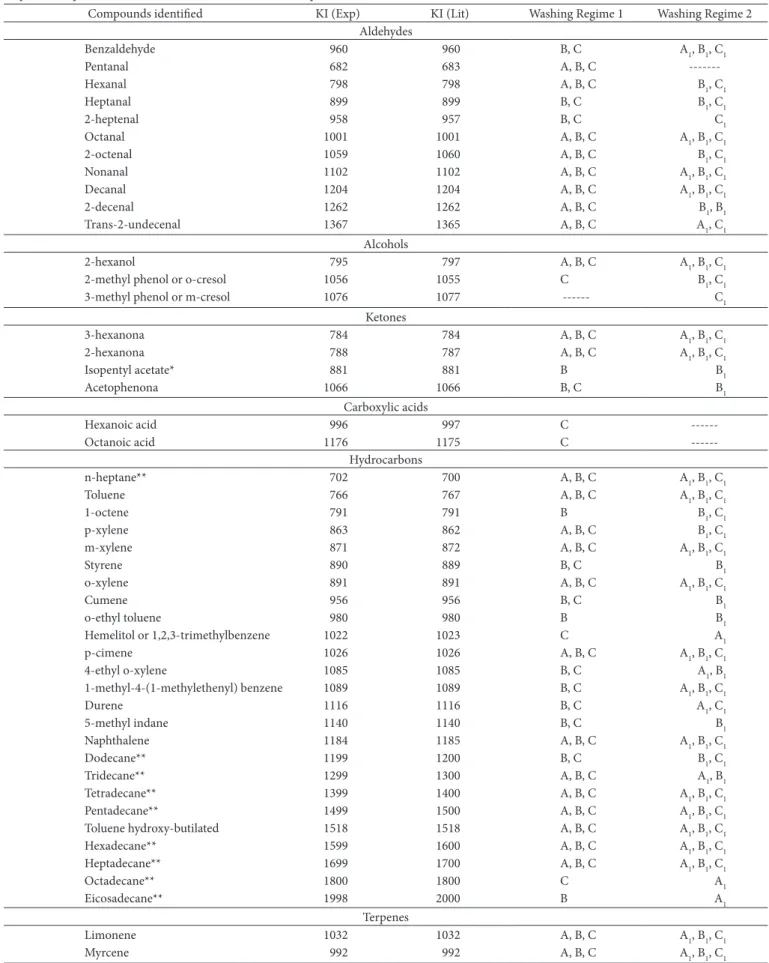
In all samples analysed by GC-MS, 47 volatile compounds with molecular masses from 86 to 282 daltons were tentatively identified. These compounds were mainly aldehydes and hydrocarbons (alkanes). Table 3 presents the volatile compounds identified in the post-consumer PET packaging submitted to the two washing regimes. To corroborate the identity of each of the compounds identified by GC-MS, the experimental Kovats Index values and those obtained by other authors and reported in the National Institute of Standards and TechnologyChemistry Webbook (NATIONAL..., 2005) are also included in Table 2.
As reported by Dzieciol and Trzeszczynski (2000), PET is subjected to temperatures in the range from 200 to 300 °C under vacuum, nitrogen, or air in the production, processing, and recycling steps. These conditions result in degradation reactions that generate changes in the properties of the polymers (for example, reduction in the molecular mass and intrinsic viscosity and yellowing) and the emission of volatile substances. These substances, produced during the heat degradation of PET, include carbon monoxide, aldehydes (acetaldehyde, formaldehyde, and benzaldehyde), C1 – C4 aliphatic hydrocarbons, aromatic hydrocarbons (benzene, toluene, ethylbenzene, and styrene), esters (vinyl benzene, methyl acetate), acetophenone, methanol and 2-methyl-1,3-dioxolane. At low temperatures, the main degradation products are acetaldehyde, formaldehyde, and carbon monoxide, and the concentrations of carbon monoxide, aromatic and aliphatic hydrocarbons, and methyl acetate increase with temperature (DZIECIOL; ZIECIOL; TRZESZCZYNSKI, 1998). Thus, some of the compounds identified in the present study could have been formed during PET degradation reactions.
Other sources of contamination should also be considered. Recently and Widén, Leufvén and Nielsen (2005) identified substances they believe came from recycled packaging material. The authors suggested three possible sources of contamination: 1) misuse of the package by the consumer, 2) food products (fermented and fortified alcoholic beverages), and 3) non-food products (petroleum products, detergents, and cleaning products, compounds containing ethers, and unknown products), apart from other compounds resulting from the deterioration of the original product and storage in an inappropriate place.
allowed estimation of the concentrations of the contaminants in the samples evaluated. The results show a reliable proportionality between the analyte concentration and the corresponding areas of the chromatographic peaks in the concentration range evaluated.
Selectivity was evaluated for each model substance by comparing the chromatographic signal at the retention time of each analyte for an extract from the matrix of a virgin bottle to an extract of a matrix containing the contaminant. No interfering substance eluted at the same retention time of any model substances. Good resolution was obtained between the peaks for the entire chromatogram (Figure 2).
The maximum level of residual contaminants considered negligible by the US-FDA (2008) for recycled PET for use in contact with foods is 220 µg.kg-1. The method developed
proved suitably sensitive because the quantification limits for the model substances were an order of magnitude lower than FDA’s acceptable contamination limit (Table 2).
Figure 2. Chromatographic profile of (1) toluene, (2) chlorobenzene,
(3) benzaldehyde, (4) limonene and (5) linalool (tr1 7.4 minutes, tr2 10.6 minutes, tr3 16.4 minutes, tr4 20.3 minutes, tr5 24.2 minutes, respectively). Chromatographic conditions: 60 m × 0.32 mm i.d. × 0.25 μm DB-5 column, nitrogen as the carrier gas, injector temperature of 250 °C, detector temperature of 300 °C, and temperature programme of 40 °C/8 minute to 130 °C/1 minute, 3 °C/minute; and of 130 °C/1 minute to 250 °C/5 minute, 6 °C/minute.
Table 3. Compounds tentatively identified by GC-MS in post-consumer PET samples submitted to two different washing regimes and their respective experimental Kovats index values and those reported in the literature.
Compounds identified KI (Exp) KI (Lit) Washing Regime 1 Washing Regime 2
Aldehydes
Benzaldehyde 960 960 B, C A1, B1, C1
Pentanal 682 683 A, B, C
---Hexanal 798 798 A, B, C B1, C1
Heptanal 899 899 B, C B1, C1
2-heptenal 958 957 B, C C1
Octanal 1001 1001 A, B, C A1, B1, C1
2-octenal 1059 1060 A, B, C B1, C1
Nonanal 1102 1102 A, B, C A1, B1, C1
Decanal 1204 1204 A, B, C A1, B1, C1
2-decenal 1262 1262 A, B, C B1, B1
Trans-2-undecenal 1367 1365 A, B, C A1, C1
Alcohols
2-hexanol 795 797 A, B, C A1, B1, C1
2-methyl phenol or o-cresol 1056 1055 C B1, C1
3-methyl phenol or m-cresol 1076 1077 --- C1
Ketones
3-hexanona 784 784 A, B, C A1, B1, C1
2-hexanona 788 787 A, B, C A1, B1, C1
Isopentyl acetate* 881 881 B B1
Acetophenona 1066 1066 B, C B1
Carboxylic acids
Hexanoic acid 996 997 C
---Octanoic acid 1176 1175 C
---Hydrocarbons
n-heptane** 702 700 A, B, C A1, B1, C1
Toluene 766 767 A, B, C A1, B1, C1
1-octene 791 791 B B1, C1
p-xylene 863 862 A, B, C B1, C1
m-xylene 871 872 A, B, C A1, B1, C1
Styrene 890 889 B, C B1
o-xylene 891 891 A, B, C A1, B1, C1
Cumene 956 956 B, C B1
o-ethyl toluene 980 980 B B1
Hemelitol or 1,2,3-trimethylbenzene 1022 1023 C A1
p-cimene 1026 1026 A, B, C A1, B1, C1
4-ethyl o-xylene 1085 1085 B, C A1, B1
1-methyl-4-(1-methylethenyl) benzene 1089 1089 B, C A1, B1, C1
Durene 1116 1116 B, C A1, C1
5-methyl indane 1140 1140 B, C B1
Naphthalene 1184 1185 A, B, C A1, B1, C1
Dodecane** 1199 1200 B, C B1, C1
Tridecane** 1299 1300 A, B, C A1, B1
Tetradecane** 1399 1400 A, B, C A1, B1, C1
Pentadecane** 1499 1500 A, B, C A1, B1, C1
Toluene hydroxy-butilated 1518 1518 A, B, C A1, B1, C1
Hexadecane** 1599 1600 A, B, C A1, B1, C1
Heptadecane** 1699 1700 A, B, C A1, B1, C1
Octadecane** 1800 1800 C A1
Eicosadecane** 1998 2000 B A1
Terpenes
Limonene 1032 1032 A, B, C A1, B1, C1
Myrcene 992 992 A, B, C A1, B1, C1
Table 4. Concentration of the contaminants in µg.kg-1 PET after washing processes.
Contaminant Quantitation range (µg.kg-1) Comments
Washing Regime 1 Washing Regime 2
A B C A1 B1 C1
Aldehydes
Hexanal1 136 346 2356 NQ 197 178 Food flavouring agent; used also in the production of plasticisers, rubbers, dyes, plastic resins and insecticides.
Octanal4 NQ NQ 423 164 NQ 28 Synthetic flavour chemical
Nonanal4 76 131 NQ NQ NQ 116 Oily liquid with fruity odour-flavour chemical
Alcohols
2-methyl phenol or o-cresol4 138 173 327 ND ND ND Organic intermediates in the manufacture of resins and phenolic plasticisers and epoxides: antioxidants in herbicides, rubbers and plastics; odour intensifiers and deodorants, cleaning compounds,
adhesives, disinfectants and wood preservers 3-methyl phenol or m-cresol4 NQ NQ 852 NQ NQ 91
Carboxylic acids
Octanoic acid4 ND ND ND NQ NQ 108 Intermediate in the production of esters. Used in fragrances, in dye-producing processes, and in the production of antiseptic
substances Hydrocarbons
Toluene1 455 15941 597 220 6512 275 Commonly used in the solvent industry in the manufacture of paints, rubbers, chemical products and pharmaceutical
compoun-ds. Also added to gasoline and used in the production of benzene p-xylene2 169 4059 422 NQ 3009 NQ Generally used as industrial solvents, in typography and in the
rubber and leather industries. P-xylene is used as the raw material in the production of terephthalic acid, the monomer used to produce the polymers (e.g. PET bottles for soft drinks). Used as
cleaning agents for steel, and as pesticides, paint removers and in paints and varnishes in general. Xylene is widely used in the
production of phthalic anhydride.
m-xylene2 266 3661 1712 114 3237 265
4-ethyl o-xylene4 NQ NQ 281 NQ NQ 130
Styrene2 NQ 800 592 NQ 689 113 Monomer of polystyrene, commonly produced during pyrolysis of the polymer. Used as cross-linking agent.
Cumene3 NQ 357 182 ND ND ND Constituent of crude petroleum and refined fuel. Liberated into the environment as result of the production of petroleum pro-ducts and during refining, evaporation and combustion processes. Hemelitol or 1,2,3-trimethylbenzene4 200 430 234 99 322 NQ Prepared from petroleum and coal tar and used as a solvent for
resins, gums and nitrocellulose. Also used as an intermediary in the manufacture of other chemical compounds. Durene4 ND ND ND NQ NQ 89 Hydrocarbon identified as one of the components of coal tar and
used mainly in the production of polyamide resins, plasticizers, dyes, pesticides, surface active agents.
Naphthalene4 ND ND ND 86 NQ 345 Used mainly in the petrochemical industry and in the formulation of repellents, fungicides, lubricators, synthetic resins, explosives,
solvents, tissue treatment, and others. Terpenes
Benzaldehyde3 56 823 272 65 172 50 Important component of almond essence. Commonly employed as a commercial flavour chemical in foods or as an industrial sol-vent. Also used in the synthesis of other organic compounds from pharmaceutical products to additives for plastics. Important inter-mediary in the manufacture of perfumes and flavour compounds
and in the preparation of certain anilines.
Limonene4 NQ 61 1066 214 1097 104 Used as the main constituent of citrus flavour in soft drinks. D-limonene is used as flavour chemical in foods and also added to cleaning products to aid detergency, imparting a lemony-orangey fragrance. Employed as a solvent for cleaning purposes such as the
removal of oil from parts of machines.
Myrcene 3 125 1361 1448 154 278 431 Used in the perfume industry and as an intermediary in the preparation of flavours and fragrances such as menthol, citral,
citronelol, citronelal, geraniol, nerol and linalool.
ND, not detected, detection limits of 15 μg.kg-1 for toluene, 10 μg.kg-1 for chlorobenzene and 7 μg.kg-1 for benzaldehyde and limonene; NQ below the Quantitation limits of 40 μg.kg-1 for
Even though the recycled PET evaluated in this study is not intended to food contact, it was used to evaluate the suitability of the proposed validated method in an expected low-level contaminated matrix. The results obtained show that even after the Washing Regime 2, toluene, p-xylene, m-xylene, styrene, hemelitol, limonene, and myrcene presented values above the limit of 220 µg.kg-1. Octanoic acid, durene, and naphthalene
were only quantified in samples obtained from Washing Regime 2. This could have occurred due to recontamination in the recycling system or even by external contamination.
It should be emphasized that the most recent investigation on determining the volatile compounds in recycled PET considers fully automated techniques aiming at the reduction of sample preparation time and allowance of higher sample throughput. In spite of these advantages, these techniques are of high cost and need more experienced personnel in order to achieve reliable results. In addition, up to 2007, the Brazilian regulation allowed solely the use of PET functional barrier to food contact application (BRASIL, 1999). Nonetheless, in 2008, the regulation concerning food grade recycled post consumer PET intended to food contact application was published (BRASIL, 2008). The criteria for food safety and the approval of food grade recycled post consumer PET require, among other procedures, the use of reliable validated methods to assure the compliance with the concentration limit for surrogates of 220 µg.kg–1 in the polymer.
The method proposed in this study proved reliable, simple, and low cost. Besides, it has never been previously applied, neither for PET material nor for quantification purposes.
4 Conclusions
The proposed analytical method, using dynamic headspace concentration as extraction technique and gas chromatography with flame ionization detector, was reliable, simple, practica,l and of low cost. The method presents adequate selectivity and quantification capability to determine the volatile contaminants in post-consumer PET. The method can easily be used in the quality control of the production of recycled PET, as well as by food surveillance governmental agencies.
Acknowledgements
The authors gratefully thank CNPq and CAPES for financial support.
References
ADAMS, R. P. Identification of essential oil components by gas
chromatography/ mass spectrometry. Carol Stream: Allured,
1995. 698 p.
BAYER, F. L. Polyethylene terephthalate recycling for food contact applications: testing, safety and technologies: a global perspective.
Food Additives and Contaminants, v. 19, p. 111-134, 2002.
Supplement.
BRASIL. Portaria SVS/MS nº 987, de 8 de dezembro de 1998. Regulamento Técnico para embalagens descartáveis de polietileno tereftalato – PET – multicamada destinadas ao acondicionamento de bebidas não alcoólicas carbonatadas. Diário Oficial [da] República
Federativa do Brasil, Brasília, DF, 9 dez. 1998. Available from:
<http://www.anvisa.gov.br/e-legis/>. Access in: 16 Oct. 2008.
Limonene is frequently found in post-consumer PET and originates from prolonged contact with soft drinks or fruit juices (FRANZ, 2002; NERÍN et al., 2003). Limonene is a volatile compound considered to be a precursor of off-flavours in foods, and thus its determination in PET could be used in some instances to guarantee that post-consumer recycled material is free of contaminants (GARCIA et al., 2006; CAVA et al., 2005).
Although some authors have concluded that the absorption of limonene by the package causes no relevant sensory changes in orange juice (van WILLIGE et al., 2003), a study of the transport mechanisms of limonene is important. The presence of limonene could affect the properties of the container and facilitate the loss of other volatile compounds of greater relevance to the shelf life of the product because of its plasticizing effect on the structure of the package wall (FAYOUX; SEUVRE; VOILLEY, 1997).
Fayoux, Seuvre and Voilley (1997) showed that the majority of the terpenes absorbed by PET were not removed even after the most severe washing treatments, and thus the off-flavours could appear in the next product introduced into the intended package.
It is worth mentioning that the majority of the contaminants identified in the samples analysed in the present study have already been identified in recycled PET by other authors (NERÍN et al., 2003; WIDÉN; LEUFVÉN; NIELSEN, 2005; NIELSEN; DAMANT; CASTLE, 1997; FRANZ; WELLE, 2002; REYNIER et al., 2004; KONKOL et al., 2003), confirming the suitability of the method proposed in this article.
3.6 Analysis of the market samples – quantification
The contamination levels of the substances identified by GC-MS and the Kovats Indexes, and present in the samples after being submitted to the two washing regimes, were estimated using analytical curves for the model substances (toluene, chlorobenzene, benzaldehyde, and limonene). The results are shown in Table 4.
A comparison of the results obtained for material from the suppliers who applied Washing Regime 1 showed that hexanal, 2-methyl phenol, toluene, p-xylene, m-xylene, styrene, cumene, hemelitol, benzaldehyde, limonene, and myrcene were present in all samples. Octanal, 3-methyl phenol and 4-ethyl-o-xylene were present in only a few samples. Octanoic acid, durene and naphthalene, despite having been identified by GC-MS (Table 3), could not be quantified by GC/FID (Table 4). The presence of elevated levels of some contaminants can be attributed to the misuse of post-consumer PET packaging material and lack of control in the collection of the material. After Washing Regime 2, few of these contaminants were completely removed.
According to the US-FDA’s model for assessing the efficiency of a recycling process, the maximum acceptable level of a residual contaminant in a polymer that corresponds to an estimated daily rate of 1.5 µg/person/day, depends on the density of the polymer, its thickness, and the consumption factor. Based on this, a maximum value for residues of 220 µg.kg-1
was proposed for recycled PET (with a density of 1.4 g.cm-3)
BRASIL. Resolução da Diretoria Colegiada - RDC nº 20, de 26 de março de 2008. Dispõe sobre o Regulamento Técnico sobre embalagens de polietilenotereftalato (PET) pós-consumo reciclado grau alimentício (PET-PCR grau alimentício) destinados a entrar em contato com alimentos. Diário Oficial [da] República Federativa
do Brasil, Brasília, DF, 2008. Available from: <http://www.anvisa.
gov.br/e-legis/>. Access in: 16 Oct. 2008.
BRUCE, P.; MINKKINEN, P.; RIEKKOLA, M. L. Practical method validation sufficient for in analysis method. Mickrochimica Acta, v. 128, n. 1-2, p. 93-106, 1998.
CAVA, D. et al. Testing limonene diffusion through food contact polyethylene by FT-IR spectroscopy: Film thickness, permeant concentration and outer medium effects. Polymer Testing, v. 24, n. 4, p. 483-489, 2005.
DZIECIOL, M.; TRZESZCZYNSKI, J. Volatile products of poly(ethylene terephthalate) thermal degradation in nitrogen atmosphere. Journal
of Applied Polymer Science, v. 77, n. 9, p. 1894-1901, 2000.
DZIECIOL, M.; ZIECIOL, M.; TRZESZCZYNSKI, J. Studies of temperature influence on volatile thermal degradation products of poly(ethylene terephthalate). Journal of Applied Polymer Science, v. 69, n. 12, p. 2377-2381, 1998.
EZQUERRO, O.; PONS, B.; TENA M. T. Multiple headspace solid-phase microextraction for the quantitative determinantion of volatile organic compounds in multilayer packagings. Journal of
Chromatography A, v. 999, n. 1-2, p. 155-164, 2003.
FAYOUX, S. C.; SEUVRE, A.; VOILLEY, A. J. Aroma transfers in and through plastic packagings: orange juice and d-limonene: a review. Part I: orange juice aroma sorption. Packaging Technology and
Science, v. 10, n. 2, p. 69-82, 1997.
FOOD AND AGRICULTURE ORGANIZATION OF THE UNITED NATIONS – FAO. Validation of analytical methods for food
control. A report of a joint FAO/IAEA expert consultation 2-4
December 1997 Vienna, Austria. Rome: FAO, 1998. 19 p. Available from: <ftp://ftp.fao.org/docrep/fao/007/w8420e/w8420e00.pdf>. Access in: 16 Oct. 2008. Fao Food and Nutrition Paper 68. FRANCO, M. R. B.; RODRIGUEZ, D. B. A. Trapping of soursop
(Annona muricata) juice volatiles on porapak Q by suction. Journal
of the Science of Food and Agriculture, v. 34, n. 3, p. 293-299,
1983.
FRANZ, R. Programme on the recyclability of food-packaging materials with respect to food safety considerations: polyethylene terephthalate (PET), paper and board, and plastics covered by functional barriers. Food Additives and Contaminants, v. 19, p. 93-110, 2002. Supplement.
FRANZ, R.; MAUER, A.; WELLE, F. European survey on post-consumer poly(ethylene terephthalate) (PET) materials to determine contamination levels and maximum consumer exposure from food packages made from recycled PET. Food Additives and
Contaminants, v. 21, n. 3, p. 265-286, 2004.
FRANZ, R.; WELLE, F. Recycled poly (ethylene terephthalate) for direct food contact applications: challenge test of an inline recycling process. Food Additives and Contaminants, v. 19, n. 5, p. 502-511, 2002.
FREIRE, M. T. A. et al. Thermal stability of polyethylene terephthalate food contact material: formation of volatiles from retail samples and implications for recycling. Food Additives and Contaminants, v. 1, n. 4, p. 473-480, 1998.
FREIRE, M. T. A.; REYES F. G. R. A importância do polietileno tereftalato (PET) na indústria de embalagens para alimentos.
Boletim SBCTA, v. 31, n. 12, p. 129-136, 1997.
GARCÍA, R. S. et al. Revision of analytical strategies to evaluate different migrants from food packaging materials. Trends in Food
Science & Technology, v. 17, n. 7, p. 354-366, 2006.
HAKKARAINEN, M.; GRONING, M.; ALBERTSSON, A. Solid-phase microextraction (SPME) in polymer characterization: long-term properties and quality control of polymeric materials. Journal of
Applied Polymer Science, v. 89, n. 3, p. 867-873, 2003.
HUBER, L. Validation of analytical methods: review and strategy. LC/
GC International, v. 11, p. 96-105, 1998.
INTERNATIONAL LIFE SCIENCES INSTITUTE – ILSI EUROPE.
Report on Packaging Materials 1: polyethylene terephathalate
(PET) for food packaging applications. Brussels: ILSI Europe
Packaging Material Task Force, 2000.
KALJURAND, M.; SMIT, H. C. Comparison of sample concentration methods and correlation chromatography for polymer dynamic head-space studies. Chromatographia, v. 39, n. 3-4, 210-215, 1994. KONKOL, L. M. et al. Contaminants and levels of occurrence in washed
and shredded poly (ethylene terephthalate) from curbide collection. Part 1: extraction conditions. Food Additives and Contaminants, v. 20, n. 9, p. 859-874, 2003.
KUZNESOF, P. M.; VANDERVEER, M. C. Recycled plastics for food-contact applications: science, policy and regulation. In: RADER, C. P. et al. (Eds.). Plastics, rubber and paper recycling: a pragmatic approach. Washington: American Chemical Society, 1995. p. 390-403.
LANÇAS, F. M. Cromatografia em fase gasosa. São Carlos: Acta Eventos, 1993. p. 240.
LEBOSSÉ, R.; DUCRUET, V.; FEIGENBAUM, A. Interactions between reactive aroma compounds from model citrus juice with polypropylene packaging film. Journal of Agricultural and Food
Chemistry, v. 45, n. 8, p. 2836-2842, 1997.
LIN, C.-E. et al. Migration behavior and selectivity of sulfonamides in capillary electrophoresis. Journal of Chromatography A, v. 792, n. 1-2, p. 37-47, 1997.
MILLER, J. C.; MILLER, J. N. Statistics for analytical chemistry. 3rd ed. New York: Ellis Horwood, 1993. 232 p.
NATIONAL INSTITUTE OF STANDARDS AND TECHNOLOGY – NIST. ChemistryWebbook. NIST Standard Reference Database 69. 2005. Available from: <http://webbook.nist.gov/chemistry/>. Access in: 16 Oct. 2008.
NERÍN, C. et al. Evaluation of some screening methods for the analysis of contaminants in recycled polyethylene terephthalate flakes. Food
Additives and Contaminants, v. 20, n. 7, p. 668-677, 2003.
NIELSEN, T.; DAMANT, A. P.; CASTLE, L. Validation studies of a quick test for predicting the sorption and washing properties of refillable plastic bottles. Food Additives and Contaminants, v. 14, n. 6-7, p. 685-693, 1997.
NONGONIERMA, A. et al. Mechanims of extraction of aroma compounds from foods, using adsorvents. Effect of various parameters. Food Reviews International, v. 22, n. 1, p. 51-94, 2006.
PAIK, J. S. Comparison of sorption in orange flavor components by packaging films using the headspace technique. Journal of
Agricultural and Food Chemistry, v. 40, n. 10, p. 1822-1825,
1992.
PAWLISZYN, J. Solid phase microextraction: theory and practice. New York: Wiley-VHC, 1997. 245 p.
Plastics, rubber and paper recycling: a pragmatic approach. Washington: American Chemical Society, 1995. p. 458-471. REYNIER, A. et al. Stabilization of aroma compounds through
sorption-release by packaging polymers. Journal of Agricultural
and Food Chemistry, v. 52, n. 18, p. 5653- 5662, 2004.
RIBANI, M. et al. Validação em métodos cromatográficos e eletroforéticos. Química Nova, v. 27, n. 5, p. 771-780, 2004. SADLER, G. D. Recycling of polymers for food use: a current
perspective. In: RADER, C. P. et al. (Eds.). Plastics, rubber and
paper recycling: a pragmatic approach. Washington: American
Chemical Society, 1995. p. 380-388.
SOTO-VALDEZ H.; GRAMSHAW, J. W.; VANDENGURG, H. J. Determination of potencial migrants present in Nylon ‘microwave and roasting bags’ and migration into olive oil. Food Additives and
Contaminants, v. 14, n. 3, p. 309-318, 1997.
TRIANTAFYLLOU, V. et al. Studies on the usability of recycled PET for food packaging applications. European Food and Research
Technology, v. 215, n. 3, p. 243-248, 2002.
US FOOD AND DRUG ADMINISTRATION – FDA. CFSAN/Office of Food Additive Safety. Guidance for industry. Use of recycled plastics
in food packaging: chemistry considerations. Available from: <http://
www.cfsan.fda.gov/~dms/opa2cg3b.html>. Access in: 16 Oct. 2008. VALENTE SOARES, L. M. Como obter resultados confiáveis em
cromatografia. Revista do Instituto Adolfo Lutz, v. 60, n. 1, p. 79-84, 2001.
VAN WILLIGE, R. W. G. et al. Influence of flavour absorption by food-packaging materials (low-density polyethylene, polycarbonate and
polyethylene terephthalate) on taste perception of a model solution and orange juice. Food Additives and Contaminants, v. 20, n. 1, p. 84-91, 2003.
VILLBERG, K.; VEIJANEN, A.; GUSTAFSSON, I. Identification of off-flavour compounds in high-density polyethylene (HDPE) with different amounts of abscents. Polymer Engineering and Science, v. 38, n. 6, p. 922-925, 1998.
von KOVATS, E. Gas-chromatographische charakterisierung organischer verbindungen, Teil 1: retentions indices aliphatischer halogenide, alkohole, aldehyde und ketone. Helvetica Chimica Acta, v. 10, p. 1915-1932, 1958.
WEZL, T.; LANKMAYR, E. P. Comparative studies of the static and dynamic headspace extraction of saturated short chain aldehydes from cellulose-based packaging materials. Analytical and
Bioanalytical Chemistry, v. 372, n. 5, p. 649-653, 2002.
WIDÉN, H.; LEUFVÉN, A.; NIELSEN, T. Identification of chemicals, possibly originating from misuse of refillable PET bottles, responsable for consumer complaints about off-odours in water and soft drinks. Food Additives and Contaminants, v. 22, n. 7, p. 681-692, 2005.
WIDÉN, H.; LEUFVÉN, A.; NIELSEN, T. Migration of model contaminants from PET bottles: influence of temperature, food stimulant and functional barrier. Food Additives and
Contaminants, v. 21, p. 993-1006, 2004.
ZHANG, Z.; PAWLISZYN, J. Headspace solid-phase microextraction.