CharaCterization and ClassifiCation of soils
in the taquari river Basin - Pantanal region,
state of Mato grosso do sul, Brazil
(1)Jolimar antonio schiavo(2), antonino hypólito dias neto(3), Marcos
gervasio Pereira(4), Jean sérgio rosset(5), Mateus luiz secretti(5) &
luiz Carlos ruiz Pessenda(6)
suMMary
among the soils in the Mato grosso do sul, stand out in the Pantanal biome, the spodosols. despite being recorded in considerable extensions, few studies aiming to characterize and classify these soils were performed. the purpose of this study was to characterize and classify soils in three areas of two physiographic types in the taquari river basin: bay and flooded fields. two trenches were opened in the bay area (P1 and P2) and two in the flooded field (P3 and P4). the third area (saline) with high sodium levels was sampled for further studies. in the soils in both areas the sand fraction was predominant and the texture from sand to sandy loam, with the main constituent quartz. in the bay area, the soil organic carbon in the surface layer (P1) was (oC) > 80 g kg-1, being diagnosed as histic epipedon. in the other profiles the surface horizons had low oC levels which, associated with other properties, classified them as ochric epipedons. in the soils of the bay area (P1 and P2), the ph ranged from 5.0 to 7.5, associated with dominance of Ca2+ and Mg2+, with base saturation above 50 % in some horizons. in the flooded fields (P3 and P4) the soil ph ranged from 4.9 to 5.9, h+ contents were high in the surface horizons (0.8–10.5 cmol
c kg-1), Ca2+ and Mg2 contents ranged from 0.4 to 0.8 cmol
c kg-1 and base saturation was < 50 %. in the soils of the bay area (P1 and P2) iron was accumulated (extracted by dithionite - fed) and oC in the spodic horizon; in the P3 and P4 soils only fed was accumulated (in the subsurface layers). according to the criteria adopted by the Brazilian system of soil Classification (siBCs) at the subgroup level, the soils were classified as: P1: organic hydromorphic ferrohumiluvic spodosol. P2:
(1) received for publication in January 5, 2011 and approved in March 2, 2012.
(2) Professor associado iv da universidade estadual de Mato Grosso do sul – ueMs, departamento de solos. rodovia aquidauana, km 12, CeP 79200-000 aquidauana (Ms). e-mail: schiavo@uems.br
(3) engenheiro agrônomo, Mestre em agronomia, Produção vegetal, ueMs. e-mail: tonybioagro@hotmail.com
(4) Professor associado ii do departamento de solos da universidade federal rural do rio de Janeiro – ufrrJ. Br 465, km 7, CeP 23890-000 seropédica (rJ). Bolsista do CnPq e faPerJ. e-mail: gervasio@ufrrj.br
(5) Mestrando do Programa de Pós-Graduação em agronomia, ueMs. e-mails: jrosset@hotmail.com; mateussecretti@hotmail.com (6) Professor do Centro de energia nuclear na agricultura – Cena/usP. av. Centenário 303, CeP 13416-000 Piracicaba (sP). Bolsista
do CnPq. e-mail: pessenda@cena.usp.br
typical orthic ferrohumiluvic spodosol. P3: typical hydromorphic ferroluvic spodosol. P4: arenic orthic ferroluvic spodosol.
index terms index: spodosols, quaternary sediments, soil taxonomy, siBCs.
resuMo: CARACTERIZAÇÃO E CLASSIFICAÇÃO DE SOLOS DA BACIA DO RIO TAQUARI NO PANTANAL SUL-MATO-GROSSENSE
Dentre os solos existentes no Mato Grosso do Sul, destacam-se no Bioma Pantanal, os Espodossolos. Apesar de serem verificados em extensões consideráveis, poucos estudos com objetivo de caracterização e classificação desses solos foram realizados. Objetivou-se caracterizar e classificar solos de três feições fisiográficas da bacia do rio Taquari: baía e campos de inundação. Foram abertas duas trincheiras na área de baía (P1 e P2) e duas na de campos de inundação (P3 e P4). A terceira feição (salinas) foi amostrada para estudos posteriores, por apresentar altos teores de sódio. Nos solos estudados, nas duas áreas houve predomínio da fração areia, com textura variando de areiaa franco-arenosa, sendo o principal constituinte o quartzo. Na área de baía o horizonte superficial (P1) apresentou teor de carbono orgânico (CO) maior que 80 g kg-1, sendo diagnosticado como H hístico. Para
os demais perfis, os horizontes superficiais apresentaram baixos teores de CO, o que, em associação com outros atributos, fez com que eles fossem diagnosticados como A moderado. Nos solos da área de baía (P1 e P2) os valores de pH variaram de 5,0 a 7,5, associados à dominância dos íons Ca2+ e Mg2+, com saturação por bases, em alguns horizontes, maior
que 50 %. Na área de campos de inundação, os solos (P3 e P4) mostraram valores de pH variando de 4,9 a 5,9, elevados valores de H+ nos horizontes superficiais (0,8 a 10,5 cmol
c kg-1), valores de Ca2+ + Mg2+ variando de 0,4 a 0,8 cmol
c kg-1 e saturação por bases maior que 50 %. Nos solos da área de baía (P1 e P2) ocorreu acúmulo de Fe, extraído por ditionito (Fed), e CO no horizonte espódico; e nos solos de campos de inundação (P3 e P4) houve acúmulo somente de Fed (nos horizontes subsuperficiais). De acordo com critérios adotados pelo Sistema Brasileiro de Classificação de Solos (SiBCS), em nível de subgrupo os solos foram classificados como: P1: Espodossolo Ferri-humilúvico hidromórfico organossólico, P2: Espodossolo Ferri-humilúvico órtico típico, P3: Espodossolo Ferrilúvico hidromórfico típico e P4: Espodossolo Ferrilúvico órtico espessarênico.
Termos de indexação: Espodossolos, sedimentos quaternários, taxonomia de solos, SiBCS.
introduCtion
the Brazilian Pantanal, in the upper Paraguay river Basin, covers approximately 138,183 km2, distributed in the states of Mato Grosso and Mato Grosso do sul. its northern limit is the river itiquira, in the south the river apa, in the east the western border of the Paraná river basin and in the West the borders of Bolivia and Paraguay. the region has a complex drainage network and is often periodically flooded. the main axis of the drain region is the Paraguay river, with several marginal alluvial fans. the most important among these is the taquari river is, with a collecting area covering about 36 % of the wetland.
the marsh plain is formed by recent, still active sediments of the quaternary period, composed primarily of sand with predominantly small and medium grain size. the altitude varies from 80 to 190 m (assine, 2003). in this sedimentary, periodically flooded environment, the large
oscillations in the groundwater level can be considered one of the main factors responsible for changes in soil characteristics, e.g., in color and chemical properties, such as those related to exchangeable cations and organic carbon content. in this environment, radaMBrasil (1982) identified Planosols, Plinthosols and spodosols.
in Brazil, spodosols are typically related to coastal environments and restinga vegetation (oliveira et al., 2010; Coelho et al., 2010), but also occur in large areas in the amazon on lower slopes with shrub vegetation and sediments with high sand content, as observed in the region of rio negro (Klinge, 1965; lucas et al., 1984, 1987; Bravard & righi, 1989; righi et al., 1990).
aluminum (al) that may or may not contain iron (fe) in the spodic horizon (Bs and/or Bsm) and espodossolos ferrihumilúvicos with accumulation of oC, fe and al in the spodic horizon (Bhs and/ or Bhsm). More detailed research, addressing what forms of fe and al would be complexed by organic matter in the spodic B horizon, to generate more information for the structuring of the lower hierarchical levels of the siBCs, was carried out by oliveira et al. (2010) and Coelho et al. (2010) for the coastal region of Brazil. however, in the Pantanal region, although the conditions are favorable for the formation of spodosols, there is still a lack of research on this soil type, compared to the number of studies in the coastal region of Brazil. Moreover, in some areas of the Pantanal region, the formation of spodic horizons associated with high levels of sodium (na+) is observed, which is uncommon for most spodosols classified in Brazil.
in this context, the purpose of this study was the characterization and classification of some spodosols of the upper Paraguay river Basin in the Pantanal.
Materials and Methods
the study was conducted in the upper Paraguay river Basin (uPB) which is part of the Bacia do Prata, located in the Pantanal of Mato Grosso do sul, in the Midwest region of Brazil (lat 16–22 ° south; long 55–58 ° West; 80–190 m). the characteristic climate of the region according to Köppen is aw (tropical megathermic), with 1,433 mm annual rainfall, and maximum and minimum temperatures of 40.0 and 20.3 °C, respectively (soriano & Galdino, 2002). the source material of the soils were sediments from the taquari Basin dating back to the quaternary Period (assine, 2003).
one of the 11 subregions of the Pantanal, nhecolândia, was selected. this 26,921 km2 area located in the central region of the Pantanal, is largely covered by sediments of the river taquari. its soils are sandy, deep and hydromorphic, located on the floodplain subject to periodic flooding for 3-4 months a year (sousa, 2003). the predominant spodosols are covered by deciduous tropical cerradão (woodland savanna) and tropical cerrado (open shrub); natraqualfs (Planossolos nátricos) were observed in areas of cerrado and tropical quartzipsamments on the banks and near the river taquari, associated with tropical cerrado and deciduous tropical cerrado (radaMBrasil, 1982.).
the subregion nhecolândia has different environments, mainly due to the relief variations,
namely: a) bays: depressed areas flooded most of the year, b) flooded fields: periodically flooded areas, and c) saline areas, where ponds of brackish water appear that are rarely flooded by the rivers. four trenches were opened in two areas, which are described below: a) Bay: profiles P1 and P2 (coordinates 18 º 59 ‘.34 “ s and 56 º 36 ‘ 15 “ W, 97 m) and b) flooded fields: Profile P3 (coordinates 19 º 09 ‘ 39 “ s and 55 º 17 ‘ 32 “ W, 290 m) and profile P4 (coordinates 18 º 58 ‘ 49 “ s and 56 º 39 ‘ 08 “ W, 100 m). Profiles from the saline physiographic area were also sampled. the colors of the subsurface layers of these profiles have low values and chromas, indicating reductomorphic environments. the presence of a strongly cemented spodic B horizon called “ortstein” was also observed. the ph values determined in the field were high (9.9–10.0), and may be due to the high levels of exchangeable sodium. these profiles will be the subject of future studies.
the profiles were morphologically described according to santos et al. (2005), based on samples collected from all horizons. the samples were dried and sieved (2 mm mesh) to obtain air-dried fine earth (adfe). undisturbed soil from the profiles was sampled with a volumetric ring (73.5 cm-3) to determine bulk density (Bd), according to embrapa (1997).
the chemical and physical analyses were performed using air-dried fine earth (adfe). the particle size was determined by dispersion, using 0.1 mol l-1 sodium hydroxide and sodium hexametaphosphate (naPo3 + na2Co3). the particle density was determined by the volumetric flask method. the exchangeable cations Ca2+, Mg2+ and al3+ were extracted with 1 mol l-1 KCl, and h + al with a solution of 0.5 mol l-1 calcium acetate, at ph 7.0. the levels of P, na+ and K+ were extracted with 0.0125 mol l-1 h
2so4 solution + 0.05 mol l-1 hCl. the Ca2+ and Mg2+ contents were determined by titration with 0.0125 mol l-1 edta solution, na+ and K, by flame photometry, P by colorimetry, and al3+ andh + al, by titration with 0.025 mol l-1 naoh. the ph in water and KCl (weight 1:2.5) was determined by a potentiometer, and from the data the delta ph (Δph) was calculated. organic carbon (oC) was determined according to Yeomans & Bremner (1988). from these data, the aluminum saturation (m); s value (sum of exchangeable bases); t value (soil CeC), and v % value of sodium saturation (na/t) were calculated. the above procedures were performed as proposed by embrapa (1997).
using sodium dithionite-citrate-bicarbonate (dCB) (Mehra & Jackson, 1960) and 0.2 mol l-1 ammonium oxalate, at ph 3.0, in the dark (McKeague & day, 1966).
Mineralogical analysis was carried out in the subsurface horizons, by X-ray diffraction of the sand fraction in a Philips PW 2400 diffractometer with a copper anode (Cu Ka) and ni filter at 40 kv and 40 ma, at 1.2 two-theta (degrees) per minute. samples were prepared as described by Witthig & allardice (1986).
from the morphological descriptions and analytical (physical, chemical and mineralogical)
data, the soils were classified according to the Brazilian system of soil Classification (siBCs) (embrapa, 2006).
results and disCussion
soil morphology
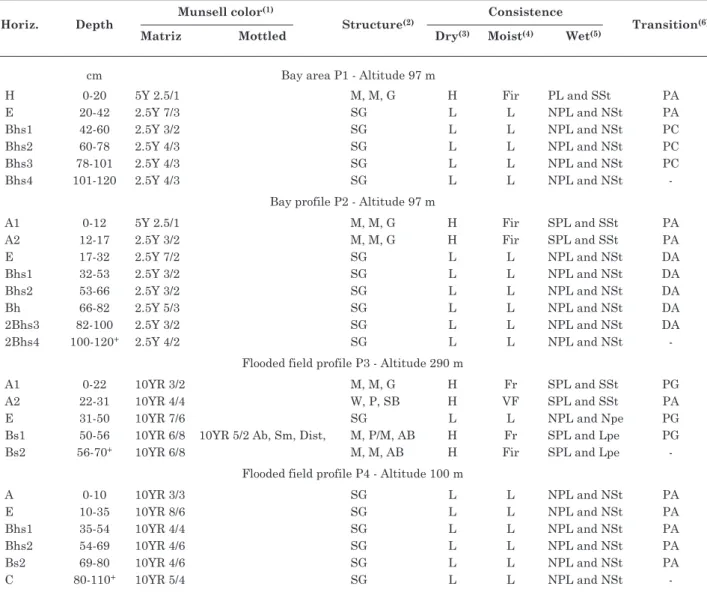
the area described in the two environments (bay and flood fields) differed with regard to soil color, structure, consistency, and thickness of the horizons and their transitions (table 1).
table 1. Morphological properties of soils developed from sediments of the river taquari watershed in the Pantanal of Mato grosso do sul
horiz. depth
Munsell color(1)
structure(2)
Consistence
transition(6)
Matriz Mottled dry(3) Moist(4) Wet(5)
cm Bay area P1 - altitude 97 m
h 0-20 5Y 2.5/1 M, M, G h fir Pl and sst Pa
e 20-42 2.5Y 7/3 sG l l nPl and nst Pa
Bhs1 42-60 2.5Y 3/2 sG l l nPl and nst PC
Bhs2 60-78 2.5Y 4/3 sG l l nPl and nst PC
Bhs3 78-101 2.5Y 4/3 sG l l nPl and nst PC
Bhs4 101-120 2.5Y 4/3 sG l l nPl and nst
-Bay profile P2 - altitude 97 m
a1 0-12 5Y 2.5/1 M, M, G h fir sPl and sst Pa
a2 12-17 2.5Y 3/2 M, M, G h fir sPl and sst Pa
e 17-32 2.5Y 7/2 sG l l nPl and nst da
Bhs1 32-53 2.5Y 3/2 sG l l nPl and nst da
Bhs2 53-66 2.5Y 3/2 sG l l nPl and nst da
Bh 66-82 2.5Y 5/3 sG l l nPl and nst da
2Bhs3 82-100 2.5Y 3/2 sG l l nPl and nst da
2Bhs4 100-120+ 2.5Y 4/2 sG l l nPl and nst
-flooded field profile P3 - altitude 290 m
a1 0-22 10Yr 3/2 M, M, G h fr sPl and sst PG
a2 22-31 10Yr 4/4 W, P, sB h vf sPl and sst Pa
e 31-50 10Yr 7/6 sG l l nPl and npe PG
Bs1 50-56 10Yr 6/8 10Yr 5/2 ab, sm, dist, M, P/M, aB h fr sPl and lpe PG
Bs2 56-70+ 10Yr 6/8 M, M, aB h fir sPl and lpe
-flooded field profile P4 - altitude 100 m
a 0-10 10Yr 3/3 sG l l nPl and nst Pa
e 10-35 10Yr 8/6 sG l l nPl and nst Pa
Bhs1 35-54 10Yr 4/4 sG l l nPl and nst Pa
Bhs2 54-69 10Yr 4/6 sG l l nPl and nst Pa
Bs2 69-80 10Yr 4/6 sG l l nPl and nst Pa
C 80-110+ 10Yr 5/4 sG l l nPl and nst
-(1) ab: abundant; sm: small; dis: distinct.(2) structure: degree of development: (W: weak, M: Moderate), size (s: small and M: medium),
shape (G: Granular, sB: subangular blocks, aB: angular blocks and sG: single grains). (3) dry consistence: (l: loose and h: hard). (4) Moist consistence: (l: loose, vf: very friable, fr: friable and fir: firm). (5) Wet consistence: (nPl: not plastic, Pl: plastic, sPl:
slightly plastic, nst: not sticky, sst: slightly sticky and st: sticky). (6) transition: (Pa: Plain and abrupt, PC: Plain and Clear, PG:
in the bay area, the horizon sequence of the soils (P1 and P2) was h, e and a, e, respectively, both presenting uncemented spodic horizons. the surface horizon h of profile P1 had hue 5Y, granular structure; hard and firm consistence when dry and moist, respectively, and plastic and slightly sticky when wet. Profile P2 contained a horizon with morphological characteristics similar to the h horizon of P1, except for the slightly plastic wet consistence. the subsurface horizons (e and B) had hue 2.5 Y, simple grain structure, loose consistence when dry and moist, not sticky and not plastic when wet. the transition between the surface and e horizons was sharp and plain; and in the subsurface layers ranged from clear and plain in P1 to abrupt and discontinuous in P2.
in the flooded field the soil horizon sequence was a, e, followed by uncemented spodic B. in all horizons of the soils in this environment, yellowish colors with hue 10Yr were observed, and in the subsurface horizon (Bs1) of profile P3 the presence of abundant small to medium-sized, contrasting speckles, with hue 10Yr. in general, the aggregate shapes ranged from granular in the surface horizons to angular and subangular blocks in the subsurface. specifically in all P4 horizons, simple grain structure without aggregation was observed. the transition between horizons in P4 was abrupt and plain, while in P3, the topography is flat, and differentiation ranged from abrupt to gradual.
in both areas studied, a marked influence of the podzolization process was observed, by which organic compounds in solution that complex metal ions such as fe and/or al or not, were translocated into subsurface layers, due to variations in the water table (andriesse, 1969; Mokma & evans, 1999; dias et al., 2003; oliveira et al., 2010; Coelho et al., 2010). the soils studied were characterized by an albic e horizon (embrapa, 2006), suggesting an intense podzolization process.
in the environments under study, the oscillation of the water table can be considered primarily responsible for the morphological differences of the soils. in the bay area, where the water table is closer to the surface for most of the year, the soil colors ranged from dark gray to dark olive (low value and chroma), indicating hydromorphism. this environment is favorable for organic matter accumulation at the surface, as observed in the surface horizon of profile P1 in the bay area. on the other hand, in the flooded field areas the water table is below 1 m soil depth for most of the year, resulting in more oxidized colors (brown, dark brown and yellowish brown). also, in this environment where the water table is high for a short period only, mottled colors were observed, as well as the
possibility of formation of aggregate structures with angular block shape in the subsurface horizons.
Physical properties
in the two studied areas, the sand fraction was predominant in terms of granulometric composition, reflecting higher values of bulk and particle density (table 2). in the bay area, the sand content ranged from 617 to 904 g kg-1 and in the flooded fields from 677 to 973 g kg-1. due to the high sand content in both environments, the soil texture ranged from loamy sand to sandy loam. in all soils, except for profile P3 in the flooded field, the fine sand fraction was highest.
Most commonly, based on the criteria adopted by siBCs (embrapa, 2006), the texture of spodosols is described as predominantly sandy, so particle size is variable but always essentially sandy (dias et al., 2003; oliveira et al., 2010), and the fine sand fraction may be predominant (Coelho et al., 2010).
the particle size can be used to draw conclusions on the dynamics of sedimentation. for the study environment in the taquari river basin, variations in size, according to assine (2003) indicate closeness to the river bed. in profile P3 (flooded field), with greater sand particle size, the environment was characterized by higher altitude (290 m) and proximity to the taquari riverbed. the other profiles were farther away from the riverbed, at lower altitudes, and the sediments were brought from a greater distance during the flood period, consisting mostly of fine sand.
except for the surface horizon h in profile P1 (0.86 Mg m-3) in the bay area, the values of bulk density were high (1.37–1.93 Mg m-3). the latter was associated with particle density, ranging from 2.65 to 2.95 Mg m-3. the pattern observed for the mineral horizons, both for bulk and for particle density, may be due to the predominance of the sand fraction, whose main constituent is mineral quartz (figure 1), with a density of about 2,65 Mg m-3.
Chemical properties
in the bay area, the oC levels were high (110.5 g kg-1) in the surface horizon of profile P1. also, in this area, oC is accumulated in the subsurface horizons, by a characteristic eluviation process of organic matter.
in the bay area, the ph in KCl was lower than in water, resulting in a negative Δph. the P concentrations were low and quite similar to the profiles of the bay area (0.02–0.03 mg kg-1). in the surface horizons (h, a1 and a2) of the two profiles, the highest levels of Ca2+, Mg2+ and h+ were observed, reflecting higher values of sum of bases (sB) and cation exchange capacity (CeC). the highest CeC in the surface horizons was associated with organic matter, primarily responsible for the cation exchange capacity in sandy soils (embrapa, 2006), as well as in spodosols (dias et al., 2003; oliveira et al., 2010; Coelho et al., 2010). in this environment, the occurrence of Ca2+ and Mg2+ accumulation in subsurface horizons Bhs3 and Bhs4 (P1) and Bhs1, Bhs2, 2Bhs3 and 2Bhs4 (P2) is noteworthy, resulting in base saturation values of > 50 %. also, high levels of sodium (na+) were detected, contributing to increased na+ saturation (na/tx100). according to a class-defining control section based on sodium saturation (na/tx100) of the siBCs (embrapa, 2006), soils can have a sodic (na/tx100 ≥ 15 %) or solodic character (na/tx100 between 6 and 15 % for some subsurface horizons of P1 and P2). in some horizons, al3+ contents
figure 1. X-ray diffractometry of the sand fraction of soils developed from sediments of the river taquari watershed in the Pantanal of Mato grosso do sul. a: bay area P1 (Bhs2 60–78 cm); B: bay area P2(Bh 66–82 cm); C: flooded field P3 (Bs1 50–56 cm); d: flooded field P4 (Bhs2 54–69 cm); qz: quartz; fd: feldspar.
table 2. Bulk density, particle size and texture of soils developed from sediments of the river taquari watershed in the Pantanal of Mato grosso do sul
horiz. depth Bulk density Particle size texture
soil Partícle dens. Coarse sand fine sand silt Clay
cm Mg m-3 g kg-1
Bay profile P1 - altitude 97 m
h 0-20 0.86 0.76 135 516 182 167
-e 20-42 1.73 2.61 167 731 78 24 sand
Bhs1 42-60 1.72 2.72 173 647 121 59 sand
Bhs2 60-78 nm 2.69 177 680 121 22 sand
Bhs3 78-101 1.85 2.64 167 673 109 51 sand
Bhs4 101-120 nm 2.70 161 634 95 110 loamy sand
Bay profile P2 - altitude 97 m
a1 0-12 1.61 2.46 86 531 184 200
-a2 12-17 nm 2.63 162 630 135 74 loamy sand
e 17-32 1.68 2.65 155 749 75 21 sand
Bhs1 32-53 1.74 2.75 194 653 49 104 loamy sand
Bhs2 53-66 nm 2.73 164 665 76 95 loamy sand
Bh 66-82 nm 2.63 157 729 80 34 sand
2Bhs3 82-100 1.81 2.71 137 703 92 68 sand
2Bhs4 100-120+ nm 2.70 166 627 104 104 loamy sand
flooded field profile P3 - altitude 290 m
a1 0-22 1.37 2.85 343 334 138 185
-a2 22-31 1.71 2.71 445 458 29 68 sand
e 31-50 1.79 2.63 481 461 34 24 sand
Bs1 50-56 1.93 2.66 585 254 87 74 sand
Bs2 56-70+ 1.88 2.73 535 286 72 106 loamy sand
flooded field profile P4 - altitude 100 m
a 0-10 nm 2.68 167 806 25 2 sand
e 10-35 nm 2.68 132 719 95 54 sand
Bhs1 35-54 nm 2.68 142 808 7 43 sand
Bhs2 54-69 1.57 2.70 151 771 16 62 sand
Bs2 69-80 1.60 2.65 119 798 17 66 sand
C 80-110+ nm 2.66 122 823 4 51 sand
were high (0.50 cmolc kg-1), but not enough for an aluminate character.
in the flooded fields, surface horizons had low oC levels (13.11–8.13 g kg-1 in P3 and P4, respectively). differing from the bay area, the oC in flooded field soils decreased gradually with depth, and no podzolization was observed. the soils had low water and KCl ph, ranging from moderately to strongly acidic. in this environment, similarly to the bay area, the ph in KCl was lower than in water, making Δph negative. the P concentrations were also low, with little variation between profiles. similarly as observed for P, the content of exchangeable cations was low (0.2–0.9 cmolc kg-1), decreasing slightly with depth. the highest values of exchangeable bases in the upper horizons followed the oC levels, and the values of h+ and CeC of these horizons were also highest. despite the low values of sum of bases, base
saturation was ≥ 50 % in the e horizon of profile P3, a fact attributed to very low na+ values in the exchange complex. specifically, h+ values increased in depth in profile P4, indicating high CeC values. in the soils of this area, no high al3+ concentrations were observed in the exchange complex; the highest content was found in the surface a1 horizon profile P3 (0.8 cmolc kg-1).
the contents of sio2, al2o3, fe2o3, fe extracted with dithionite-citrate (fed), fe extracted with oxalate (feo) and their molecular relationships differed between the sampled soils (table 4).
the sio2 contents were highest in the surface horizons of the bay area (profile P1 and P2) and flooded field (profile P3) (104.7, 119.7 and 97.3 g kg-1, respectively). additionally, sio2 were highest in the subsurface layers of all studied profiles. al2o3
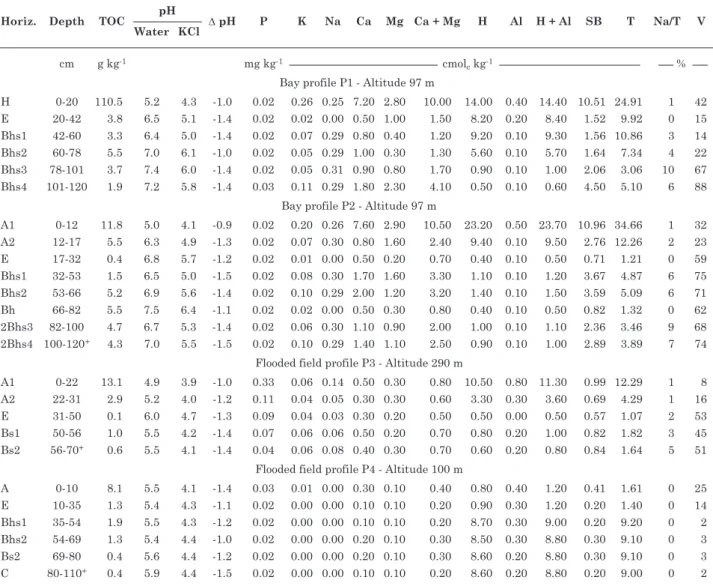
table 3. Chemical properties of soils developed from sediments of the river taquari watershed in the Pantanal of Mato grosso do sul
horiz. depth toC ph ∆ ph P K na Ca Mg Ca + Mg h al h + al sB t na/t v Water KCl
cm g kg-1 mg kg-1 cmol
c kg-1 %
Bay profile P1 - altitude 97 m
h 0-20 110.5 5.2 4.3 -1.0 0.02 0.26 0.25 7.20 2.80 10.00 14.00 0.40 14.40 10.51 24.91 1 42 e 20-42 3.8 6.5 5.1 -1.4 0.02 0.02 0.00 0.50 1.00 1.50 8.20 0.20 8.40 1.52 9.92 0 15 Bhs1 42-60 3.3 6.4 5.0 -1.4 0.02 0.07 0.29 0.80 0.40 1.20 9.20 0.10 9.30 1.56 10.86 3 14 Bhs2 60-78 5.5 7.0 6.1 -1.0 0.02 0.05 0.29 1.00 0.30 1.30 5.60 0.10 5.70 1.64 7.34 4 22 Bhs3 78-101 3.7 7.4 6.0 -1.4 0.02 0.05 0.31 0.90 0.80 1.70 0.90 0.10 1.00 2.06 3.06 10 67 Bhs4 101-120 1.9 7.2 5.8 -1.4 0.03 0.11 0.29 1.80 2.30 4.10 0.50 0.10 0.60 4.50 5.10 6 88
Bay profile P2 - altitude 97 m
a1 0-12 11.8 5.0 4.1 -0.9 0.02 0.20 0.26 7.60 2.90 10.50 23.20 0.50 23.70 10.96 34.66 1 32 a2 12-17 5.5 6.3 4.9 -1.3 0.02 0.07 0.30 0.80 1.60 2.40 9.40 0.10 9.50 2.76 12.26 2 23 e 17-32 0.4 6.8 5.7 -1.2 0.02 0.01 0.00 0.50 0.20 0.70 0.40 0.10 0.50 0.71 1.21 0 59 Bhs1 32-53 1.5 6.5 5.0 -1.5 0.02 0.08 0.30 1.70 1.60 3.30 1.10 0.10 1.20 3.67 4.87 6 75 Bhs2 53-66 5.2 6.9 5.6 -1.4 0.02 0.10 0.29 2.00 1.20 3.20 1.40 0.10 1.50 3.59 5.09 6 71 Bh 66-82 5.5 7.5 6.4 -1.1 0.02 0.02 0.00 0.50 0.30 0.80 0.40 0.10 0.50 0.82 1.32 0 62 2Bhs3 82-100 4.7 6.7 5.3 -1.4 0.02 0.06 0.30 1.10 0.90 2.00 1.00 0.10 1.10 2.36 3.46 9 68 2Bhs4 100-120+ 4.3 7.0 5.5 -1.5 0.02 0.10 0.29 1.40 1.10 2.50 0.90 0.10 1.00 2.89 3.89 7 74
flooded field profile P3 - altitude 290 m
a1 0-22 13.1 4.9 3.9 -1.0 0.33 0.06 0.14 0.50 0.30 0.80 10.50 0.80 11.30 0.99 12.29 1 8 a2 22-31 2.9 5.2 4.0 -1.2 0.11 0.04 0.05 0.30 0.30 0.60 3.30 0.30 3.60 0.69 4.29 1 16 e 31-50 0.1 6.0 4.7 -1.3 0.09 0.04 0.03 0.30 0.20 0.50 0.50 0.00 0.50 0.57 1.07 2 53 Bs1 50-56 1.0 5.5 4.2 -1.4 0.07 0.06 0.06 0.50 0.20 0.70 0.80 0.20 1.00 0.82 1.82 3 45 Bs2 56-70+ 0.6 5.5 4.1 -1.4 0.04 0.06 0.08 0.40 0.30 0.70 0.60 0.20 0.80 0.84 1.64 5 51
flooded field profile P4 - altitude 100 m
and fe2o3 contents behaved similarly, ie, tended to accumulate in the deeper soil layers. on the other hand, the tio2 levels were low (2.1 kg to 5.7 g kg-1) with little variation in depth.
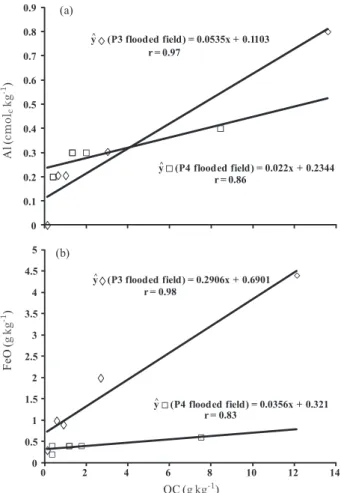
in both areas, the fed were higher than the feo contents. in the bay area, a tendency to accumulate oC, al3+, fed and feo in illuvial horizons (B horizon) was observed, more than in the horizons
table 4. Contents of sio2, al2o3, fe2o3, tio2, fed, feo and molecular ratios feo/fed and al2o3/fe2o3 of soils developed from sediments of the river taquari watershed in the Pantanal of Mato grosso do sul
horizon depth sio2 al2o3 fe2o3 tio2 fed feo feo/fed al2o3/fe2o3
cm g kg-1
Bay profile P1 - altitude 97 m
h 0-20 104.7 26.5 18.7 2.8 4.7 2.3 0.5 2.2
e 20-42 12.0 2.6 5.0 2.4 1.3 0.3 0.2 0.8
Bhs1 42-60 47.2 23.2 19.2 4.4 11.7 3.1 0.3 1.9
Bhs2 60-78 30.1 20.5 13.1 3.4 6.8 2.0 0.3 2.5
Bhs3 78-101 28.9 25.6 9.0 5.7 2.4 0.6 0.3 4.5
Bhs4 101-120 52.3 7.7 14.1 4.4 2.5 0.9 0.4 0.9
Bay profile P2 - altitude 97 m
a1 0-12 119.7 42.5 20.9 3.5 9.8 4.7 0.5 3.2
a2 12-17 30.0 23.1 8.1 2.7 2.5 1.4 0.6 4.5
e 17-32 12.6 12.8 3.0 2.4 0.7 0.3 0.4 6.7
Bhs1 32-53 42.4 18.0 17.1 3.7 8.1 3.1 0.4 1.7
Bhs2 53-66 52.8 36.1 23.2 4.4 9.5 4.5 0.5 2.7
Bh 66-82 14.0 5.1 6.0 3.3 0.9 0.4 0.4 1.3
2Bhs3 82-100 27.3 17.9 8.0 3.4 2.5 0.9 0.4 3.5
2Bhs4 100-120+ 48.8 20.6 11.1 4.0 2.9 1.5 0.5 2.9
flooded field profile P3 - altitude 290 m
a1 0-22 97.3 88.6 18.4 5.5 19.5 4.4 0.2 7.6
a2 22-31 21.5 5.1 10.0 4.0 6.5 2.0 0.3 0.8
e 31-50 4.8 12.8 5.0 2.1 2.6 0.3 0.1 4.0
Bs1 50-56 23.3 25.6 19.1 4.3 23.9 0.9 0.0 2.1
Bs2 56-70+ 28.1 38.3 32.1 4.0 38.8 1.0 0.0 1.9
flooded field profile P4 - altitude 100 m
a 0-10 9.4 12.8 4.0 2.4 1.9 0.6 0.3 5.0
e 10-35 9.0 12.8 10.0 2.7 2.2 0.4 0.2 2.0
Bhs1 35-54 8.0 20.5 8.0 3.0 6.1 0.4 0.1 4.0
Bhs2 54-69 14.2 20.5 2.0 4.3 9.3 0.4 0.0 16.0
Bs2 69-80 17.2 12.8 5.0 3.7 6.4 0.4 0.1 4.0
C 80-110+ 7.6 12.8 5.0 4.0 1.3 0.2 0.2 4.0
figure 2. Pearson correlation between carbon and aluminium. a: bay profile P1 (p = 0.0023); B: bay profile P2 (p = 0.0056).
of these elements with organic compounds (van Wambeke, 1992; van Breemen & Buurman, 1998; Mokma & evans, 1999; dias et al., 2003; oliveira et al., 2010). in view thereof, we suggest the participation of oC, fe and al in the genesis of the spodic horizon B in the bay soils, while in the flooded fields only of fe not complexed by organic matter (fed), as corroborated by siBCs (embrapa, 2006). this pattern was reported elsewhere for areas with restinga (sparse herbaceous vegetation on sandy soil) (Moura filho, 1998; Moreau et al., 2006; Gomes et al., 2007; oliveira et al., 2010) and also for highland regions, (dias et al., 2003), with participation of fe and al in the genesis of the spodic B horizon, or only with greater participation of al in the podzolization process (Coelho et al., 2010).
the minor contribution of fe complexed with organic acids can be attributed to the presence of a high water table in the soil profile, promoting fe reduction and removal from the system (anderson et al., 1982; farmer et al., 1983; oliveira et al., 2010) independently, which is intensified by the sandy texture (andriesse, 1969).
soil classification
due to the high levels of oC (> 80 g kg-1) and horizon thickness, the surface of the profile P1 (bay area) was identified as histic epipedon, while the surface horizons of the other three areas did not fit in any other surface diagnostic horizons and were therefore classified as ochric epipedons (embrapa, 2006). in all studied profiles, spodic B horizons were observed, which were classified by siBCs in the 1st category level as spodosols (embrapa, 2006).
in the bay areas, the profiles P1 (horizon sequence h-e- Bhs) and P2 (a-e-Bhs), with hue 2.5Y and 5Y, respectively, and fe and oC accumulation in the subsurface horizons, were classified as ferrohumiluvic spodosol. Profile P1 fits into the 3rd level as hydromorphic, and organic at the 4th level, as it remains water-saturated in one or more horizons down to 100 cm beneath the soil surface and has a histic h horizon; it was therefore classified as organic hydromorphic ferrohumiluvic spodosol. Profile P2 had no additional differentiating property towards a major group or subgroup and was classified as typical orthic ferrohumiluvic spodosol.
in P3 and P4 of the flooded field soils, with horizon sequence a-e-Bs and hue 10 Yr, fe was predominant in the spodic horizon, leading to the classification ferroluvic spodosol. Profile P3, due to the presence of speckles and water saturation down to 100 cm beneath the soil surface, was classified as hydromorphic and at the subgroup level, in view of the absence of any differentiating property, as a typical hydromorphic ferroluvic spodosol. Profile P4, with sandy texture from the surface to below 100 cm, was classified as arenic orthic ferroluvic spodosol.
ConClusions
1. the main morphological and physical properties in the bay area were colors ranging from brown – light– grayish, black to gray – olive – dark, due to the extremely poor drainage, and yellowish and mottled in the flooded fields with slightly better drainage. in all profiles, the sand fraction texture ranged from sand to sandy loam mostly.
2. the chemical and mineralogical properties differed in the studied soils. acid soils were found in the flooded fields, with low base saturation and fe and al accumulation in the spodic horizon.
3. the influence of topography and source material associated with the process of podzolization was observed in both environments, playing a major role in the genesis of these soils.
aCKnoWledgeMents
the authors thank the fundeCt (foundation for the development of education, science and technology of the state of Mato Grosso do sul) - fundeCt / CnPq 02/2007-PPP; the ueMs (state university of Mato Grosso do sul), and the CnPq (national Council of scientific and technological development), project “Casadinho”, process 620029/20080, for funding and scholarships.
literature Cited
anderson, h.a.; BerroW, M.l.; farMer, v.C.; hePBurn, a.; russel, J.d. & WalKer, a.d. a reassessment of podzol formation processes. J. soil sci., 33:125-136, 1982. andriesse, J.P. a study of the environment and characteristics
of tropical Podzols in sarawak (east-Malaysia). Geoderma, 2:201-227, 1969.
assine, M.l. sedimentação na bacia do Pantanal Mato-Grossense, Centro-oeste do Brasil. rio Claro, universidade estadual Paulista, 2003. 115p. (tese de livre docência) Bravard, s. & riGhi, d. Geochemical differences in an
oxisol-spodosol toposequence of amazônia, Brazil. Geoderma, 44:29-42, 1989.
CaMarGo, o.a.; Moniz, a.C.; JorGe, J.a. & valadares, J.M.a.s. Métodos de análises química, mineralógica e física de solos do instituto agronômico de Campinas. Campinas, instituto agronômico de Campinas, 2009. 77p. (Boletim técnico, 106)
Coelho, M.r.; Martins, v.M.; vidal-torrado, P.; souza, C.r.G.; Perez, X.l.o. & vÁsquez, f.M. relação solo-relevo-substrato geológico nas restingas da planície costeira do estado de são Paulo. r. Bras. Ci. solo, 34:833-846, 2010.
dias, h.C.t.; sChaefer, C.e.G.r.; fernandes filho, e.i.; oliveira, a.P.; MiChel, r.f.M. & leMos Jr, J.B. Caracterização de solos altimontanos em dois transectos no Parque estadual do ibitipoca (MG). r. Bras. Ci. solo. 27: 469-481, 2003.
eMPresa Brasileira de Pesquisa aGroPeCuÁria - eMBraPa. Centro nacional de Pesquisa de solos. Manual de métodos de análises de solo. 2.ed. rio de Janeiro, 1997. 212p. eMPresa Brasieira de Pesquisa aGroPeCuÁria –
eMBraPa. Centro nacional de Pesquisa de solos. sistema brasileiro de classificação de solos. rio de Janeiro, 2006. 306p.
farMer, v.C.; russel, J.d. & sMith, B.f.l. extraction of inorganic forms of translocated al, fe and si from a Podzol Bs horizon. J. soil sci., 34:571-576, 1983.
GoMes, f.h.; vidal-torrado, P.; MaCias, f.; Gherardi, B. & Perez, X.l.o. solos sob vegetação de restinga na ilha do Cardoso (sP). i – Caracterização e classificação. r. Bras. Ci. solo, 31:1563-1580, 2007.
KlinGe, h. Podzol soil in the amazon basin. J. soil sci., 16:96-103, 1965.
luCas, Y.; Chauvel, a.; Boulet, r.; ranzani, G. & sCatolini, f. transição latossolos-podzóis sobre a formação Barreiras na região de Manaus, amazônia. r. Bras. Ci. solo, 8:325-35, 1984.
luCas, Y.; Boulet, a.; Chauvel, a. & veillon, l. systèmes sols ferralitiques-podzols em région amazonienne. in: riGhi, d. & Chauvel, a., eds. Podzols et podzolisation. Paris, institute nacional de la recherche agronomique, 1987. p.53-65.
McKeaGue, J.a. & daY, J.h. dithionite- and oxalate-extractable fe and al as aids in differentiating various classes of soils. Can. J. soil sci.,46:13-22, 1966.
Mehra, o.P. & JaCKson, M.C. iron oxide removal from soil and clay by dithionite-citrate system buffered with sodium bicarbonate. in: national ConferenCe on ClaY Minerals, 7., new York, 1960. anais… new York, 1960. p.317-327.
MoKMa, d.l. & evans, C.v. Classification of soils: spodosols. in: suMner, M.e., ed. handbook of soil science. Boca raton, CrC Press, 1999. p.307-321.
Moreau, a.M.s.s.; Ker, J.C.; Costa, l.M. & GoMes, f.h. Caracterização de solos de duas toposseqüências em tabuleiros costeiros do sul da Bahia. r. Bras. Ci. solo, 30:1007-1019, 2006.
Moura filho, G. Caracterização e uso de solos arenosos associados à foz do rio são francisco, no litoral sul de alagoas. viçosa, MG, universidade federal de viçosa, 1998. 169p. (tese de doutorado)
oliveira, a.P.; Ker, J.C.; silva, i.r.; fontes, M.P.f.; oliveira, a.P. & neves, a. t.G. spodosols pedogenesis under Barreiras formation and sandbank environments in the south of Bahia. r. Bras. Ci. solo, 34:847-860, 2010. radaMBrasil. folha sf.21 CoruMBÁ. Geologia,
geomorfologia, pedologia, vegetação e uso potencial da terra. Ministério das Minas e energia – departamento nacional da Produção Mineral. rio de Janeiro, 1982. v.28. (levantamentos de recursos naturais, 27)
riGhi, d.; Bravard, s.; Chauvel, a.; ranGer, J. & roBert, M. In situ study of soil processes in an oxisol-spodosol sequence of amazonia (Brazil), soil sci., 150:438-445, 1990.
santos, r.d.; leMos, r.C.; santos, h.G.; Ker, J.C. & anJos, l.h.C. Manual de descrição e coleta de solo no campo. 5.ed. viçosa, MG, sociedade Brasileira de Ciências do solo, 2005. 100p.
soriano, B.M.a. & Galdino, s. análise das condições climáticas em 2000 na sub-região da nhecolândia, Pantanal, Mato Grosso do sul, Brasil. Corumbá, embrapa Pantanal, 2002. 33p. (embrapa Pantanal. Boletim de Pesquisa e desenvolvimento, 30)
van BreeMen, n. & BuurMan, P. soil formation. dordrecht, Kluwer academic Publishers, 1998. 337p.
van WaMBeKe, a. soils of the tropics-properties and appraisal. new York, McGraw-hill, 1992. 343p.
YeoMans, J.C. & BreMner, J.M. a rapid and precise method for routine determination of organic carbon in soils. Comm. soil sci. Plant anal., 19:1467-1476, 1988.