COMBINING ABILITY OF INBRED LINES OF MAIZE AND
STABILITY OF THEIR RESPECTIVE SINGLE-CROSSES
Aurélio Mendes Aguiar; Luciana Aparecida Carlini-Garcia; Adelmo Resende da Silva; Mateus Figueiredo Santos; Antonio Augusto Franco Garcia; Cláudio Lopes de Souza Jr.*
Depto. de Genética - USP/ESALQ, C.P. 83 - CEP: 13400-970 - Piracicaba, SP. *Corresponding author <[email protected]>
ABSTRACT: The utilization of diallel crosses for identification of superior combinations is a common practice in maize (Zea mays L.) breeding programs. This methodology allows the estimation of the combining ability of genotypes being evaluated. In this work, five inbred lines were evaluated as to their general (GCA) and specific (SCA) combining abilities, by using a complete diallel scheme. The single-crosses produced between these inbred lines were evaluated in seven environments, along with two checks, by using a randomized complete block design. Traits analized were: grain yield, plant height, ear height, ear placement, and prolificacy. A diallel analysis was carried out, following an adaptation of Griffing’s method IV, in addition to hybrid stability and adaptability analyses. Significant differences were detected for entries and environments for all traits. The interaction genotype vs. environment was significant for all traits. GCA’s were significant for all traits, while SCA’s were non-significant only for ear placement. For grain yield, both additive (GCA) and non-additive (SCA) effects were important, while for the remaining traits additive effects were more important. The high yielding single-cross was obtained from the cross of lines L-08-05F and L-38-05D. Those inbred lines showed higher GCA’s and their cross also had high SCA; also, it is responsive to environment improvements and reasonably stable. The second in rank high yielding single-cross, L-46-10D x L-08-05F, showed wide adaptability and stability.
Key words: diallel crosses, genotype vs. environment interaction, grain yield, adaptability
CAPACIDADE DE COMBINAÇÃO DE LINHAGENS ENDOGÂMICAS DE
MILHO E ESTABILIDADE DE SEUS RESPECTIVOS HÍBRIDOS
RESUMO: No melhoramento de milho (Zea mays L.), a utilização de cruzamentos dialélicos visando identificação de combinações superiores é uma prática comum. Esta metodologia visa estimar a capacidade de combinação dos materiais avaliados. Neste trabalho, cinco linhagens endogâmicas foram avaliadas quanto às capacidades gerais (CGC) e específica (CEC) de combinação, utilizando o esquema de dialelo completo. Os híbridos simples produzidos entre estas linhagens foram avaliados em sete ambientes, juntamente com duas testemunhas, tendo-se utilizado o delineamento de blocos casualizados. Avaliaram-se os caracteres: produção de grãos, altura da planta, altura da espiga, posição relativa da espiga e prolificidade. Realizou-se a análise dialélica, seguindo uma adaptação do método IV de Griffing, além das análises de estabilidade e adaptabilidade dos híbridos. Detectaram-se diferenças significativas para tratamentos e ambientes para todos os caracteres. A interação genótipos por ambientes foi significativa para maioria dos caracteres. As CGCs foram significativas para todos os caracteres, enquanto que a CEC foi não significativa apenas para posição relativa da espiga. Para o caráter produção de grãos, tanto os efeitos aditivos (CGC) quanto não aditivos (CEC) foram importantes, enquanto que para os demais caracteres, houve predominância dos efeitos aditivos. O híbrido mais produtivo foi obtido entre as linhagens L-08-05F e L-38-05D. Suas linhagens apresentaram elevadas CGCs e seu híbrido, elevada CEC, além de ter sido responsivo à melhoria das condições ambientais e razoavelmente estável. O segundo híbrido mais produtivo, L-46-10D x L-08-05F, mostrou ampla adaptabilidade e estabilidade.
Palavras-chave: cruzamentos dialélicos, interação genótipo ambiente, produção de grãos, adaptabilidade
INTRODUCTION
In addition to being an economically important crop, maize has genetic characteristics that allowed this species to be widely studied, thus contributing for an understanding of many questions of a genetic nature. Given the great economic importance of maize, genetic breeding in this crop is very intense, and mostly targeted at increasing grain yield. As with most crops, most of the
traits in maize have a quantitative inheritance (Hallauer et al., 1988). Thus, breeders have dedicated a great deal of effort in developing superior cultivars available to producers.
The performance of a hybrid is related to the general (GCA) and specific (SCA) combining abilities of the inbred lines involved in the cross (Sprague & Tatum, 1942). GCA is associated with additive effects of the genes, while SCA is related to dominance and epistatic effects (non-additive effects) of the genes. However, Rojas & Sprague (1952) verified that the variance of SCA also contains deviations due to the interaction between genotypes and environments, in addition to those that come from dominance and epistasis. The estimates of general (GCA) and specific (SCA) combining abilities of a group of inbred lines are obtained from the analysis of diallel crosses.
The study of stability and adaptability of genotypes evaluated under different environments is also very important for maize breeding programs (Vencovsky & Barriga, 1992). However, papers that try to link combining ability studies, using diallel crosses, to the performance analysis of these crosses when evaluated under different environments, by means of their adaptability and stability, are uncommon. Within this context, the objectives of this paper were to estimate, respectively, the general and specific combining abilities of five inbred lines of maize and their single-crosses, and to study the stability and adaptability of these crosses evaluated in seven environments.
MATERIAL AND METHODS
This project was carried out based on five maize inbred lines from the Maize Genetic Breeding Program of the Department of Genetics at Escola Superior de Agricultura “Luiz de Queiroz”/USP. The lines were: L-38-05D: is a yellow dent kernels inbred line extracted from the single-cross used as female for the commercial double-cross BR-201; L-46-10D: is a yellow dent kernels inbred line extracted from the BR-201; L-49-02D: is a yellow dent kernels inbred line extracted from the cross between populations BR-105 and BR-106; L-08-05F: is a orange flint kernels inbred line extracted from population IG1; L-36-07F: is a orange flint kernels inbred line extracted from the single-cross used as female for the commercial double-cross BR-201 .The ten single-crosses possible from the single-crosses of these lines were obtained, following a complete diallel scheme; reciprocal crosses were not included.
The single-crosses and two commercial hybrids, AG-9012 and Z-8452 as checks, were evaluated in experiments conducted in seven environments, during the 97/98 and 98/99 cropping seasons, according to a randomized complete block design (Steel & Torrie, 1980). During the 97/98 cropping season the experiments were conducted in Piracicaba (22° 42' S, 47° 38' W), at Caterpillar Experimental Station (environment 1 - E1) and at Areão Experimental Station (E2), and in Santa Cruz das Palmeiras (21° 50' S, 47° 16' W) at Empresa Agroceres Experimental Station (E3), in the state of São
Paulo, Brazil. In the 98/99 cropping season the experiments were conducted in the states of Paraná and São Paulo. In Paraná, two Experimental Stations from Coodetec (Cooperativa da Central Agropecuária de Desenvolvimento Tecnológico e Econômico Ltda.) were utilized, one located in Cascavel (E4), (24° 57' S, 53° 27' W) and the other in Palotina (E5), (24° 17' S, 53° 50' W). In the state of São Paulo, the experiments were conducted in Piracicaba, at Caterpillar (E6) and Areão (E7) Experimental Stations. Three replications were used in environments 4 and 5, and five replications in the remaining environments. Plots were 4 m long single-row and spaced 0.80 m between rows. Plots were overplanted and thinned to 20 plants plot-1 (62,500 plants
ha-1). All cultivation practices necessary for the
development of the crop were performed according to the technical recommendations for each environment.
Data were recorded for grain yield (GY), plant height (PH), ear height (EH), stand (ST), number of ears per plot (NE) and grain moisture. Grain yield per plot were corrected for grain moisture (15.5%) and then converted to kg ha-1. Prolificacy (PROL) was determined by the mean
number of ears per plant, i.e., PROL = NE/ST, and ear placement (EP) was computed by the ratio EP = EH/PH.
For each trait, individual analyses of variance were computed per environment, following the randomized complete block design, from which the joint analyses were obtained. The GY variable was corrected for average stand, considering stand as a covariate in the analyses of variance (Vencovsky & Barriga, 1992). The different combinations between years and locations were considered as distinct environments, totaling seven environments. Tukey tests were performed between adjusted means of entries from the joint analysis. The diallel analyses were performed using an adaptation of Griffing’s method IV (Griffing, 1956) for a complete diallel evaluated in several environments (Ferreira et al., 1993). This methodology is based in the following mathematical model:
ijk ijk jk ik ij j i k
ijk m l g g s ls e Y = + + + + +(lg) +(lg) +( ) +
for i < j, where: Yijkis the mean for cross i ×j, evaluated
in k environments; m is the general mean; lk is the effect
of the k-th environment; gi and gj are the effects of the
general combining abilities of lines i and j, respectively; sij is the specific combining ability between lines i and j;
ijk
e is the mean error associated with observation Yijk ; the
remaining parameters correspond to the interactions of the main effects with the environments. The diallel analyses were performed with the Mapgen software (Ferreira, 1999).
adaptability for grain yield was carried out according to Eberhart & Russell (1966) methodology, which is based on the linear regression model:
ijk ijk k ij ij
ijk I e
Y =β0 +β1 +δ +
where Yijk is the mean of the hybrid between lines i and j; β0ij is the general mean of the hybrid between lines i
and j; β1ij is the linear regression coefficient, which
measures the response of the hybrid between lines i and j, relative to the environmental variation; lk is the
environment index; δijkmeasures the regression
deviations; and eijk is the environmental mean error. The
coefficient of determination for the linear model was also estimated to identify the most stable genotypes (Cruz & Regazzi, 1994).
RESULTS AND DISCUSSION
Analyses of variance
There were significant differences in the individual analyses of variances (data not shown), for entries for all traits both in environments 1 and 2. In addition, there were significant differences for grain yield (GY), prolificacy (PROL) and plant height (PH) in environments 3 and 7, and for GY, ear placement (EP), and PROL in environment 6, while in environments 4 and 5 no differences for entries were detected for the traits evaluated. Three replications were used in these two environments, which must have contributed to decrease the precision of estimates and increase the residual mean square, consequently reducing the power of the F test
in detecting differences between entries. In the environments where five replications were used, the coefficients of variation (CVs) ranged from 11.71% to 17.16% for GY; from 4.42% to 5.61% for EP; from 10.47% to 16.12% for PROL; from 5.29% to 8.80% for EH; and from 3.66% to 4.64% for PH. In environments 4 and 5, in which three replications were used, the CVs were, respectively, 14.60% and 25.95% for GY; 14.35% and 15.80% for EP; 12.34% and 16.47% for PROL; 14.74% and 11.45% for EH; and 7.49% and 11.09% for PH. In the experiments evaluated with a smaller number of replications, a lower experimental precision was obtained, as expected. Even though the CV estimates in those experiments were high, they fall within the limits found in the literature, hence they did not compromise the utilization of the experiments in the analyses.
In the joint analysis of variance the source of variation for entries was partitioned into single-crosses and checks. There were significant differences for single-crosses and environments (P ≤ 0.01), for all traits
evaluated. The checks were different (P ≤ 0.01) only for
GY and PH. There were differences in the contrast single-crosses vs. checks (P≤ 0.01) for traits PH and EH, and
the checks means were lower than the single-crosses means. The interaction of the contrast single-crosses vs.
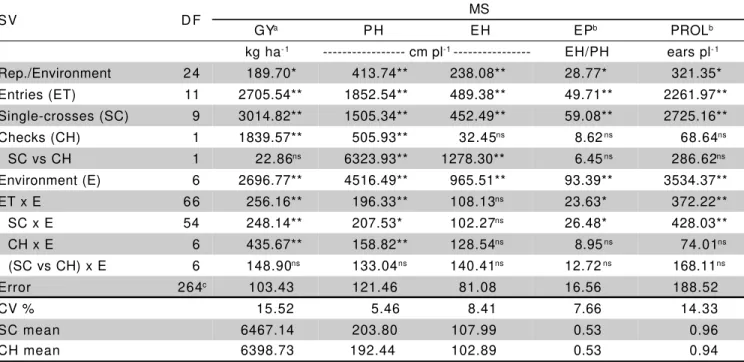
checks per environment was non-significant for all traits evaluated, showing that this contrast were not influenced by the alterations in environmental conditions. The interaction single-crosses vs. environments were significant for all traits, except for EH, indicating that the single-crosses presented differential performance in the environments used for evaluation. The interaction checks vs. environments were significant for the traits GY and PH, thus checks also showed differential performance for these traits in the environments under study. In the joint analyses of variances, the experimental coefficients of variation (CV%) estimates were 15.52% for GY, 7.66% for EP, 14.33% for PROL, 8.41% for EH, and 5.46% for PH, all within the limits reported in the literature (Table 1).
For the trait grain yield, the adjusted means of the single-crosses ranged from 4,938.56 kg ha-1
(L-36-07F × L-38-05D) to 8,212.95 kg ha-1 (L-08-05F ×
L-38-05D), and the average of all single-crosses (6,467.14kg ha-1) was not different from the checks mean (6,398.73
kg ha-1), which are commercial hybrids, by the
F test. For
plant height, the single-crosses mean was 203.80 cm plant-1, and ranged from 194.99 cm plant-1 to 214.59 cm
plant-1; the single-crosses mean differed significantly (
P
≤ 0.01) from the checks mean (192.44 cm plant-1). The
trait ear height showed a variation pattern similar to plant height, ranging from 102.01 cm plant-1 to 114.89 cm
plant-1; the average of the single-crosses (107.99 cm
plant-1) also differed significantly form the checks mean
(102.89 cm plant-1). For ear placement, the single-crosses
ranged from 0.50 (L-38-05D × L-36-07F) to 0.55 (L-38-05D × L-08-05F), and the average of the single-crosses and checks were equal (0.53). For prolificacy, which is one of the components of grain yield, the single-crosses means ranged from 0.85 ears plant-1 ((L-49-02D ×
L-36-07F) to1.10 ears plant-1 (L-46-10D × L-38-05D), and the
average of single-crosses (0.96 ears plant-1) also did not
differ from the checks mean (0.94 ear plant-1) (Tables 1
and 3).
Diallel analysis
The general combining ability (GCA) was highly significant (P ≤ 0.01) for all traits, which indicates that the
Table 1 - Values and significances of mean squares (MS) in the joint analyses of variance for grain yield (GY), ear placement (EP), prolificacy (PROL), ear height (EH) and plant height (PH).
aMS’s multiplied by 10-4; bMS’s multiplied by 104; c for GY the error DF is 263, ns Non significant; *P≤ 0.05; **P≤ 0.01.
Table 2 - Values and significances of mean squares (MS) from the diallel analyses for grain yield (GY), ear placement (EP), prolificacy (PROL), ear height (EH) and plant height (PH).
a, b, c MS multiplied by 10-4, 102 and 10-2, respectively; d Number of degrees of freedom for GY is 257; ns Non significant; *P ≤ 0.05; **P≤ 0.01.
Table 3 - Adjusted means of the single-crosses and general (GCA) and specific (SCA) combining ability estimates for grain yield (kg ha-1). SCA estimates in upper diagonal and means of crosses and checks in lower diagonal.
ns Non significant by t test , **P≤ 0.01 by t test. Means with a common letter are not different by Tukey test (P≤ 0.05).
Inbred Lines L-49-02D L-46-10D L-08-05F L-36-07F L-38-05D GCA
L-49-02D 75.17ns -1319.92** 737.42** 507.33** -294.49**
L-46-10D 6409.98cde 227.60** -217.36** -85.42ns 176.00ns
L-08-05F 5456.96fg 7571.03ab 497.09** 595.24** 686.61**
L-36-07F 5896.14def 5461.53fg 6628.56cd -1017.15** -1013.49**
L-38-05D 7129.05bc 6966.66bc 8212.95a 4938.56g 445.36**
AG 9012 5656.81efg
Z-8452 7140.65bc
SV D F MS
GYa PH EH EPb PROLc
kg ha- 1 --- cm pl-1 --- EH/PH ears pl- 1
Environments (E) 6 1.190.81** 760.27** 223.23** 0.25** 9.01**
Single-Crosses (SC) 9 757.19** 358.44** 107.73** 0.14* 6.49**
GCA 4 952.69** 646.02** 156.26** 0.25** 12.32**
SCA 5 600.79** 128.37* 68.91* 0.06ns 1.83**
SC x E 54 53.32** 55.04ns 28.66ns 0.08ns 1.04**
GCA x E 24 83.45** 59.45ns 38.81ns 0.11* 1.82**
SCA x E 30 29.22ns 51.52ns 20.53ns 0.05ns 0.43ns
Resíduo 264d 24.93 45.33 27.66 0.07 0.47
% GCA 55.92 80.10 64.46 76.92 84.34
% SCA 44.08 19.90 35.54 23.08 15.66
SV D F MS
GYa PH EH EPb PROLb
kg ha- 1 --- cm pl-1 --- EH/PH ears pl- 1 Rep./Environment 24 189.70* 413.74** 238.08** 28.77* 321.35* Entries (ET) 11 2705.54** 1852.54** 489.38** 49.71** 2261.97** Single-crosses (SC) 9 3014.82** 1505.34** 452.49** 59.08** 2725.16** Checks (CH) 1 1839.57** 505.93** 32.45ns 8.62ns 68.64ns SC vs CH 1 22.86ns 6323.93** 1278.30** 6.45ns 286.62ns Environment (E) 6 2696.77** 4516.49** 965.51** 93.39** 3534.37** ET x E 66 256.16** 196.33** 108.13ns 23.63* 372.22** SC x E 54 248.14** 207.53* 102.27ns 26.48* 428.03** CH x E 6 435.67** 158.82** 128.54ns 8.95ns 74.01ns (SC vs CH) x E 6 148.90ns 133.04ns 140.41ns 12.72ns 168.11ns
Error 264c 103.43 121.46 81.08 16.56 188.52
CV % 15.52 5.46 8.41 7.66 14.33
SC mean 6467.14 203.80 107.99 0.53 0.96
environments. Thus, the additive effects interacted more with environments than the non-additive effects. The contributions from GCA and SCA to the sum of squares of single-crosses, showed that the additive effects (GCA) were more important than non-additive effects (SCA) for all traits. The GCA contributions were higher than 64%, except for GY, whose GCA contribution was approximately 56%, indicating that the additive and non-additive effects were important for this trait (Table 2). The predominance of additive over non-additive effects is relatively common for grain yield (Gama et al., 1995; Beck et al., 1990). Eleutério et al. (1988) and Nass et al. (2000) reported that the additive and dominance effects for GY had similar magnitudes. The predominance of GCA verified in this study for all traits can be explained by the fact that the inbred lines utilized were selected for both per se and testcross performance, which is directly
associated with additive effects.
The general combining ability (GCA) estimates for grain yield ranged from -1,013.49 kg ha-1 (L-36-07F)
to 686.61 kg ha-1 (L-08-05F), while the specific combining
ability (SCA) estimates ranged from –1,319.92 kg ha-1
(L-49-02D × L-08-05F) to 737.42 kg ha-1 (L-49-02D ×
L-36-07F), and all estimates were significant, except for crosses L-46-10D × L-49-02D and L-46-10D × L-38-05D. The highest yielding single-cross (L-38-05D × L-08-05F) showed high SCA value, and the lines involved in this cross exhibited the highest GCA values. At least part of the genes associated with this trait have dominance genic action, and the inbred lines involved in this cross are genetically divergent among themselves, which was expected, since they belong to distinct heterotic groups. Then, the high SCA value of this cross along with positive and high GCA values from its inbred lines, afforded this single-cross to be the highest yielding in this set. Thus, both additive and non-additive effects (dominance and epistasis) contributed for the high productivity of this single-cross, which was also more productive than the superior commercial hybrid (Z-8452) (Table 3). Melo (2000), using commercial hybrids as parents in a 10 × 10 diallel, verified that 62% of the most productive hybrids showed significant and positive SCAs.
The general combining estimates for the trait plant height ranged from –7.24 cm plant-1 (L-46-10D) to
5.43 cm plant-1 (38-05D). Except for the inbred line
L-08-05F, the GCA effects were all significant. Lines L-49-02D and L-46-10D contributed toward reducing plant size, which is desirable, while lines L-36-07F and L-38-05D, contributed to increase plant height. The specific combining estimates ranged from –5.67 cm plant-1
(L-36-07F × L-46-10D) to 3.78 cm plant-1 (L-46-10D ×
L-49-02D), and both were significant. The general combining ability estimates for ear height ranged from –2.89 cm plant-1 (L-46-10D) to 4.18 cm plant-1 (L-08-05F). Line
L-49-02D also showed a negative GCA for EH. The specific combining ability estimates ranged from –4.52 cm plant-1
(L-49-02D × L-08-05F) to 2.96 cm plant-1 (L-49-02D ×
L-46-10D). The cross L-46-10D × L-36-07F showed a negative SCA value while SCA’s for the other crosses were non-significant (data not shown).
For the trait ear placement, the general combining abilities ranged from –0.0111 (L-38-05D) to 0.0139 (L-08-05F), being significant only for lines L-38-05D, L-36-07F and L-08-05F. The specific combining ability of this trait ranged from –0.0080 (L-36-07F × L-38-05D) to 0.0133 (L-08-05F × L-38-05D), and only the latter one was significant (Table 4). Ear placement trait must be maintained around 0.50, and since the means for this trait in all crosses were higher than 0.50, it is desirable that the general and specific combining abilities should contribute to reduce the mean of this trait.
The general combining ability (GCA) estimates for prolificacy were all significant and ranged from – 0.0920 ears plant-1 (L-36-07F) to 0.0837 ears plant-1
(L-46-10D). The specific combining abilities estimates ranged from –0.0647 ears plant-1 (L-08-05F × L-49-02D)
to 0.0468 ears plant-1 (L-38-05D × L-08-05F), both being
highly significant. The inbred lines that contributed the most to increase the number of ears per plant were L-46-10D, L-38-05D, and L-08-05F, and the other two inbred lines had negative GCAs values. The crosses showing the highest positive estimates of SCA for prolificacy were L-38-05D x L-08-05F, L-36-07F x L-49-02D, and L-46-10D × L-49-02D; the three other crosses had SCA estimates different from zero, but these estimates were negative (Table 4).
Stability and adaptability analysis
The analysis was performed only for grain yield, since this trait presents the greatest agronomical and economical importance. This analysis makes sense, since entries vs. environment interaction was highly significant (P ≤ 0.01) and, therefore, the both
single-crosses and checks showed differential performance across environments where they were evaluated.
The environmental indices ranged from – 2,030.00 kg ha-1 (Palotina 98/99-E5) to 1,161.04 kg ha-1
(Areão 98/99-E7). The most favorable environments were Areão 98/99 (E7) and Caterpillar 98/99 (E6). Environments Caterpillar 97/98 (E1), Areão 97/98 (E2), and Cascavel 98/99 (E4) also showed positive environmental indices, while Santa Cruz das Palmeiras 97/98 (E3) and Palotina 98/99 (E5) had negative environmental indices.
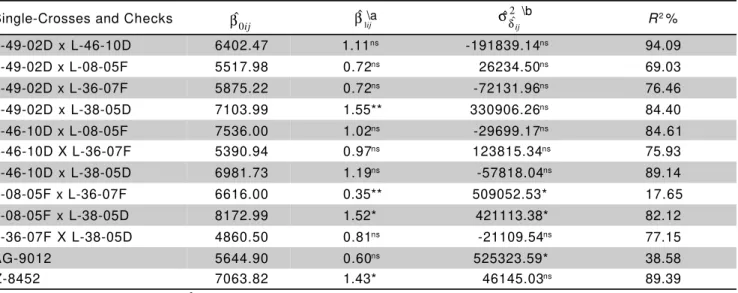
Stability and adaptability analysis for grain yield showed that only two crosses (L-08-05F × L-36-07F and L-08-05F × L-38-05D), and the check AG-9012, had significant regression deviations, indicating their low predictability (Table 5).
× L-36-07F showed a regression coefficient significantly lower than one, indicating that this cross is adapted to unfavorable environmental conditions. Crosses L-08-05F × L-38-05D and L-49-02D × L-38-05D, as well as the check Z-8452, were responsive to improvements in environmental conditions (β1ij >1). The other hybrids showed broad adaptability, i.e. the regression coefficients values did not differ significantly from 1 (β1ij =1). The two higher yielding single-crosses, L-08-05F x L-38-05D and L-46-10D × L-08-05F, had β1ij >1 and β1ij =1, respectively, i.e., the former was responsive to improvement in environmental conditions, while the latter showed wide adaptation. Furthermore, this last cross had a higher predictability, since the variance of regression deviations was non-significant. Even though cross L-08-05F × L-38-05D had a significant (P ≤ 0.05) variance of regression
deviations, its coefficient of determination (R2) was high.
Therefore, both crosses should be considerable stable, since their coefficients of determination were higher than 82% (Table 5).
Borsoi Filho (2000), evaluating inbred lines crossed with testers (testcrosses) in eight locations, verified that, within the group of most productive materials, 78% of the crosses showed wide adaptability. Based on the method by Eberhart & Russel (1956),
Schmildt (2000) verified that, from 18 high yielding hybrids, among 33 maize cultivars he evaluated in eight locations, 15 (83%) showed wide adaptability, one was stable and responsive to improvements in environmental conditions, and two were not responsive to improvement in environmental conditions.
Both additive and non-additive effects were important in the genetic control of grain yield. Nass et al.(2000); Hallauer & Miranda Filho (1988) and Eleutério et al. (1988) reported that, for grain yield, the additive and non-additive effects contribute quite similarly for the control of this character. The inbred lines showing the greatest effects of GCA for GY, L-38-05D and L-08-05F, also showed high positive GCA effect for EH (L-08-05F) and for PH (L-38-05D), and the cross between them was the most productive and showed the second highest SCA for GY. This evidence agrees with Hallauer & Miranda Filho (1988), which indicates a positive association between plant height and grain yield. The GCA estimates for PH and EH accounted for only 4% to the mean of these traits at most; SCA estimates also accounted for only 3% for PH and 4% for EH means, indicating that the contribution of general (GCA) and specific (SCA) combining abilities for the means of these traits were too low to be of any practical value.
Table 4 - General (GCA) and specific (SCA) combining abilities for ear placement (upper diagonal), and prolificacy (lower diagonal).
nsNon significant; *P≤ 0.05; ** P≤ 0.01.
Inbred Lines L-49-02D L-46-10D L-08-05F L-36-07F L-38-05D GCA
L-49-02D 0.0043ns -0.0072ns 0.0037ns -0.0008ns 0.0018ns
L-46-10D 0.0356* -0.0051ns 0.0053ns -0.0045ns 0.0061ns
L-08-05F -0.0647** -0.0082ns -0.0010ns 0.0133* 0.0139**
L-36-07F 0.0441** -0.0329* 0.0261ns -0.0080ns -0.0106*
L-38-05D -0.0150ns 0.0055ns 0.0468** -0.0372* -0.0111*
GCA -0.0695** 0.0837* 0.0308* -0.0920** 0.0469**
Table 5 - Stability and adaptability analysis for grain yield. Estimates of genotype means (βˆ0ij), linear regression coefficientss
(βˆ1ij), variances of regression deviations (
2 ˆ ˆ
ij δ
σ ), and coefficients of determination (R2).
at test: : 1
1
0 ij =
H β ; b Ftest: : ˆ2 0
ˆ
0 =
ij
H σδ ; nsNon significant; *P≤ 0.05; ** P≤ 0.01.
2 ˆ
ˆ ij
δ
σ
ij 0
ˆ
β βˆ1ij\a
\b
Single-Crosses and Checks R2 %
L-49-02D x L-46-10D 6402.47 1.11ns -191839.14ns 94.09
L-49-02D x L-08-05F 5517.98 0.72ns 26234.50ns 69.03
L-49-02D x L-36-07F 5875.22 0.72ns -72131.96ns 76.46
L-49-02D x L-38-05D 7103.99 1.55** 330906.26ns 84.40
L-46-10D x L-08-05F 7536.00 1.02ns -29699.17ns 84.61
L-46-10D X L-36-07F 5390.94 0.97ns 123815.34ns 75.93
L-46-10D x L-38-05D 6981.73 1.19ns -57818.04ns 89.14
L-08-05F x L-36-07F 6616.00 0.35** 509052.53* 17.65
L-08-05F x L-38-05D 8172.99 1.52* 421113.38* 82.12
L-36-07F X L-38-05D 4860.50 0.81ns -21109.54ns 77.15
AG-9012 5644.90 0.60ns 525323.59* 38.58
Received January 4, 2000 With regard to adaptability and stability in the
environments under study, the single-cross L-46-10D × L-08-05F, which ranked as the second for grain yield, showed wide adaptability and stability in the environments evaluated. On the other hand, the single-cross L-08-05F × L-38-05D, the highest yielding hybrid, was responsive to improvement in environmental conditions and, despite having a significant variance of regression deviations (P ≤ 0.05), it was stable (R2 > 82%)
under the environmental conditions in which the entries were evaluated.
ACKNOWLEDGEMENTS
To Dr. Waldemar Naspolini Filho, for conducting the experiments at Agroceres and COODETEC Experimental Stations. To CNPq, CAPES and FAPESP, for financial support.
REFERENCES
BECK, D.L.; VASAL, S.K.; CROSSA, J. Heterosis and combining ability of CIMMYT’S tropical early and intermediate maturity maize (Zea mays L.) germplasm. Maydica, v.35, p.279-285, 1990.
BORSOI FILHO, J.L. Capacidade combinatória de linhagens e herança da adaptabilidade e estabilidade avaliada em híbridos de milho. Viçosa, 2000. 185p. Tese (Doutorado) – Universidade Federal de Viçosa.
CRUZ, C.D.; REGAZZI, A.J. Modelos biométricos aplicados ao melhoramento genético. Viçosa: UFV, 1994. 390p.
EBERHART, S.A.; RUSSELL, W.A. Stability parameters for comparing varieties. Crop Science, v.6, p.39-40, 1966.
ELEUTÉRIO, A.; GAMA, E.E.G.; MORAIS, A.R. Capacidade de combinação e heterose em híbridos intervarietais de milho adaptados às condições de cerrado. Pesquisa Agropecuária Brasileira, v.23, p.247-253, 1988. FERREIRA, D.F. Desenvolvimento em Delphi de um software para estudos da estabilidade fenotípica. In: REUNIÃO ANUAL DA REGIÃO BRASILEIRA DA SOCIEDADE INTERNACIONAL DE BIOMETRIA, 44.; SIMPÓSIO DE ESTATÍSTICA APLICADA À EXPERIMENTAÇÃO AGRONÔMICA, 8., Botucatu, 1999. Resumos. Botucatu: UNESP, 1999. p.128.
FERREIRA, D.F.; REZENDE, G.D.S.P.; RAMALHO, M.A.P. An adaptation of Griffing’s method IV of complete diallel cross analysis for experiments repeated in several environments. Brazilian Journal of Genetics, v.16, p.357-366, 1993.
GAMA, E.E.G.; HALLAUER A.R.; FERRÃO, R.G. BARBOSA, D.M. Heterosis in maize single crosses derived from a yellow Tuxpeño variety in Brazil.
Revista Brasileira de Genética, v.18, p.81-85, 1995.
GRIFFING, B. Concept of general and specific combining ability in relation to diallel crossing systems. Australian Journal of Biological Science, v.9, p.463-493, 1956.
HALLAUER, A.R.; MIRANDA FILHO, J.B. Quantitative genetics in maize breeding. Ames: Iowa State University Press, 1988. 468p.
HALLAUER, A.R.; RUSSELL, W.A.; LAMKEY, K.R. Corn as a livestock feed. In: SPRAGUE, G.F.; DUDLEY, J.W. (Ed.) Corn and corn improvement. Madison: ASA, 1988. cap.8, p.941-963.
MELO, W.M.C. Divergência genética e capacidade de combinação entre híbridos de milho. Lavras, 2000. 73p. Dissertação – Universidade Federal de Lavras.
NASS , L.L.; LIMA, M.; VENCOVSKY, R.; GALLO, P.B. Combining ability of maize inbred lines evaluated in three environments in Brazil. Scientia Agricola, v.57, p.129-134, 2000.
ROJAS, B.A.; SPRAGUE, G.F. A comparison of variance components in corn yield trials: III. General and specific combining ability and their interaction with locations and years. Agronomy Journal, v.44, p.462-466, 1952. ROSSE, L.N. Modelo de regressão não-linear aplicado na avaliação da
estabilidade fenotípica em plantas. Piracicaba, 1999. 179p. Tese (Doutorado) – Escola Superior de Agricultura “Luiz de Queiroz”, Universidade de São Paulo.
ROSSE, L.N.; VENCOVSKY, R.; FERREIRA, D.F. Comparação de métodos de regressão para avaliar a estabilidade fenotípica em cana-de-açúcar.
Pesquisa Agropecuária Brasileira, v.37, p.25-32, 2002.
SCHMILDT, E.R. Correção de rendimento de parcelas, estratificação ambiental e adaptabilidade e estabilidade de cultivares de milho. Viçosa, 2000. 110p. il. Tese (Doutorado) – Universidade Federal de Viçosa.
SPRAGUE, G.F.; TATUM, L.A. General vs specific combining ability in single crosses of corn. Journal of the American Society of Agronomy, v.34, p.923-932, 1942.
STEEL, R.G.D.; TORRIE, J.H. Principles and procedures of statistics: a biometrical approach. 2. ed. New York: McGraw-Hill, 1980. 633p. VENCOVSKY, R.; BARRIGA, P. Genética biométrica no fitomelhoramento.