Mapping of quantitative trait loci for thermosensitive
genic male sterility in
indica
rice
Antonio Alberto Neves de Alcochete(1), Paulo Hideo Nakano Rangel(2) and Marcio Elias Ferreira(3)
(1)Universidade Agostinho Neto, Dep. Biologia, Av. 4 de Fevereiro no 7, Caixa Postal 815, Luanda, Angola. (2)Embrapa Arroz e Feijão, Caixa
Postal 179, CEP 75375-000 Santo Antônio de Goiás, GO, Brazil. E-mail: [email protected] (3)Embrapa Recursos Genéticos e
Biotecnologia, Laboratório de Genética, Caixa Postal 02372, CEP 70770-900 Brasília, DF, Brazil. E-mail: [email protected]
Abstract – The objective of this work was to select and use microsatellite markers, to map genomic regions associated with the genetic control of thermosensitive genic male sterility (TGMS) in rice. An F2 population,
derived from the cross between fertile and TGMS indica lines, was used to construct a microsatellite-based genetic map of rice. The TGMS phenotype showed a continuous variation in the segregant population. A low level of segregation distortion was detected in the F2 (14.65%), whose cause was found to be zygotic selection.
There was no evidence suggesting a cause-effect relationship between zygotic selection and the control of TGMS in this cross. A linkage map comprising 1,213.3 cM was constructed based on the segregation data of the F2 population. Ninety-five out of 116 microsatellite polymorphic markers were assembled into 11 linkage groups,
with an average of 12.77 cM between two adjacent marker loci. The phenotypic and genotypic data allowed for the identification of three new quantitative trait loci (QTL) for thermosensitive genic male sterility in indica rice. Two of the QTL were mapped on chromosomes that, so far, have not been associated with the genetic control of the TGMS trait (chromosomes 1 and 12). The third QTL was mapped on chromosome 7, where a TGMS locus (tms2) has recently been mapped. Allelic tests will have to be developed, in order to clarify if the two regions are the same or not.
Index terms: Oryza sativa, microsatellite, hybrid rice, genetic map.
Mapeamento de controladores de caracteres quantitativos de macho-esterilidade
gênica termossensível em arroz
indica
Resumo – O objetivo deste estudo foi selecionar e utilizar marcadores microssatélites, para mapear as regiões genômicas associadas ao controle genético de macho-esterilidade termossensível (TGMS) em arroz. Uma popu-lação F2, derivada do cruzamento entre linhagens indica fértil e TGMS, foi usada para construir um mapa
genético de arroz, baseado em marcadores microssatélites. O fenótipo TGMS analisado apresentou uma varia-ção contínua na populavaria-ção segregante. Um baixo nível de distorvaria-ção da segregavaria-ção foi detectado na populavaria-ção segregante (14,65%), e a seleção zigótica foi apontada como causa da distorção. Não houve evidência de relação de causa-efeito entre a seleção zigótica e o controle de TGMS nesse cruzamento. Um mapa de ligação com 1.213,3 cM foi construído, baseado nos dados de segregação da população F2. Noventa e cinco marcadores microssatélites,
de um total de 116 marcadores polimórficos, foram reunidos em 11 grupos de ligação, com uma média de 12,77 cM entre os locos marcadores adjacentes. Os dados fenotípicos e genotípicos permitiram a identificação de três novos locos controladores de caracteres quantitativos (QTL) para a macho-esterilidade gênica termossensível em arroz indica. Dois dos QTLs foram mapeados em cromossomos que não tinham, ainda, sido associados ao controle genético da característica TGMS (cromossomos 1 e 12). O terceiro QTL foi mapeado no cromossomo 7, onde um loco TGMS (tms2) foi recentemente mapeado. Testes alélicos deverão ser realizados para verificar se as regiões mapeadas são as mesmas.
Termos para indexação: Oryza sativa, microssatélite, arroz híbrido, mapa genético.
Introduction
The recent development of hybrid varieties of rice represents the most important contribution to improvements in rice yield, since the Green Revolution.
parental lines. In autogamous species, however, self-pollination represents a major limitation to hybrid seed production, unless an efficient and economic mechanism of pollen sterility is used in one of the parental lines, while the female reproductive system is kept intact.
The discovery of the cytoplasmic male sterility (CMS) in rice, in the 60’s, has allowed for the development of a strategy of hybrid rice production using the three-line system, i.e., male-sterile (A line), maintainer (B line) and restorer (R line). This system, although quite useful, usually (a) demands a high input of work for hybrid production, which threatens the sustainability of seed production at affordable prices, (b) relies on a few sources of male-sterile lines, specially wild abortive (WA) cytoplasm-induced male sterility, which favours genetic vulnerability of the derived hybrids, (c) demands great efforts from the breeding programs, since the male-sterile lines have to be adequately maintained by the B lines and restorer lines that can be efficiently exploited in hybrid combinations have to be identified and (d) since
japonica rice cultivars and basmati rice apparently do not carry restorer genes, hybrid production using
japonica lines is restricted to a long process of restorer gene transfer (Lang et al., 1999; Dong et al., 2000; Lopez & Virmani, 2000; Reddy et al., 2000; Virmani et al., 2003). Recently, the identification of a pollen sterility system dependent on temperature (Yuan, 1987; Sun et al., 1989; Zhang et al., 1991), known as the thermosensitive genic male sterility (TGMS), has contributed to obtain male-sterile lines under specific ranges of temperature, opening new perspectives for hybrid rice exploitation.
In general, TGMS lines become sterile when the environmental temperature is higher than 25–30°C, during the panicle initiation and anthesis stages, and turn back to a fertile condition, when the temperature drops to a level lower than 25–30°C. The TGMS system is, therefore, the basis for a two-line system for hybrid seed production in rice, characterized as simple, economic and efficient.
The understanding of the genetic control of thermosensitive genic male sterility (TGMS) in rice is important for the development of a sustainable hybrid rice seed industry in the tropics. As an alternative to some of the limitations of CMS system, the TGMS system does not require a maintainer line (B line) in hybrid seed production. The B lines of the CMS system, for example, should be routinely checked over the generations, to confirm if they are near isogenic to the A lines, which makes the routines of the CMS system more cumbersome (Beló, 2001). The TGMS system also does
not require a restorer line (R line), since TGMS plant can restore its fertility if it is grown in the appropriate temperature. In addition, the TGMS system reduces the risk of genetic vulnerability, since the expression of male sterility is not dependent on the cytoplasm, so the hybrids can be developed with diverse genetic backgrounds. This is of special concern after experiences which have led to great agronomic and economic losses due to intensive use of materials with the same genetic background, such as the T-cytoplasm used by the hybrid corn industry, which was afflicted by the southern corn leaf blight some decades ago (Levings, 1993).
The identification and use of different TGMS alleles in rice will provide a broader genetic base for hybrid rice development. In order to exploit this two-line system, it is necessary to evaluate the lines that present such behaviour, estimate the robustness of the expression of the trait in a range of temperatures, and also understand the genetic control of the trait to initiate gene deployment in cultivar development.
Genomic technology offers a plethora of techniques and strategies, which can potentially accelerate variety development in breeding programs. Molecular marker technologies such as RAPD, RFLP and AFLP, associated to Bulked Segregant Analysis (BSA) (Michelmore et al., 1991), have been recently used for mapping several TGMS loci. The DNA pooling approach has allowed the identification and mapping of four TGMS loci known as tms1 (chromosome 8 – Wang et al., 1995),
tms3(t) (chromosome 6 – Subudhi et al., 1997), tms4 (chromosome 2 – Dong et al., 2000) and a second locus also called tms4 (chromosome 9 – Reddy et al., 2000). The two loci named tms4 are certainly not the same, since they were mapped in different chromosomes. This calls the attention for the necessity to better discuss the nomenclature of TGMS loci in rice, as already pointed out by Reddy et al. (2000). An additional TGMS locus named tms2 (chromosome 7 – Maruyama et al., 1991) was mapped using the QTL mapping approach (Yamaguchi et al., 1997).
straightforward PCR and gel electrophoresis analysis (Rafalski et al., 1996). Its main disadvantage is the high cost of the initial investment necessary for marker development. However, the number of microsatellite markers available for a model species such as rice is high, and advantage can be taken of this technology in rice genetic research. Hundreds of microsatellite markers have been physically mapped in the rice genome and can potentially be used, as anchor markers, for comparative genetics, trait mapping and gene isolation. Mapping of TGMS loci has been based mostly on the assumption of a simple genetic control of the trait. For this purpose, plants in a segregating population have been classified in one of two classes, either sterile or fertile (Wang et al., 1995; Subudhi et al., 1997; Dong et al., 2000; Reddy et al., 2000). It should be noticed that the pollen sterility of segregating populations, derived from crosses between TGMS and fertile lines, does not follow a simple binary distribution. Attempts should be made, therefore, to map TGMS QTL using the percentual of sterile pollen measured in the segregating population, rather than classifying the lines in only two categories (male sterile or fertile).
The objective of this work was to select and use microsatellite markers to map genomic regions associated with the control of TGMS in indica rice.
Material and Methods
Plant material and male-sterility phenotypic analysis
Initially, a set of nine tropical TGMS lines (Lopez & Virmani, 2000) (IR68945-4-33-4-14-48, IR68935-16-6-27, IR68940-8-1-8-18-25-B, IR68944-6-23-5-4-15-B, IR1018-13-73-3-6, IR70977-16-5-4-1-12, IR90977-16-5-4-26, IR70989-3-19-3-14-3A, IR70978-8-22-5-14-13), kindly
provided by the International Rice Research Institute (IRRI), Phillipines, were evaluated for pollen fertility over a range of temperatures. One hundred plants of each line were germinated and grown in a screenhouse until the flowering stage. Samples of 20 plants each were then transferred to Tecnal Model 50 growth chambers, adjusted to temperatures of 21°C, 23°C, 25°C, 27°C and 29°C, with a photoperiod of 12/12 hours (light/dark), and humidity of 70%. After 14 days under these conditions, at least ten spikelets per plant were harvested from each line, in each temperature regime, for analysis. The harvests were performed during the morning period of three consecutive days.
The spikelets were fixed in 70% ethanol, treated with 1% iodine potassium iodide (IKI) solution, and smeared
on glass slides. Dark brown-stained and round pollen grains were scored as normal fertile, while yellowish or light brown colored and irregular-shaped pollen grains were scored as sterile. A total of 300 to 500 pollen grains were examined on each TGMS line submitted to each specific temperature, and the percentages of sterile pollen were recorded. This data was used to select one out of the nine TGMS lines to cross with a fertile line (IR50), in order to obtain a TGMS segregating F2 population.
This population was then used for mapping the genomic regions associated with the control of the TGMS trait. The selection criteria were the performance of the line in relation to the TGMS phenotype at a given temperature, and the estimate of the genetic distance between the TGMS line and the normal parental line (IR50), in order to maximize the detection of polymorphic markers for mapping purposes (Alcochete, 2005).
An F2 population of ninety-three individuals from a
cross between two indica lines, IR68945-4-33-4-14-48 (TGMS) x IR50 (fertile), was used in this study. The IR68945-4-33-4-14-48 line becomes sterile during anthesis stage when the temperature reaches 27°C, and turns back to fertility when temperature drops below 27°C. It is a strictly temperature-sensitive sterile line (Reddy et al., 2000), derived from the temperate
japonica TGMS mutant, Norin PL12 (Lopez & Virmani, 2000). Both parental lines, F1 and the F2 plants, were
germinated and grown in a screenhouse, until the flowering stage, when they were transferred to Tecnal Model 50 growth chambers adjusted to 27°C. Pollen sterility estimates (%) followed the conditions and protocols described above.
DNA extraction and quantification
DNA extraction was performed according to the procedures described by Ferreira & Grattapaglia (1998). DNA concentration was quantified using a UV Spectrophotometer Ultrospec 2000, and by visualization on 0,8% agarose gel electrophoreses stained with EtBr (10 mg mL-1), and visualized under UV light. Gels were
photo-documented using an Eagle Eye equipment. Band intensity was compared with λ DNA standards of 10, 50, 100 and 200 ng µL-1, and the final concentration was
adjusted to 200 ng µL-1.
Marker selection
labelled and analysed with an ABI 377 DNA sequencer (Applied Byosistems). Eighty microsatellite markers were selected from recent research on marker development in rice (Wu & Tanskley, 1993; Akagi et al., 1996; Panaud et al., 1996; Chen et al., 1997; Brondani, 2000; Temnykh et al., 2002). The unlabelled markers comprised 312 (67.53%) RM, 105 (22.73%) OG, 37 (8.01%) OS, and 8 (1.73%) STSG series markers. The fluorescent primers included 89 (45.18%) tetra, 20 (10.15%) tri, 38 (19.80%) di, and 50 (25.38%) of complex motif markers.
PCR and DNA polymorphism analysis
All pairs of unlabelled markers were amplified using Thermal Cycler PT-100 (MJ research) machines of 96 wells, in reactions of 13 µL of final volume, containing 9 ng of template DNA, 0.3 µM of each primer, 0.1 µL of 50% DMSO, 0.25 mM of each dNTP, 1.5 mM MgCl2,
1X reaction buffer, and 1 unit of Taq DNA polimerase. The PCR conditions were: 5 minutes hold at 94°C (melting step); 30 cycles of 94°C for 1 minute, 56°C for 1 minute and 72°C for 2 minutes; final extension step at 72°C for 7 minutes (Ferreira & Grattapaglia, 1998; Brondani, 2000; Beló, 2001). Annealing temperatures of some markers were adjusted to 52°C or 58°C. PCR reactions for the fluorescently labelled markers were performed separately, with a final reaction volume of 13 µL, and amplified by 30 cycles of 94°C for 1 minute, 55°C/58°C/60°C (according to the primers) for 1 minute, and 72°C for 2 minutes.
Population genotyping
Ninety-three F2 individuals, the two parental lines
(IR50 and IR68945-4-33-14-48), and the F1 generation
were genotyped using the informative markers obtained from DNA marker polymorphism screening. PCR products of unlabelled markers were separated and visualized, after electrophoresis, on 3.5% agarose gel with 0.15 mg mL-1 EtBr, or in 4% denaturing acrylamide
gel stained with silver nitrate (AgNO3). The fluorescent
markers were separated in 4% denaturing acrylamide gel using an ABI Prism 377 DNA Sequencer (Applied Biosystems). Before separation, 3 µL of PCR product were added to equal volume of formamide solution (4.5:0.5 µL of formamide: ROX 500), to prevent high salt concentration from negatively impacting the run. After the electrophoresis, the ABI Prism 377 sequencer software collected the data by automated fluorescence detection, in order to size and quantify the amplified fragments. The GeneScan Analysis Software v.3.1.2 (Applied Biosystems) determined the length of each
dye-labelled PCR product, by comparing the sizing curve of the size standard (ROX) with that of the sample fragments, while allele assignment was performed using the Genotyper software version 2.5.2 (Applied Biosystems).
Statistical analysis
The phenotypic TGMS data was tested for normality, kurtosis and skewness, using Lilliefors/Kolmogorov-Smirnov tests, with the GQMOL software version 2.1 (Cruz & Schuster, 2004).
Marker segregation was evaluated through the GQMOL software version 2.1 (Cruz & Schuster, 2004), applying the chi-square (χ2) statistical test for the
expected segregation ratio of 1:2:1, for co-dominant markers segregating in an F2 population with a
p-level = 0.001 (2 df). The Bonferroni correction factor was applied to the segregation data (Cruz & Schuster, 2004). Marker loci eventually showing segregation distortion were further analyzed for the nature of distortion, if gametic or zygotic. The nature of distortion was determined using sequential χ2 tests (Lorieux et al.,
1995). In the first test, the null hypothesis assuming equality of allele frequencies [Ho:p(A) = q(B)] was tested by χ2
(df = 1) = [(2np - n)2 + (2nq - n)2]/n, where
nAA is the number of homozygotes for O. sativa subsp.
indica var. IR50, nAB is the number of heterozygotes,
nBB is the number of homozygotes for O. sativa subsp.
indica var. IR68945-4-33-4-14-48 (TGMS), p(A) = nAA
+ nAB/2, p(B) = nBB + nAB/2, and n is the total number
of individuals in the population. Significant χ2 values are
an initial indication of gametic selection, resultant, therefore, from differences in alleles frequencies (p≠q) expressed through the selective advantage of a genotype over the others. In the second test, an evaluation of random mating under Hardy-Weinberg Equilibrium (HWE), with an expected distribution, expressed by the equation p2 + 2pq + q2 was tested by χ2
(df = 1) =
[(nAA - np2)2]/np2 + [(nAB - 2npq)2/2npq + [(nBB - nq2)2]/nq2].
The p2 is the expected number of homozygotes for the
variety IR50 (AA), 2pq is the expected number of heterozygotes (AB), and q2 is the expected number of
homozygotes for the variety IR68945-433-4-14-48 (BB). Significant χ2 values indicate that the observed genotypic
frequencies differ from the expected ones. Both tests are complementary and indicate the nature of the distortion (Lorieux et al., 1995). If the χ2 scores for both
tests or if the first test is not significant, but the second one is, then the type of selection is zygotic. If the χ2
Genetic mapping based on microsatellite markers
A genetic linkage map based on the genotypic F2 data
for the microsatellite markers, which were polymorphic between the parents, was constructed using MAPMAKER/EXP version 3.0 (Lincoln et al., 1992a). Only markers scored on 77 or more F2 individuals were
considered for analysis. A minimum LOD score of 3.0 and a maximum recombination frequency of 0.30 were used to group the microsatellite markers into potential linkage groups. Three-point and multipoint analyses were performed, to find the most probable locus order within eventual linkage groups observed. The final locus order of each linkage group was tested by removing one locus at a time and checking for inconsistencies. Double crossover events were examined, and the original scores re-checked before a final linkage group order was assigned. Recombination frequencies were corrected based on Kosambi’s map distance function, as executed by Mapmaker (Kosambi, 1944). Marker positions were confirmed with “ripple” and “try” commands to allow comparisons with published rice maps. The use of markers mapped by Brondani (2000), and those published in the Gramene database (Gramene, 2005) allowed the rapid identification of the linkage groups and setting up the positions of unlinked markers, according to rice chromosome nomenclature.
Detection of TGMS loci by χχχχχ2 contingency tables
Linkage between marker loci and TGMS QTL was tested by χ2 test in 3x3 contingency tables
, with three classes of genotypes
(AA; AB and BB) and three of phenotypes (0%–30%; 31%–60%, and ≥61% fertility), p-level = 0,001, 4 df (Preacher, 2001). This analysis was performed to com-pare the results with the analysis described below, based on continuous phenotypic data.
TGMS QTL mapping analysis
Mapping of quantitative trait loci based on continuous phenotypic data was performed using both single-point and interval-mapping analyses. A minimum LOD score of 3.0 was assumed, when using the MAPMAKER/QTL version 1.1 (Lincoln et al., 1992b), for interval mapping analysis. The QTL Cartographer (Basten et al., 2005) software allows for QTL analysis using single-point mapping methods, based on mapmaker files by linear regression and F tests. Single-point analysis was accomplished with linear regression, where the dependent variable was the trait score (% of sterile
pollen), and the independent one was the allele state at a locus. The proportion of phenotypic variance ( ) explained by a single QTL was computed as the square of the partial correlation coefficient (R2). Additive (d)
and dominance (h) effects were estimated as described by Lincoln et al. (1992b).
Results and Discussion
Distribution and segregation of male-sterility data
The TGMS trait has been usually studied under the assumption that one or a few loci would be involved in its control. In the majority of the mapping studies of TGMS loci, the phenotypic variation has been treated as binary data (i.e., sterile x normal). Therefore, despite the observation of a variation in pollen fertility ranging from 0% to 100%, in F2 plants derived from crosses
between fertile and TGMS lines, each plant has been simply classified in only one of two classes, i.e., either sterile or fertile.
This simplification can be advantageous for the detection of major genes, especially when a DNA pooling strategy such as BSA (bulked segregant analysis) is used (Michelmore et al., 1991), which has been the case in some studies (Wang et al., 1995; Subudhi et al., 1997; Dong et al., 2000; Reddy et al., 2000). In these studies, plants have been classified in only two classes, according to the percentage of pollen stained by IKI. For example, plants with less than 5% stained pollen were considered sterile, whereas plants having more than 50% stained pollen were classified as fertile in the study developed by Dong et al. (2000). A somewhat different scale considered plants with less then 20% stained pollen as sterile, whereas plants having more than 20% stained pollen as fertile have also been described (Reddy et al., 2000). This simplification of classifying the segregants into only two classes might limit the possibility of checking for the existence of more than one TGMS loci using the same segregating population.
Pollen fertility seems to be a complex trait, controlled by several loci that influence a number of pathways involved in pollen development. The continuous distribution of the thermosensitive sterility data, in segregating F2 populations, indicates that QTL analysis
observed in the F2 population studied here, showed a
distribution with mean and standard deviation of 38.72% and 30.95% of fertile pollen, respectively (Figure 1). The data does not fit a normal distribution, showing a skewness of 0.47 (p = 0.055) (slightly in direction of lower values of fertility), and kurtosis of -0.96 (p = 0.0012) (relatively flattened). The Lilliefors’s test for normal distribution indicated that the data is not normally distributed at a 5% level of significance (D = 0.13; p = 0.079). The coefficient of variation (CV) was high (79%). The same TGMS line used in this study (IR68945-4-33-4-14-48) was also employed by Reddy et al. (2000) to develop an F2 population, for mapping
TGMS loci. In that study, the F2 population presented a
distribution for pollen fertility that did not fit a 3:1 ratio expected for a recessive monogenic trait (Reddy et al., 2000). The TGMS segregating F2 population studied here
showed a phenotypic distribution (Figure 1), which is, therefore, continuous and certainly not binary.
Marker segregation
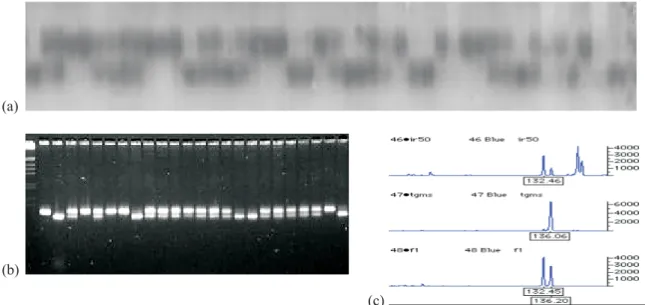
Although one of the criteria used for parental line selection was to maximize the genetic distance between the TGMS line and the fertile one, DNA polymorphism between the two parental lines was considered low from the onset of the experiment, corroborating the relatively small genetic distance estimated between them (Alcochete, 2005). One hundred and sixteen microsatellite markers were selected for QTL analysis,
showing a clear-cut segregation pattern between the two parental lines (Figure 2). Most markers showed a segregation ratio according to Mendelian expectations. However, seventeen markers (14.65%) showed distorted segregation (p<0.001), after applying the Bonferroni correction factor (Cruz & Schuster, 2004). The distorted markers were observed in chromosome 2 (RM244, RM263B, OS1 and OG93), chromosome 5 (RM7653 and RM7453), chromosome 8 (RM7452, M38, OG85 and RM14B), chromosome 9 (RM7576) and chromosome 12 (RM7113, RM247 and RM28B). A low level of distorted markers was expected in the segregating population, since the two parental lines showed a relatively high genetic similarity (Alcochete, 2005). The segregation distortion detected here (14.65%) is much lower than the observed in crosses involving
japonica and indica varieties, which may vary from 17% to 70% (Xu et al., 1997). However, it is higher than the segregation distortion (0.076%) recently reported in a cross between two photoperiod-sensitive genic male sterile indica varieties (He et al., 1999).
Eight of the distorted markers (RM7452, RM7653, RM248, RM38, OG85, RM7453, RM244, RM214B) showed distortion in favour of the parental line IR50; five markers (RM263b, RM7113, RM247, RM228a and RM7161) showed distortion in the direction of the parental line IR68945-4-33-4-14-48; three markers (OS11, OG93 and RM120) showed distortion in the direction of the heterozygote; and the marker RM7576 (0.86%) showed distortion in the direction of both homozygotes. Highly significant χ2 values for all
distorted markers were observed (p<0.0001), and data analysis (Lorieux et al., 1995) indicated zygotic selection as the cause of segregation distortion. Harushima et al. (1996) and Lyttle (1991) reported that deviation from expected Mendelian segregation ratios has been observed in the offspring of intra and interspecific hybrids of rice, and suggested that the cause of this deviation were the genetically linked segregation distortion factors affecting competition among gametes, or abortion of the gamete or zygote. Guiderdoni (1989) in a study of F2
progenies from five hybrids between indica and
japonica rice found that the cause of distortion was gametic selection, due to intervarietal sterility during gametogenesis. There is no evidence suggesting a cau-se-effect relationship between zygotic selection and the control of TGMS in the cross between IR68945-4-33-4-14-48 and IR50.
10 20 30 40
IR68945
IR50
0-10
Pollen fertility (%)
Frequency
11-20 21-30 31-40 41-50 51-60 61-70 71-80 81-90 91-100
Figure 1. Distribution of pollen fertility in the F2 segregating
Mapping of TGMS QTL in the rice genome
A linkage map comprising 1,213.3 cM was constructed based on the segregation data of the F2 population.
Ninety-five out of 116 microsatellite markers tested where assembled into 11 linkage groups, with an average of 12.77 cM between two adjacent marker loci, and about 8.6 markers per linkage group. To allow recombination between several markers of known positions in the rice genome, a θ value of 0.40 was initially used. The map was aligned with information of other genetic maps of the rice genome (Wu & Tanskley, 1993; Akagi et al., 1996; Panaud et al., 1996; Chen et al., 1997; Brondani, 2000; Temnykh et al., 2002).
Significant association between marker genotypes and the TGMS trait were initially tested by χ2 contingency
table analysis. For this purpose, the F2-segregating
individuals were classified in only three phenotypic clas-ses (0%–30%; 31%–60%, and >61% fertility), similar to what has been done in some other studies. Using this approach, only one marker (RM7012), located on chromosome 7, showed significant association with the TGMS trait (χ2
df = 4 = 6,567, p = 0.0020).
QTL analysis initially performed by single marker analysis also discriminated the marker RM7012 as
associated with a region controlling TGMS in rice (R2 = 13.74; p = 0.0003). Interval mapping analysis
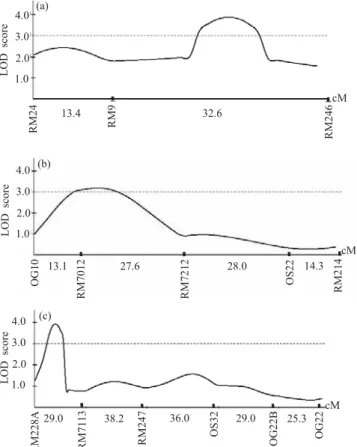
detected marker intervals significantly associated with TGMS with LOD scores above 3.00 (Figure 3). The region encompassing marker RM7012 in chromosome 7 was again detected as associated with the control of TGMS in rice, and two other genomic regions were also detected on rice chromosome 1 (interval RM9-RM246) and chromosome 12 (interval RM228A–RM247) not previously mapped. QTL mapping approach, based on the continuous distribution of the phenotypic data, was efficient in detecting other chromosomal regions, associated with the control of the TGMS trait that were not detected, when the phenotype was treated as a binary trait.
The main TGMS QTL mapped in this study, associated with marker RM7012, is located in rice chromosome 7
(LOD = 3.90; d = -20.73; h = 0.34; = 19.20), where the tms2 locus has been previously mapped (Yamaguchi et al., 1997; Lopez et al., 2003). The estimate of additive effect suggests that the IR68945-4-33-4-14-48 allele contributes to the reduction in fertility in this QTL, while dominance is negligible. Rice chromosome 7 also harbors a QTL associated with the genetic control of
photoperiod-Figure 2. Microsatellite marker genotyping of an F2 population derived from the cross between the parental lines O. sativa IR68945-4-33-4-14-48 (P1) x O. sativa IR50 (P2). (a) Segregation of alleles of marker OG11 in 4% polyacrylamide gel electrophoresis stained with silver nitrate; (b) Segregation of alleles of marker OS9 on agarose gel electrophoresis (3.5%) stained with ethidium bromide; (c) Electropherograms of marker RM7012 showing the genotypes of line IR50 (fertile), IR68945-4-33-4-14-48 (TGMS) and their F1. The vertical axes indicate fluorescence intensity measured by an ABI Prism 377 DNA Sequencer. Horizontal axes represent estimates of product sizes in base pairs. M = 1 Kb Ladder.
(a)
(b)
2002), F2 generation sterility (Li et al., 1997; Wang et al.,
2002) and pollen fertility (Li et al., 1997) have been located in the same chromosome.
The data also indicated a TGMS QTL in the interval RM228A–RM247, on chromosome 12 (LOD = 3.92; d = -10.99; h = 44.64;
σ
2p= 69.40). The estimate of the additive effectfor this QTL suggests that the allele from IR68945-4-33-4-14-48 reduces pollen fertility. However, overdominance was also detected, which is an effect of the allele contributed by IR50. A QTL for male-sterility sensitive to photoperiod (PGMS) was identified on chromosome 12 (Mei et al., 1999), as well as a QTL for pollen fertility (He & Xu, 2000). Two PGMS loci were mapped on chromosome 7 and 12 (Mei et al., 1999). Further experimentation should reveal the relationship between these regions and the TGMS QTL detected in the present study.TGMS genes should be transferred to lines with different genetic backgrounds, in order to maximize the chance for obtaining good hybrid combinations. The introgression of TGMS genes to genetically diverse rice lines can be aided by molecular marker information. The use of molecular markers in assisted breeding will certainly facilitate and speed up the process of TGMS genes introgression to a broad genetic background. Some efforts have recently been made in this direction (Lopez et al., 2003).
Microsatellite markers flanking TGMS QTL will be useful as selection tools to obtain TGMS lines for hybrid rice production. The marker intervals uncovered in this study can be used as references towards this goal. The two-line system based on the TGMS trait should be useful for hybrid rice production in a tropical country, such as Brazil. One approach would be to grow the TGMS line and the fertile parental line in regions where the average environmental temperature, during panicle initiation and anthesis stage, is higher than 25–30°C. There are a great number of regions that fit this requirement in specific seasons of the year in the country. TGMS lines should be tested to identify the geographic regions and seasons in which sterility expression is complete and fertility expression is maximum.
Conclusions
1. The QTL mapping approach is useful in the analysis of continuous variation, such as in the identification of genomic regions associated with the genetic control of the TGMS trait in indica rice.
Figure 3. TGMS QTL mapping based on interval mapping analysis of rice chromosomes. (a) TGMS QTL located on rice chromosome 1 (LOD = 3.90); (b) TGMS QTL located on rice chromosome 7 (LOD = 3.19); (c) TGMS QTL located on rice chromosome 12 (LOD = 3.92).
sensitive genic male-sterility (PGMS) and a QTL for pollen fertility (Doi et al., 1998). Further analysis is necessary, however, in order to verify the allelic relationships between the TGMS QTL detected in the present study, and the other regions associated with male-sterility described before (Yamaguchi et al., 1997; Doi et al., 1998; Lopez et al., 2003).
In chromosome 1 (Figure 3), the data indicated a TGMS QTL in the vicinity of interval encompassing markers RM9-RM246 (LOD = 3.19; d = -12.64; h = -51.35; = 74.70). Overdominance is recognized in a chromosomal location, if the ratio of the dominance effect to the absolute value of the additive effect is larger than the unity. The value of d and h suggests that the IR68945-4-33-4-14-48 allele contributes to the reduction in pollen fertility in this QTL and shows overdominance. QTL for spikelet sterility (Li et al., 1997; Nagata et al.,
32.6 13.4
cM
LOD
score
4.0 3.0 2.0 1.0
RM24
RM246
RM9
(a)
13.1
13.1 27.6 28.0 14.3
cM 4.0
3.0 2.0 1.0
LOD
score
OG10
RM7012 RM7212
OS22
RM214
(b)
cM 29.0 38.2 36.0 29.0 25.3
LOD
score
4.0 3.0 2.0 1.0
RM228A RM71
13
RM247 OS32 OG22B OG22
2. Three QTL for thermosensitive genic male sterility are now mapped in rice chromosomes 1, 7 and 12.
3. Data analysis based on the phenotypic classification of F2 individuals, in only two categories (sterile or fertile),
allows for the identification of only one of the three regions associated with TGMS control, located in rice chromosome 7.
Acknowledgements
To Dr. Péricles C.F. Neves, for helping with the phenotypic evaluation of the TGMS trait; to MCT/CNPq/PADCT for financial support of the Project 62.0202/98-0; to the Brazil-Angola PEC-PG Program, for providing a graduate student scholarship to Antonio Alberto Neves de Alcochete.
References
AKAGI, H.; YOKOZEKI, Y.; INAGAKI, A.; FUJIMURA, T. Microsatellite DNA markers for rice chromosomes. Theoretical and Applied Genetics, v.93, p.1071-1077, 1996.
ALCOCHETE, A.A.N. Diversidade genética e mapeamento de QTLs do sistema gênico de macho-esterilidade termo-sensível (TGMS) do genoma de arroz (Oryza sativa L.). 2005. 293p. Dissertação (Doutorado) - Universidade de Brasília, Brasília. BASTEN, C.J.; WEIR, B.S.; ZENG, Z.B. QTL cartographer version 1.17: a reference manual and tutorial for QTL mapping. Raleigh, USA: North Carolina State University, 2005. 190p. BELÓ, A. Avaliação de recursos genéticos para produção de híbridos de arroz (Oryza sativa L.). 2001. 104p. Dissertação (Mestrado) - Universidade Federal de Santa Catarina, Florianópolis. BRONDANI, C. Desenvolvimento de marcadores microssatélites, construção de mapa genético interespecífico de Oryza glumaepatula x O. sativa e análise de QTLs para caracteres de importância econômica. 2000. 226p. Dissertação (Doutorado) - Universidade de Brasília, Brasília.
CHEN, X.; TEMNYKH, S.; XU, Y.; CHO, Y.G.; McCOUCH, S.R. Development of a microsatellite framework map providing genome-wide coverage in rice (Oryza sativa L.). Theoretical and Applied Genetics, v.95, p.553-567, 1997.
CRUZ, C.D.; SCHUSTER, I. GQMOL: genética quantitativa e molecular. Laboratório de Bioinformática. Universidade Federal de Viçosa. Available at: <http://www.ufv.br/dbg/home3.html>. Accessed on Dec. 1st, 2004.
DOI, K.; YOSHIMURA, A.; IWATA, N. RFLP mapping and QTL analysis of heading date and pollen sterility using backcross population between Oryza sativa L. and Oryza glaberrima Steud.
Breeding Science, v.48, p.395-399, 1998.
DONG, N.V.; SUBUDHI, P.K.; LUONG, P.N.; QUANG, V.D.; QUY, T.D.; ZHEN, G.H.G.; WANG, B.; NGUYEN, H.T. Molecular mapping of a rice gene conditioning thermosensitive genic male sterility using AFLP, RFLP and SSR techniques. Theoretical and Applied Genetics, v.100, p.727-734, 2000.
FERREIRA, M.E.; GRATTAPAGLIA, D. Introdução ao uso de marcadores moleculares em análise genética. 3.ed. Brasília: Embrapa-Cenargen, 1998. 220p.
GRAMENE database. Available at: <http://www.gramene.com>. Accessed on: Jan. 2005.
GUIDERDONI, E. Comparative gametic selection in sexual and anther culture derivatives from five distant F1 hybrids of rice. Rice
Genetic Newsletter, v.6, p.91, 1989.
HARUSHIMA, Y.; KURATA, N.; YANO, M.; NAGAMURA, Y.; SASAKI, T.; MINOBE, Y.; NAKAGAHRA, Y. Detection of segregation distortions in an indica-japonica rice cross using a high-resolution molecular map. Theoretical and Applied Genetics, v.92, p.145-150, 1996.
HE, Y.Q.; XU, C.G. Importance of epistasis as the genetic basis of sterility instability for photoperiod-sensitive genic male sterile rice.
Acta Botanica Sinica, v.42, p.1062-1068, 2000.
HE, Y.Q.; YANG, J.; XU, C.G.; ZHANG, Z.G.; ZHANG, Q. Genetic bases of instability of male sterility and fertility reversibility in photoperiod-sensitive genic male-sterile rice. Theoretical and Applied Genetics, v.99, p.683-693, 1999.
KOSAMBI, D.D. The estimation of map distances from recombination values. Annals of Eugenetics, v.12, p.172-175, 1944. LANDER, E.S.; BOTSTEIN, D. Mapping mendelian factors underlying quantitative traits using RFLP linkage maps. Genetics, v.121, p.185-199, 1989.
LANG, N.T.; SUBUDHI, P.K.; VIRMANI, S.S.; BRAR, D.S.; KHUSH, G.S.; LI, Z.; HUANG, N. Development of PCR-based markers for thermosensitive genetic male sterility gene tms3(t) in rice (Oryza sativa L.). Hereditas,v.131, p.121-127, 1999. LEVINGS, C.S. III. Thought on cytoplasmic male-sterility in cms-T maize. Plant Cell, v.5, p.1285-1290, 1993.
LI, H.B.; WANG, J.; LIU, A.M.; LIU, K.D.; ZHANG, Q.; ZOU, J.S.; ZHANG, Q.F. Genetic basis of low-temperature-sensitive sterility in indica-japonica hybrids of rice as determined by RFLP analysis. Theoretical and Applied Genetics, v.95, p.1092-1097, 1997.
LINCOLN, S.; DALY, M.; LANDER, E.S. Constructing genetic maps with MAPMAKER/EXP 3.0. 3rd ed. Cambridge: Whitehead Institute Technical Report, 1992a. 97p.
LOPEZ, M.T.; TOOJINDA, T.; VANAVICHIT, A.; TRAGOONRUNG, S. Microsatellite markers flanking the tms2 gene facilitated tropical TGMS rice line development. Crop Science, v.43, p.2267-2271, 2003.
LOPEZ, M.T.; VIRMANI, S.S. Development of TGMS lines for developing two-line rice hybrids for the tropics. Euphytica, v.114, p.211-215, 2000.
LORIEUX, M.; PERRIER, X.; GOFFIRET, B.; LANAUD, C.; GONZALEZ DE LEON, D. Maximum-likelihood models for mapping genetic markers showing segregation distortion. 2. F2 populations. Theoretical and Applied Genetics, v.90, p.81-89, 1995.
LYTTLE, T.W. Segregation distorters. Annual Review of Genetics, v.25, p.511-557, 1991.
MARUYAMA, K.; ARAKI, H.; KATO, H. Thermosensitive genetic male sterility induced by irradiation. In:RICE GENETIC II. Manila, Philippines: International Rice Research Institute, 1991. p.227-235. MEI, M.H.; DAI, X.K.; XU, C.G.; ZHANG, Q. Mapping and genetic analysis of the genes for photoperiod-sensitive genic male sterility in rice using the original mutant Nongken 58S. Crop Science, v.39, p.1711-1715, 1999.
MICHELMORE, R.W.; PARAN, I.; KESSELI, R.V. Identification of markers linked to disease-resistance genes by bulked segregant analysis: a rapid method to detect markers in specific genomic regions by using segregating populations. Proceedings of the National Academy of Sciences of the United States of America, v.88, p.9828-9832, 1991.
NAGATA, K.; FUKUTA, Y.; SHIMIZU, H.; YAGI, T.; TERAO, T. Quantitative trait loci for sink size and ripening traits in rice (Oryza sativa L.). Breeding Science, v.52, p.259-273, 2002. PANAUD, O.; CHEN, X.; McCOUCH, S.R. Development of microsatellite markers and characterization of simple sequence length polymorphism (SSLP) in rice (Oryza sativa L.). Molecular and General Genetics, v.252, p.597-607, 1996.
PATERSON, A.H.; DAMON, S.; HEWITT, J.D.; ZAMIR, D.; RABINOWITCH, H.D.; LINCOLN, S.E.; LANDER, E.S.; TANKSLEY, S.D. Mendelian factors underlying quantitative traits in tomato: comparison across species, generations and environments.
Genetics, v.127, p.181-197, 1991.
PREACHER, K.J. Calculation for the chi-square test: an web-based interactive calculation tool for chi-square tests of goodness of fit and independence [Computer software]. Available at: <http://www.unc.edu/~preacher/chisq/chisq.htm>. Accessed on Dec. 2001.
RAFALSKI, J.A.; VOGEL, J.M.; MORGANTE, M.; POWELL, W.; ANDRE, C.; TINGEY, S.V. Generating and using DNA markers in plants. In: BIRREN, B.; LAI, E. (Ed.). Nonmammalian genome analysis: a practical guide. San Diego: Academic, 1996. p.75-134. REDDY, O.U.K.; SIDDIQ, E.A.; SARMA, N.P.; ALI, J.; HUSSAIN, A.J.; NIMMAKAYALA, P.; RAMASAMY, P.; PAMMI, S.; REDDY, A.S. Genetic analysis of temperature-sensitive male sterility in rice. Abstract, v.100, p.794-801, 2000.
SUBUDHI, P.K.; BORKAKATI, R.K.; VIRMANI, S.S.; HUANG, N. Molecular mapping of a thermo-sensitive genetic male sterility gene in rice using bulked segregant analysis. Genome, v.40, p.188-194, 1997.
SUN, Z.X.; MIN, S.K.; XIONG, Z.M. A temperature-sensitive male sterile line found in rice. Rice Genetics Newsletter, v.6, p.116-117, 1989.
TANSKLEY, S.D.; YOUNG, N.D.; PATERSON, A.H.; BONIERBALE, M.W. RFLP mapping in plant breeder new tools for an old science. Biotechnology, v.7, p.257-264, 1989.
TEMNYKH, S.; DECLERCK, G.; LUKASHOVA, A.; LIPOVICH, L.; CARTINHOUR, S.; McCOUCH, S. Computational and experimental analysis of microsatellites in rice (Oryza sativa L.): frequency, length variation, transposon associations, and genetic marker potential. Genome Research, v.11, p.1441-1452, 2002. VIRMANI, S.S.; KHUSH, G.S.; PINGALI, P.L. Hybrid seed production, development and security of major cereal crops.In: PAROLA, R.S.; RAI, M. (Ed.). Hybrid research and development needs in major cereals in the Asia-Pacific region. Bangkok: FAO, 1994. p.61-86.
VIRMANI, S.S.; SUN, Z.X.; MOU, T.M.; JAUHAR ALI, A.; MAO, C.X. Two-line hybrid rice breeding manual. Los Baños, Phillipines: International Rice Research Institute, 2003. 88p. WANG, B.; XU, W.W.; WANG, J.Z.; WU, W.; ZHENG, H.G.; YANG, Z.Y.; HUANG, N.; RAY, J.D.; NGUYEN, H.T. Tagging and mapping the thermo-sensitive genic male-sterile gene in rice with molecular markers. Theoretical and Applied Genetics, v.91, p.1111-1114, 1995.
WANG, C.M.; YASUI, H.; YOSHIMURA, A.; WAN, J.M.; ZHAI, H.Q. Identification of quantitative trait loci controlling F2 sterility and heading date in rice. Acta Genetica Sinica, v.29, p.339-342, 2002. WEBER, J.L.; MAY, P.E. Abundant class of human DNA polymorphisms which can be typed using the polymerase chain reaction. American Journal of Human Genetics, v.44, p.388-396, 1989.
WU, K.S.; TANKSLEY, S.D. Abundance, polymorphism and genetic mapping of microsatellites in rice. Molecular and General Genetics, v.241, p.225-235, 1993.
XU, Y.; ZHU, L.; XIAO, J.; HUANG, N.; McCOUCH, S.R. Chromosomal regions associated with segregation distortion of molecular markers in F2, backcross, doubled haploid, and recombinant inbred populations in rice (Oryza sativa L.). Molecular and General Genetics, v.253, p.535-545, 1997.
YAMAGUCHI, Y.; IKEDA, R.; HIRASAWA, H.; MINAMI, M.; UJIHARA, P. Linkage analysis of thermosensitive genic male sterility gene, tms-2 in rice (Oryza sativa L.). Breeding Science, v.47, p.371-373, 1997.
YUAN, L.P. Strategy conception of hybrid rice breeding. Hybrid Rice, v.1, p.1-3, 1987.
ZHANG, Z.G.; YUAN, S.C.; ZEN, H.L.; LI, Y.Z.; LI, Z.C.; WEI, C.L. Preliminary observation of fertility changes in the new type temperature sensitive male sterile rice: TVA hybrid rice. Hunan, China: Hybrid Rice Research Center, 1991. v.1, p.31-34.