Genetic characterization of cotton landraces found in the Paraíba
and Rio Grande do Norte states
Ivandilson Pessoa Pinto de Menezes1*, Lúcia Vieira Hoffmann2 and Paulo Augusto Vianna Barroso2
Received 20 April 2013 Accepted 10 May 2014
Abstract – The objective of this study was to estimate genetic diversity of cotton mocó planted in Paraíba and Rio Grande do Norte using microsatellite markers, since mocó landraces are a valuable source of genetic diversity. A set of 38 accessions - 21 plants from Rio Grande do Norte and 17 from Paraiba - was analyzed using 24 pairs of cotton microsatellite primers, which amplified 20 polymorphic loci. The average inbreeding was 0.432, and was slightly higher in individuals from Paraíba than from Rio Grande do Norte. Genetic diversity (Nei´s unbiased estimator) between individuals from each state’s populations had similar values (HT = 0.327 and 0.302 in Paraíba and Rio Grande do Norte, respectively), indicating that comparable variability has been maintained. Moreover, the proportion of diversity between populations was extremely low (DST = 0.007), but expressive between mesoregions (DST = 0.069). These data led us to conclude that the genetic similarities between populations are high.
Key words: Gossypiumhirsutum, genetic structure, microsatellite markers, conservation. Crop Breeding and Applied Biotechnology 15: 26-32, 2015
Brazilian Society of Plant Breeding. Printed in Brazil
ARTICLE
http://dx.doi.org/10.1590/1984-70332015v15n1a4
1 Instituto Federal Goiano, Rodovia Geraldo Silva Nascimento, km 2.5, 75.790-000, Urutaí, GO, Brazil. *E-mail: ivan.menezes@ifgoiano.edu.br 2 Embrapa Arroz e Feijão, Núcleo Avançado do Algodão, Rodovia GO-462, km 12, 75.375-000, Santo Antônio de Goiás, GO, Brazil
INTRODUCTION
Mocó cotton originated from landraces restricted to Northeast Brazil belonging to the species G. hirsutum race marie galante (Giband et al. 2010). The area planted with mocó cotton reached approximately two million hectares during the 1970’s and was drastically reduced, initially due to a long series of droughts by the 1979-1983, followed by the hit of boll weevil in 1983 (Menezes et al. 2010). Mocó landraces were planted in the region of Seridó during the end of the nineteenth century and beginning of the twentieth century (Moreira et al. 1994). Local breeding programs started at 1920, and gained importance with the coordina-tion by Superintendência do Desenvolvimento do Nordeste since 1963 (Moreira et al. 1982), and Embrapa cotton since 1975. Landraces continued to be planted (Moreira et al. 1972). Mocó cotton was cultivated as a perennial crop, remaining in the field for around five years, and production of around 400 kilograms per hectare per year (Embrapa 1975, 1997). Subsistence farming usually associated the cattle pasture after harvesting. Nowadays, mocó is rarely found as a crop, but is frequently found as backyard plant (Menezes et al. 2010).
The most cultivated cotton worldwide is developed of
only species Gossypium hirsutum race latifolium. Thus mocó cotton, which is sexually compatible to cultivated cotton (Borém et al. 2003), becomes an important allelic source to expand genetic base upland cotton. Valuable traits as glandless lines (Stipanovic et al. 2005) or resistance to abiotic can possibly be exploited.
Germplasm collections of wild and domesticated cotton in Brazil have been made since 1920 (Campbell et al. 2010). Despite the maintenance of ex situ collections, an increased loss of diversity occurs in situ, caused by changes to eco-nomical and cultural habits (Almeida et al. 2009, Menezes et al. 2010), and preservation strategies must be constantly renewed. The knowledge of genetic diversity and structure may nowadays be applied both as a resource to improve genetic diversity of breeding populations and to establish conservation measures for in situ and ex situ preservation (Negri and Tiranti 2010, Carvalho et al. 2014).
used to obtain genetic maps (Zhang et al. 2014), genetic characterization of germplasm (Bertini et al. 2005, Almeida et al. 2009), genetic of nature populations (Alves et al. 2013), detect gene flow (Dantas et al. 2012), correlation between traits performance and SSR markers (Zhen et al. 2009, Xiao et al. 2010).
The analysis of mocó cotton collected in Northeast Brazil by 12 SSR markers showed genetic differentiation of plants collected in Ceará, attributed to a particular breeding program, and plants collected in Piauí, with a marked contribution of
G. barbadense, while plants collected in Paraíba and Rio Grande do Norte were very similar (Menezes et al. 2010). The aim of this work was to improve the estimative of the genetic diversity among plants of Gossypium hirsutum L. race marie galante collected in Rio Grande do Norte and Paraíba states using a greater number of SSR markers.
MATERIAL AND METHODS
Mocó plants were collected in 2005 (https://www.cnpa. embrapa.br/albrana/), in ten counties of Paraíba and six counties of Rio Grande do Norte (Menezes et al. 2010) were grouped in mesoregions (Table 1), defined by the Brazilian Institute of Geography and Statistics (IBGE). The leave samples were collected from the plants in situ in 50 mL tubes filled with TE buffer (0.5 M Tris HCl and EDTA pH 8.0). The tubes were transported to the laboratory and frozen at -20 °C until DNA extraction.
Genomic DNA was extracted from leafs, and not from seeds as in the previous study of those plants (Menezes et
al. 2010). An amount of 40 to 50 mg of the frozen leaf tis-sue was used to extract DNA according to the CTAB 2% (cetyltrime thylammonium bromide) protocol. DNA was quantified on 0.8% (w/v) agarose gels by comparison to known quantities of the λ phage DNA (50, 100, 200 and 300 ng), stained with ethidium bromide. It was diluted in TE buffer to a working concentration of 10 ng µL-1.
The PCR reactions in a final volume of 20 μL contained 25 ng of genomic DNA, 1X PCR buffer (10 mM Tris-HCl, 50 mM KCl pH 8.3 and 0.1% Triton X-100); 2.0 mM MgCl2; 0.2 mM dNTP; 0.6 U Taq DNA polymerase and 0.2 mM of each primer pair. The 24 microsatellite markers used in this study were developed specifically for cotton by Nguyen et al. (2004). Three of them (CIR203, CIR246 and CIR249) have been previously used to study the genetic structure of the collected mocó plants (Menezes et al. 2010), and the remained 23 (CIR09, CIR20, CIR34, CIR38, CIR40, CIR43, CIR49, CIR81, CIR94, CIR97, CIR105, CIR107, CIR121, CIR143, CIR170, CIR179, CIR185, CIR202, CIR251, CIR262 and CIR381) have not been previously used for those populations.
Amplification reactions used an initial denaturation step at 94 °C for 12 min, followed by 35 cycles of denaturation at 94 °C for 30 s, annealing temperature recommended for each primer according to Nguyen et al. (2004) for 1 minute and extension at 72 °C for 1 min. A final extension step of 5 min at 72 °C was added. PCR products were denatured by addition of 10 µL of loading buffer (formamide 95%, 10 mM EDTA, bromophenol blue 0.5% (w/v) and
xylene-Table 1. Geographic localization and number of collected genotypes at each county, according to mesoregions of the Paraíba (Borborema and Sertão Paraibano) and Rio Grande do Norte States (Central Potiguar and Oeste Potiguar)
Mesoregion Counties Latitude/Longitude Nr. of genotype
Borborema São Mamede 6° 53’ 5.34’’ S/37° 3’ 4.14’’ W 3
Pedra Lavrada 6° 45’ 23.52’’ S/36° 28’ 7.26’’ W 1
Sertão Paraibano
Quixabá 7° 1’ 4.68’ ‘S/37° 4’ 56’’ W 4
Piancó 7° 15’ 0.6’’ S/ 38° 3’ 8.4’’ W 1
Santa Inês 7° 43’ 26.58’’ S/38° 33’ 33.42’’ W 3
Ibiara 7° 28’ 29.22’’ S/38° 19’ 13.5’’ W 1
Pedra Lavrada 7° 25’ 37.92’’ S/38° 15’ 9.24’’ W 1
Itaboranga 7° 13’ 3.9’’ S/38° 1’ 17.16’’ W 1
São Bentinho 6° 50’ 48’’ S/37° 42’ 14.76’’ W 1
Catolé do Rocha 6° 19’ 28.2’’ S/37° 40’ 30.3’’ W 1
Central Potiguar
Caicó 6° 26’ 26.04’’ S/7° 10’ 50.04’’ W 2
São José do Seridó 6° 27’ 49.44’’ S/36° 59’ 7.92’’ W 1
Serra Negra do Norte 6° 40’ 20.28’’ S/37° 25’ 28.44’’ W 7
Acari 6° 33’ 5.94’’ S/36° 41’ 24.66’’ W 1
Parelhas 6° 44’ 20.82’’ S/36° 37’ 10.26’’ W 1
Oeste Potiguar Jucurutu 5° 59’ 26.7’’ S/36° 58’ 57.84’’ W 9
cyanol), heated for 5 min at 95 °C, chilled on ice and then 5 µL of the denatured PCR products were loaded on a 6% (w/v) polyacrylamide gel containing 7.0 M of urea in 1X TBE buffer. Gels were run for 3 h at 70 watts. Following electrophoresis, the gel was silver-stained.
As SSR are codominant markers, the numbers (1) to (4) were used to designate each allele for locus. Then an allelic matrix was elaborated. The polymorphism informa-tion content (PIC) was calculated to each state separately, according to the formula PIC = 1 – ∑p 2
ij, where p
2
ij is the
frequency of the i allele for the primer j. The correlation of PIC value for each locus between populations was verified using the Pearson’s correlation linear test with the program BioEstat 5.0 (Ayres 2009). The intrapopulational genetic variability was inferred by measuring the allele frequencies, the exclusive alleles frequencies, the number of polymorphic alleles per loci (Ap), and the expected (HE) and observed (HO) heterozygosity. Wright’s fixation index f with confidence interval (95%) was estimated by 10000
bootstrap resembling, using the GDA program (Lewis and Zaykin 2000).
The analysis of the genetic composition was performed considering two genotype classifications: first, accessions collected in each State as a unique sample; and second, the accessions collected in different Mesoregions inside each
state as subdivision (Table 1). In that case, the distribution of genetic structure inside and between the populations was measured by the Nei’s fixed model (Nei 1973), ac-cording to parameters total (HT), intrapopulational (HS) and interpopulational (GST) genetic diversity, using the program FSTAT (Goudet 2001). The Hedrick’s standardized G’ST was employed to correct the GST values calculated using the program SMOGD (Crawford 2010).
RESULTS AND DISCUSSION
Twenty polymorphic loci were amplified. These loci are distributed over 14 chromosomes from A and D genomes of allotetraploid cotton, and those located both at the same chromosome are sufficiently distant to allow independent segregation (Nguyen et al. 2004). Markers CIR49, CIR94 and CIR381 revealed two loci, which were all polymorphic (Table 2). However, makers CIR09, CIR34, CIR38, CIR105, CIR121, CIR143 and CIR203 were monomorphic in the accessions analyzed. One primer pair amplified one mono-morphic allele and three of them did not amplify any allele.
A total number of 50 alleles were obtained, all of them were observed in Paraíba and only 48 among Rio Grande do Norte’s genotypes. The number of alleles per locus varied from 2 to 4, in both states (Table 2). The average number of alleles per locus was very similar between Paraíba
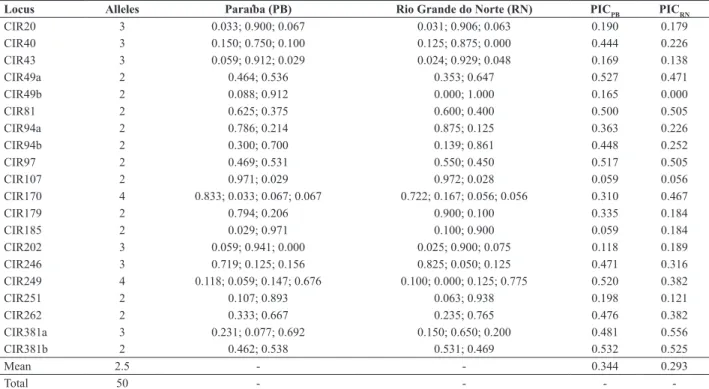
Table 2. Number of alleles per locus (A), estimates of allelic frequencies and polymorphism information content (PIC) for 20 SSR loci in two G. hirsutum r. marie galante populations from the states of Paraiba and Rio Grande do Norte
Locus Alleles Paraíba (PB) Rio Grande do Norte (RN) PICPB PICRN
CIR20 3 0.033; 0.900; 0.067 0.031; 0.906; 0.063 0.190 0.179
CIR40 3 0.150; 0.750; 0.100 0.125; 0.875; 0.000 0.444 0.226
CIR43 3 0.059; 0.912; 0.029 0.024; 0.929; 0.048 0.169 0.138
CIR49a 2 0.464; 0.536 0.353; 0.647 0.527 0.471
CIR49b 2 0.088; 0.912 0.000; 1.000 0.165 0.000
CIR81 2 0.625; 0.375 0.600; 0.400 0.500 0.505
CIR94a 2 0.786; 0.214 0.875; 0.125 0.363 0.226
CIR94b 2 0.300; 0.700 0.139; 0.861 0.448 0.252
CIR97 2 0.469; 0.531 0.550; 0.450 0.517 0.505
CIR107 2 0.971; 0.029 0.972; 0.028 0.059 0.056
CIR170 4 0.833; 0.033; 0.067; 0.067 0.722; 0.167; 0.056; 0.056 0.310 0.467
CIR179 2 0.794; 0.206 0.900; 0.100 0.335 0.184
CIR185 2 0.029; 0.971 0.100; 0.900 0.059 0.184
CIR202 3 0.059; 0.941; 0.000 0.025; 0.900; 0.075 0.118 0.189
CIR246 3 0.719; 0.125; 0.156 0.825; 0.050; 0.125 0.471 0.316
CIR249 4 0.118; 0.059; 0.147; 0.676 0.100; 0.000; 0.125; 0.775 0.520 0.382
CIR251 2 0.107; 0.893 0.063; 0.938 0.198 0.121
CIR262 2 0.333; 0.667 0.235; 0.765 0.476 0.382
CIR381a 3 0.231; 0.077; 0.692 0.150; 0.650; 0.200 0.481 0.556
CIR381b 2 0.462; 0.538 0.531; 0.469 0.532 0.525
Mean 2.5 - - 0.344 0.293
-(2.45) and Rio Grande do Norte (2.42). Four alleles were exclusive for one of the states, revealed by the primer pairs CIR40, CIR49, CIR202 and CIR249 (Table 2), three found in Paraiba only and one exclusive of Rio Grande do Norte. Their frequencies were not high, ranging from 5.8 to 10%. A sampling effect could cause the presence of these exclusive alleles or, most likely, it could be the result of recent cases of genetic isolation, since seed exchange may be not as common as it was in the past, when extensive cultivation required a remarkable care with diversity and productivity, especially before the development of breeding programs. They have not been previously reported (Menezes et al. 2010) and can be used in studies of differentiations of population and, as verified by Petit et al. (1998), in the choice of preferred genotypes or populations for preserva-tion. A similar number of exclusive alleles was observed in
Gossypium barbadense (Almeida et al. 2009), an ancestor species of mocó cotton grown in the Northeastern Brazil. Low oscillations in allelic frequencies were observed between the two states. The most common allele for each locus was the same, except in the cases of CIR97 and CIR381 loci.
The allelic frequency was, in general, very low for some alleles while others tended to values close to 1.00 in the majority of loci (Table 2). The equitable distribution of allele frequencies in a population may indicate higher genetic diversity and that these population present, according to Hedrick (2005), higher protection of effects of genetic drift, when compared to the ones that have different alleles with discrepant frequency. Then, the evaluation of allelic frequencies have great importance, since it can show better the effects of genetic drift, fixation or allelic lose, as well, in genotypes selection. In that way the data obtained are valued as a reference in studies of tracking and multiplication of mocó cotton plant diversity planted in Northeast semi-arid.
The Polymorphism Information Content (PIC) at each locus, estimated by allele frequencies, was greater, in av-erage, among genotypes collected in Paraíba (0.344) than those collected in Rio Grande do Norte (0.293). Considering only Paraíba genotypes, the greater PIC value was obtained for locus CIR381b (0.532), and the smaller values for locus CIR107 and CR185 (0.059); while when considering only Rio Grande do Norte collections, the most informative was CIR 381a (0.556), and the less CIR 251 (0.121) (Table 2). Markers with greater PIC values can be chosen for further studies, since those can be more accurate to detect polymor-phism on these or in other populations. It was also noticed that the PIC values were highly correlated on both states (r = 0.80; IC95% 0.56 - 0.92; p<0.0001) (Figure 1). The loci CIR94, CIR246, CIR249 which when availed by Lacape
et al. (2007) had PIC values greater than the average value for microsatellite markers, presented with these Brazilian populations of mocó cotton (Table 2) similar values as the loci CIR179 and CIR107, which had in the previous study (Lacape et al. 2007) PIC values smaller than average. The loci CIR246 and CIR249 had greater PIC values then the previously used for mocó cotton populations (Menezes et al. 2010).
The populations of both states are similar - average Nei’s genetic distance equal to 0.017 - indicating that comparable diversity has been maintained. Moreover, the genetic dif-ferentiation among populations was very low (G'ST = 0.027) and not significant different from zero, according with 95% confidence interval (-0.012 to 0.090). Therefore, mocó plants collected can be considered a single population, congruently to the absence of contrast in allelic frequencies (Tables 2 and 3), and the previous SSR data (Menezes et al. 2010). The values corroborate the high similarity observed for morphological markers (seed type, leaf color, flower spot, presence of linter and color of fiber) between the specimens of the states, such as available at https://www.cnpa.embrapa. br/albrana. Although it is expected that small populations that reproduce by selfing differs greatly among themselves, the small genetic differentiation between the states reflects the veracity of the information obtained in expeditions in situ: the exchange of genetically similar seeds (gene flow),
which it leads to homogenization of the genetic diversity among population.
A deficit of heterozygous genotypes was indicated by the observed heterozygosity of 0.178, smaller than the
pected heterozygosity (0.315), resulting in a positive and significant total fixation index (F = 0.445, Table 3). This high inbreeding coefficient is probably due to reproduction by selfing (f = 0.432), rather than fragmentation associated to the geographical distribution of the cotton plants in both states (G'ST = 0.027) (Table 3).
The small differences between the states could be ex-plained by a great historic gene flow (Nm = 10.7). Although decrease of cotton cultivation for a few decades may have caused a decrease in seed exchange, this has not been enough to cause expressive alteration among genetic composition of states. An amount of seed exchange even with the proposal to plantation in gardens seems to remain.
According to Nei’s diversity indices, high total genetic diversity (HT = 0.325) was observed. However, most of this variability was distributed inside the states populations (HS = 0.318), and was extremely low between them (DST = 0.007). This is 2% of the total diversity of species.
When measured by each mesoregion, the total genetic diversity in each state appears to be very similar, slightly higher in the state of Paraíba (HT = 0.327) then in Rio Grande do Norte (HT = 0.302). The total diversity composition measured among collect mesoregions in each state was expressive, with an average of 0.069. The lowest values were observed among Sertão Paraibano and Central Pon-tiguar and the highest values among Borborema and Oeste Potiguar (Table 3). It may be concluded that the history of distribution of local varieties, as well as commercial culti-vars, which occurred similarly in both locations (Moreira et al. 1989) led to high uniform genetic distribution, which mostly remains. Otherwise, it is possible that the decrease
of cotton cultivation, which occurred decades ago, initi-ated a process of genetic erosion, caused by the effects of genetic bottleneck.
Microsatellite markers help verify the distribution of ge-netic diversity and therefore guide the search for contrasting genotypes, which should be included for species diversity conservation. As demonstrated in other works on genetic diversity of cotton population, the use of SSR markers has helped to design conservation strategies (Almeida et al. 2009, Barroso et al. 2010). The high diversity rate inside states and low genetic difference between them has showed that the conservation de cotton plants was given priority in one state in detriment of other. But when we observed that the G’ST average value between the plants by mesoregion was expressive, for this variability, we also observed that it not is appropriate to prioritize the conservation of plants from state over those from the others. The conservation in situ may be performed for these cotton plants, in case there is a commitment by the owners of farms. This strategy is hazardous because it depends on environmental conditions and the commitment of the farmers, but Barroso et al. (2010) and Menezes et al. (2014) have observed satisfac-tory results for nature populations of G. mustelinum. For adequate preservation purposes this germplasm of mocó cotton found in the states was carried out by cotton seed bank located at Embrapa for future studies.
ACKNOWLEDGMENTS
We thank CNPq for providing a scholarship to the first author (PIBIC 116205/2005-9), Financiadora de Estudos e Projetos (FINEP) and the Brazilian Ministry of Environment for financial support to the project (PROBIO).
Table 3. Descriptors of genetic diversity. HO, mean observed heterozygosity; HE, mean expected heterozygosity; f fixation index within population; 1G’
ST, genetic differentiation among population, and F, fixation index overall population; 2G’
ST, genetic differentiation among population of accessions
by mesoregion
Status HE HO f 1G’
ST F
Paraíba 0.337 0.173 0.495 -
-Rio Grande do Norte 0.289 0.179 0.387 -
-Total 0.315 0.178 0.432 0.027 0.445
IC95% (Lower/Upper) 0.239/0.616 -0.012/0.090 0.258/0.617
2G’
ST Sertão Paraibano Central Potiguar Oeste Potiguar
Borborema 0.019 0.085 0.091
Sertão Paraibano - 0.021 0.056
Central Potiguar - - 0.064
Caracterização genética de variedades locais de algodão dos estados da Paraíba
e Rio Grande do Norte
REFERENCES
Almeida VC, Hoffmann LV, Yokomizo GK, Costa JN, Giband M and Barroso PAV (2009) In situ and genetic characterization of Gossypium barbadense L. from the states of Pará and Amapá, Brazil. Pesquisa Agropecuária Brasileira 44: 719-725.
Alves MF, Barroso PAV, Ciampi AY, Hoffmann LV, Azevedo VCR and Cavalcante U (2013) Diversity and genetic structure among subpopulations of Gossypium mustelinum (Malvaceae). Genetic Molecular Research12: 597-609.
Ayres M (2009) BioEstat: Aplicações estatísticas nas áreas das ciências bio-médicas (Software). Version 5.3. Available at <http://www. mamiraua.org.br/ptbr/downloads/ programas/bioestat-versao-53>. Accessed on Jan 8, 2009.
Barroso PAV, Hoffmann LV, Batista CE, Freitas RB, Alvez MF, Silva UC and Andrade FP (2010) In situ conservation and genetic diversity of three populations of Gossypium mustelinum Miers ex Watt. Genetic Resources and Crop Evolution 57: 343-349.
Bertini MCH, Schuster I, Sediyama T, Barros EG and Moreira MA (2005) Analysis of cotton genetic diversity by microssatellites and pedigree. Crop Breeding and Applied Biotechnology 5: 369-378.
Borém A, Freire EC, Penna JCV and Barroso PAV (2003) Considerations about cotton gene escape in Brazil: a review. Crop Breeding and Applied Biotechnology 3: 315-332.
Brubaker CL and Wendel JF (1994) Reevaluating the origin of domestication cotton (Gossypium hirsutum, Malvaceae) using nuclear restriction fragment length polymorphism (RFLP). American Journal of Botany 81: 1309-1326.
Cabral-Teixeira TA, Penna JCV and Goulart LR (2002) A comparative analysis of genetic distances among 24 upland cotton genotypes using RAPD markers and phenotypic characters. Crop Breeding and Applied Biotechnology 2: 85-96.
Campbell BT, Saha S, Percy R, Frelichowski J, Jenkins JN, Park W, Mayee CD, Gotmare V, Dessauw D, Giband M, Du X, Jia Y, Constable G, Dillon S, Abdurakhmonov IY, Abdukarimov A, Rizaeva SM, Adullaev A, Barroso PAV, Padua JG, Hoffmann LV and Podolnaya L (2010) Status of the global cotton germplasm resources. Crop Science 50: 1161-1179.
Carvalho LP, Farias FJC, Lima MMA and Rodrigues JIS (2014) Inheritance of different fiber colors in cotton (Gossypium barbadense L.). Crop Breeding and Applied Biotechnology 14: 265-260.
Crawford NG (2010) SMOGD: software for the measurement of genetic diversity. Molecular Ecology Resources 10: 556-557.
Dantas ACA, Barroso PAV, Hoffmann LV, Alves MF and Andrade FP (2012) SSR markers to detect gene flow from upland to mocó cotton. Revista Ciência Agronomica 43: 163-169.
Embrapa (1975) Sistemas de produção para o algodão arbóreo. Embrapa Algodão, Campina Grande, 19p. (Circular, 49).
Embrapa (1997) Recomendações técnicas para cultivo do algodoeiro mocó precoce: Áreas do Nordeste do Brasil, zona 17. Embrapa Algodão, Campina Grade, 26p.
Giband M, Dessauw D and Barroso PAV (2010) Cotton: Taxonomy, origin and domestication. In Wakelyn PJ and Chaudhry MR (eds.) Cotton: Technology for the 21st century. International cotton Advisory
committee. p. 3-15.
Goudet J (2001) FSTAT: Program to estimate and test gene diversities
and fixation indices (Software). Version 2.9.3. Available at <http:// www.unil.ch/izea/softweres/fstat.html>. Accessed on Dec 16, 2006.
Hedrick PW (2005) A standardized genetic differentiation measure. Evolution 59: 1633-1638.
Iqbal MJ, Reddy O, El-Zik KM and Pepper AE (2001) A genetic diversity bottleneck in the evolution under domestication of upland cotton Gossypium hirsutum L. examined using DNA fingerprinting.
Theoretical and Applied Genetics 103: 547-554.
Lacape LM, Dessauw D, Rajab M, Noyer JL and Hau B (2007) Microsatellite diversity in tetraploid Gossypium germoplasm: assembling a highly informative genotyping set of cotton SSRs. Molelular Breeding 19: 45-58.
Lewis P and Zaykin D (2000) Genetic data analysis: Computer program for the analyses of allelic data (software). Version 1.0 (d12). Available at <http://alleyn.eeg.uconn.edu/gda/>. Accessed on Dec 16, 2006.
Menezes IPP, Barroso PAV, Hoffmann LV, Lucena VS and Giband M (2010) Genetic diversity of mocó cotton (Gossypium hirsutum
race marie-galante) from the northeast of Brazil: implications for conservation. Botany 88: 1-9.
Menezes IPP, Gaiotto FA., Hoffman LV, Ciampi AY and Barroso PA (2014) Genetic diversity and structure of natural populations of Gossypium mustelinum, a wild relative of cotton, in the basin of De Contas River in Bahia, Brazil. Genetica 142: 99-108.
Moreira JAN, Beltrão NE and Freire EC (1994) Organografia do algodoeiro mocó e sua relação com o crescimento e a produção. Embrapa Algodão, Campina Grande, 66p.
Moreira JAN, Freire EC, Santos RF, Barreiro Neto M, Medeiros LC and 38 acessos - 21 plantas do Rio Grande do Norte e 17 da Paraíba - foi analisadas usando 24 pares de primers de microssatélites de algodão, que amplificaram 20 locos polimórficos. A média do índice de fixação foi de 0,432 e foi ligeiramente maior nos indivíduos da Paraíba do que do Rio Grande do Norte. A diversidade genética de Nei entre as amostras de cada estado apresentou valores similares (HT = 0,327 e 0,302 na Paraíba e Rio Grande do Norte, respectivamente), indicando que uma diversidade genética similar tem sido mantida. Logo, a proporção da diversidade genética entre as populações foi extremamente baixa (DST = 0,007), mas expressiva entre as mesorregiões (DST = 0,069). Conforme os dados, conclui-se que a similaridade genética entre as populações é alta.
Giles JA (1982) Visão retrospectiva do melhoramento genético no algodoeiro mocó (Gossypium hirsutum r. marie galante Hutch) no nordeste do Brasil. Embrapa Algodão, Campina Grande, 54p.
Moreira JAN, Freire EC, Santos RFS and Neto MB (1989) Algodoeiro
Mocó: Uma lavoura ameaçada de extinção. Embrapa Algodão, Campina Grande, 20p.
Moreira JAN, Silva FP and Albuquerque JJL (1972) Melhoramento genético do algodão mocó. Ciência Agronômica 2: 19-32.
Nei M (1973) Analysis of gene diversity in subdivided populations. Proceeding of National Academy of Science of USA 70: 3321-3323.
Nguyen TB, Ginband M, Brottier P, Risterucci AM and Lacape JM (2004) Wide coverage of the tetraploid cotton genome using newly developed microsatellite markers. Theoretical and Applied Genetics 109: 167-175.
Petit RJ, Mousadik EA and Pons O (1998) Identifying populations for conservation on the basis of genetic markers. Conservation Biology 12: 844-855.
Stipanovic RD, Puckhaber LS, Bell AA, Percival AE and Jacobs J (2005)
Occurrence of (+)- and (-) gossypol in wild species of cotton and in
Gossypium hirsutum var. Marie galante (Watt) Hutchinson. Journal of Agricultural and Food Chemistry 53: 6266-6271.
Wendel JF, Brubaker CL and Perciva LAE (1992) Genetic diversity in
Gossypium hirsutum and the origin of upland cotton. American Journal of Botany 79: 1291-1310.
Xiao J, Fang DD, Bhatti M, Hendrix B and Cantrell R (2010) A SNP haplotype associated with a gene resistant to Xanthomonas axonopodis
pv. malvacearum in upland cotton (Gossypium hirsutum L.). Molecular Breeding 25: 593-602.
Zhang X, Yuan Y, Wei Z, Guo X, Guo Y, Zhang Y, Zhao J, Zhang G, Song X and Sun X (2014) Molecular mapping and validation of a major QTL conferring resistance to a defoliating isolate of verticillium wilt in cotton (Gossypium hirsutum L.). PLoS ONE 9: e96226.
Zheng L, Meredith Jr. WR, Gutiérrez OA and Boyking DL (2009) Identification of associations between SSR markers and fiber traits in an exotic germplasm derived from multiple crosses among Gossypium