133 Rev. Bras. Pesq. Tur. São Paulo, 12(1), pp. 133-156, jan./abr. 2018.
DOI:http://dx.doi.org/10.7784/rbtur.v12i1.1359
Tourist experience measurement in Quito city
Medición de la experiencia del turista en Quito
Medição da experiência turística em Quito
Pablo Aníbal Torres Matovelle1
Simone Baez2
Abstract: Although the tourist experience has been studied in-depth, the need for new methods for measuring it from a holistic perspective remains latent. This research aims to measure the tourist experience in Quito through Likert-type scales on a comprehensive set of dimensions and indicators proposed in the literature, and their graphic presentation through importance-performance analysis matrix. To do this, a multivariate analysis was carried out and a theoretical proposal of dimensions and indicators of tourism experience is validated. Thus, this study determines the importance of each dimension and the performance perceived in them by tourists, identifying the influential factors on tourist satisfaction. The study validates the theoretical model subjected to empirical verification and shows that the tourist experience in Quito is highly satisfactory and influenced by twenty key aspects. Finally, research determines that tourist's expectations in the dimensions: uniqueness, mul-tisensory, rational quality, and personal enrichment, are balanced with what they obtained during their trip; on the other side, performance related to dimensions relational development and responsibility are perceived be-low their expectations.
Keywords:Measurement. Tourist experience. Dimensions. Indicators. Survey.
Resumo: Embora a experiência turística tenha sido um assunto profundamente estudado, a necessidade de aplicar novos métodos para a sua medição a partir de uma perspectiva holística ainda permanece latente. O objetivo desta pesquisa é medir a experiência turística em Quito através do método de avaliação resumida com base em um conjunto abrangente de dimensões e indicadores propostos na literatura especializada e sua dis-posição gráfica através da matriz de análise importância - desempenho. Para fazer isso, uma análise é realizada de forma descritiva e inferencial, através da qual é validada uma proposta teórica de dimensões e indicadores
1 PhD candidate. Faculty of Tourism, University of Havana. Universidad Tecnológica Equinoccial. Equador.The author was responsible for the overall conception and design of the study. He led the multivariate analysis and interpretation of the data, as well as developing the first draft of the paper and rewriting subsequent drafts based on the reviews provided by the referees.
2 Independent researcher. Ecuador. The author was responsible for data collection and descriptive analysis. She also contributed to the conceptual direction and research design. The questionnaires were collected during a tourism thesis research at the undergraduate level at the UTE carried out by Simone Baez, and directed by MSc. Torres. Treatment of data collected and analysis are part of an independent investigation carried out by both of the authors.
Paper submitted in: 18/09/2017. Paper accepted in: 31/01/2018.
da experiência do turismo, determinando a importância das dimensões e do desempenho percebido nelas, iden-tificando os fatores influentes na satisfação do turista. O estudo valida o modelo teórico sujeito ao contraste empírico e mostra que a experiência turística em Quito é altamente satisfatória e influenciada por vinte e um aspectos-chave. Finalmente, a pesquisa determina que, nas dimensões: singularidade, qualidade multisensorial, qualidade racional e desenvolvimento pessoal, a experiência é equilibrada com as expectativas dos turistas du-rante a viagem; enquanto as dimensões: desenvolvimento e responsabilidade relacionais, experiência são per-cebida abaixo das expectativas.
Palavras-chave: Medição. Experiência turística. Dimensão. Indicadores. Inquérito.
Resumen: Aunque la experiencia del turista ha sido un tema profundamente estudiado, aún permanece latente la necesidad de aplicar nuevos métodos para su medición desde una perspectiva holística. Esta investigación tiene por objetivo medir la experiencia del turista en Quito mediante el método de evaluaciones sumarias a partir de un set integral de dimensiones e indicadores propuestos en la literatura especializada y su disposición gráfica mediante la matriz de análisis de importancia - desempeño. Para ello se realiza un análisis tanto a nivel descriptivo como inferencial, por medio de los cuales se valida una propuesta teórica de dimensiones e indica-dores de la experiencia turística, a la vez que se determina la importancia de las dimensiones y el desempeño percibido en ellas por la demanda, identificando los factores influyentes en la satisfacción del turista. El estudio valida el modelo teórico sometido a contraste empírico y demuestra que la experiencia del turista en Quito es altamente satisfactoria e influenciada por veintiún aspectos clave. Finalmente, la investigación determina que en las dimensiones: unicidad, multisensorialidad, calidad racional y desarrollo personal se equilibran las expec-tativas de los turistas con lo obtenido durante su viaje; mientras que las dimensiones: desarrollo relacional y responsabilidad se perciben por debajo de sus expectativas.
Palabras clave: Medición. Experiencia turística. Dimensione. Indicadores. Encuesta.
1 INTRODUCTION
It is widely recognized that tourism market dynamics no longer pivots on prod-ucts or services, but experiences, so that tourists become loyal customers and pre-scribers (Fuste and Nava, 2015), therefore the reported experience is a fundamental factor in tourism planning and assessment (Hernández, Vargas & Aguilar, 2015). In this sense, offering quality experiences is of ut-most importance for the competitiveness of tourism industry (Sernatur, 2016).
Relevance of knowledge about tourist experience has been reflected in applied re-search. According to Tussyadiah (2014) the recent scientific production tends to consider tourist experience as the essence of tourism.
135 Matovelle, P. A. T. ; Baez, S. Tourist experience measurement in Quito city
Rev. Bras. Pesq. Tur. São Paulo, 12(1), pp. 133-156, jan./mar. 2018. methods and approaches (Ingram, Caruana &
McCabe; 2017).
In this sense, the present research aims to measure the tourist experience through a quantitative approach, using the survey technique and the importance-perfor-mance analysis matrix. The place of study is Quito, an emblematic destination of Ecuador for having won for four consecutive years the recognition of the "Word Travel Award" in the "Leading Destination" category in South America. The study is of special interest be-cause it is a pioneering approach to tourist experience in the city from a holistic perspec-tive and it is particularly useful as a support for decision-making regarding the structuring of supply and destination management. This article is partially based on a thesis work re-cently conducted and directed by the au-thors, which has been complemented with a multivariate analysis and the importance- performance analysis matrix.
1.1 Tourist experience in destination
As Hossany and Gilbert (2014) point out, tourist destinations are better prepared for success if they recognize the quality of the experience in their offers. The awareness of this fact has promoted a boom in research in this field. The experience of the consumer has been subject of profuse studies since its knowledge provides substantial support to the decision making in the field of marketing; nevertheless, even its conceptualization and measurement are still ambiguous.
In the field of tourism and on a terri-torial analysis scale, the tourist experience can be expressed in a very simple way as in
the definition of Sharpley and Stone (2011) where it constitutes what the tourist experi-ences. In a more developed ways it is defined as quoted below:
A tourist experience is a past personal travel-related event, strong enough to have entered long-term memory (Larsen, 2007)
The experience of the tourist consists of a continuous flux of related and inte-grated services which are acquired dur-ing a limited period of time, often in dif-ferent geographical areas (Mendes et al., 2010).
The tourist experience is a set of physi-cal, emotional, sensory, spiritual, and/or intellectual impressions, sub-jectively perceived by the tourists, from the moment they plan their trip, enjoy it in the chosen destination and even when they return to their place of origin, remembering their trip (Otto & Ritchie, 1995 cited by Rivera, 2013).
It is a personal experience, reflecting tangible and intangible aspects that im-pact and suffer the imim-pact of unique and memorable events (Rivera, 2013).
The tourist experience is a cumulative process that includes three phases: be-fore traveling, during the vacations at the destination and after traveling; and that needs an explicit preparation to happen (Carballo, et al., 2015).
tin, 2016).
According to this, it can be affirmed that the tourist experience in destination takes shape in the mind of the tourist through a process of fixation and aggregation of sensory, cognitive, and emotional impres-sions in a period of trip that goes from plan-ning to recollection. Following Pine and Gil-more (1998) the experiences can be grouped into four categories: entertainment, educa-tional, esthetic, and escapist; while for Aho (2001), informative, emotional, practical, and transformative experiences are distin-guished.
The traveler experience in destination as a multidimensional construct, has gained the attention of numerous experts who have gradually added variables to be considered as part of it. Thus, to the early proposal of Otto and Ritchie (1996) that raise the variables: hedonism, involvement, peace of mind, and recognition; others have been added such as: love, joy, positive surprise (Hosany & Gilbert,
137 Matovelle, P. A. T. ; Baez, S. Tourist experience measurement in Quito city
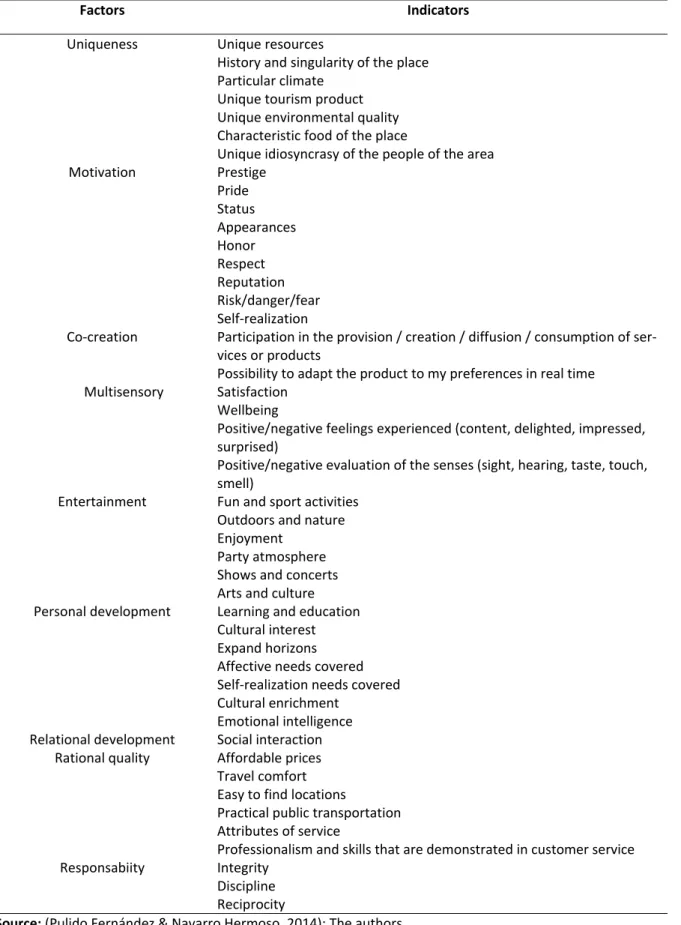
Rev. Bras. Pesq. Tur. São Paulo, 12(1), pp. 133-156, jan./mar. 2018. Table 1 - Tourist experience factors and indicators
Factors Indicators
Uniqueness Unique resources
History and singularity of the place Particular climate
Unique tourism product Unique environmental quality Characteristic food of the place
Unique idiosyncrasy of the people of the area Motivation Prestige
Pride Status Appearances Honor Respect Reputation Risk/danger/fear Self-realization
Co-creation Participation in the provision / creation / diffusion / consumption of ser-vices or products
Possibility to adapt the product to my preferences in real time Multisensory Satisfaction
Wellbeing
Positive/negative feelings experienced (content, delighted, impressed, surprised)
Positive/negative evaluation of the senses (sight, hearing, taste, touch, smell)
Entertainment Fun and sport activities Outdoors and nature Enjoyment
Party atmosphere Shows and concerts Arts and culture Personal development Learning and education
Cultural interest Expand horizons Affective needs covered Self-realization needs covered Cultural enrichment
Emotional intelligence Relational development Social interaction
Rational quality Affordable prices Travel comfort Easy to find locations
Practical public transportation Attributes of service
Professionalism and skills that are demonstrated in customer service Responsabiity Integrity
Discipline Reciprocity
1.2 Tourist experience measurement in des-tinations
According to Burns and Holden (1995), measurement of integral experience in destinations is more complex than at the level of individual services. Carballo et al., (2015) note that because most experiences in tourism take place in a short period with uninterrupted episodes, it can be difficult to have a true understanding of them. They list some efforts that have been developed to study the tourist experience as: the open-ended journal, mail surveys, and depth in-terviews (Nickerson, 2004); recording tape method on own initiative and in-depth inter-views (Lee et al., 1994); the incident tech-nique (Jackson et al., 1996); the analysis of critical moments of truth (Carlzon, 1987); the experience map (Schmitt, 2003); the devel-opment of a dramatic script (Harris et al., 2003); among others of a qualitative nature. However, they emphasize the need for new forms of applied research. This is especially necessary in a quantitative approach, where it is observed an important limitation to un-derstand in depth its nature and assessment.
In the last five years, there have been important contributions to the tourism expe-rience research: Prayag, Hosany and Odeh (2013) studied the relationship between emotional experiences, satisfaction, and be-havioral intentions in Petra, Jordan based on a survey; Bosangit, Hibbert and McCabe (2015) studied the tourist experience based on content analysis of travelers' blogs in the United Kingdom. Park and Almeida (2016) conducted 28 semi-structured interviews
with Korean tourists to determine central el-ements of memorable tourist experience on three temporary travel stations (pre- during and post-trip). Ingram, Caruana and McCabe (2017) applied the participant consultation in a selection of 16 tourists whose destination varied between domestic, European, and in-ternational; also, in its full travel process. Fi-nally, Wearing and Foley (2017) studied the movement of tourists through the city to un-derstand their experiences from a perspec-tive that claims the low visibility given to the female gender in tourism research.
2 METHODOLOGY
This empirical study was developed by applying a survey to a sample of foreign tourists over 18 years of age, who visited Quito throughout March 2017. A sample of 384 people was calculated, considering a margin of error of +/- 5% and a confidence level of 95%, however, 402 valid question-naires were obtained.
Survey questionnaires were applied after visiting Quito to obtain responses based on an overall perception of the tourist expe-rience in the city. Therefore, tourists were in-terviewed during their stay in the city to re-trieve their email address and tentative date of departure from Ecuador. A message was sent to them inviting to participate in the sur-vey, which was entered online in the Google platform
139 Matovelle, P. A. T. ; Baez, S. Tourist experience measurement in Quito city
Rev. Bras. Pesq. Tur. São Paulo, 12(1), pp. 133-156, jan./mar. 2018. formation; the second contained 54
five-point Likert scale questions (from very low to very high), to measure the importance of di-mensions and the assessment of experience indicators, based on the proposal of tourism experience factors and indicators from Pu-lido and Navarro (2014).
A pilot study was conducted in Febru-ary 2017, with 55 questionnaires in order to validate the understanding of the survey in-strument and verify its reliability. Cronbach's Alpha reliability was + .86. It is considered ac-ceptable, since Nunnally and Bernstein (1994) consider acceptable a scale if it has a Cronbach’s alpha greater than 0.7.
Data analysis was performed us-ing SPSS 3.0 and missus-ing values were elimi-nated through tabulation. Several statistical tests were applied with diverse aims. First, a Confirmatory Factor Analysis (CFA) to vali-date dimensions and indicators proposed by Pulido and Navarro (2014); a one-way ANOVA with Tukey post hoc test, to as-sess the significance of differences be-tween pairs of factors; the Pearson and Spearman correlation coefficients to estab-lish dependence between variables. Finally,
an importance-performance analysis matrix was prepared to compare what tourists ex-pected to what they obtained regarding the experience in Quito from their perspective.
3 RESULTS
3.1 Profile of respondent tourist
Table 2 - Socio demographic profile of respondent tourists
Variable % Variable %
Gender Male 48.5 Nationality United States of America
25.1
Female 51.5 United
King-dom
7.5
Age Under 25 years old 27.4 Germany 12.7
26 - 35 years old 34.3 Argentina 8.5
36 - 45 years old 12.2 Venezuela 4.5
46 - 65 years old 24.6 Colombia 8.0
66 years old or more 1.5 Switzerland 1.5
Educational level High school 4.5 South Africa 0.7
Under graduation 74.1 Canada 6.0
Graduation 21.4 China 2.5
Marital status Single 60.9 Mexico 1.7
Married 32.6 Australia 2.7
Free union 1.7 Chile 3.0
Divorced 1.5 Guatemala 1.0
Widowed 3.2 Peru 1.2
Mode of travel Organized tour with travel agencies
21.9 Brazil 0.7
On your own 78.1 Cuba 0.2
Daily expenditure
Up to USD 25 10.7 Jamaica 0.5
USD 26 - USD 50 34.6 Uruguay 2.2
USD 51 -USD 75 28.4 Denmark 1.0
USD 76 - USD 100 17.9 Spain 1.0
More than USD 100 8.5 Holland 3.5
Occupation Student 25.1 France 1.0
Professional 64.7 Belgium 0.7
Retired 8.7 Philippines 0.5
House work 0.5 El Salvador 0.5
Unemployed 1.0 Costa Rica 1.2
Length of stay 1 - 3 days 41.5 Bolivia 0.2
4 - 7 days 28.9 Total 100.0
8 - 11 days 6.0
12 days or more 23.6
Travel group Family 16.7
Friends 42.3
Work group 6.0
Couple 16.4
Alone 18.7
3.2 Confirmation of tourist experience factors
In this stage of the research, 9 fac-tors that define the dimensions of tourist experience, adopted from Pulido and Na-varro (2014), were confirmed through Confirmatory Factor Analysis. The Varimax rotation with Kaiser normalization was ap-plied to the correlation matrix. Results
141 Matovelle, P. A. T. ; Baez, S. Tourist experience measurement in Quito city
Rev. Bras. Pesq. Tur. São Paulo, 12(1), pp. 133-156, jan./abr. 2018. Table 3 - Confirmatory Factor Analysis: Components
Indicator Component
1 2 3 4 5 6 7 8 9
Motivation – Respect .785
Motivation – Honor .783
Motivation – Reputation .783
Motivation – Prestige .745
Motivation – Pride .727
Motivation – Self-realization .434
Rational Quality – Easy to find locations .705
Rational Quality – Professionalism and skills that are demonstrated in customer service .704
Rational Quality – Travel comfort .684
Entertainment – Outdoors and nature* .579
Rational Quality – Attributes of services .566
Rational Quality - Affordable prices .421
Uniqueness – Unique environmental quality .691
Uniqueness – Particular climate .646
Uniqueness – Unique tourism product .598
Uniqueness – Unique idiosyncrasy of the people of the area .594
Uniqueness – Unique resources .593
Uniqueness - Characteristic food of the place .512
Uniqueness – History and singularity of the place .483
Multisensory - Satisfaction .761
Multisensory - Wellbeing .710
Multisensory - Positive feelings .701
Multisensory - Positive evaluation of senses .670
Entertainment – Arts and culture* .331
Personal development - Cultural interest .717
Personal development - Expand horizons .659
Personal development – Learning and education .649
Personal development - Cultural enrichment .611
Personal development - Self-realization needs covered .609
Personal development – Affective needs covered .601
Entertainment – Party atmosphere .758
Entertainment – Shows and concerts .629
Entertainment –Recreational and sport activities .578
Entertainment – Fun and enjoyment .529
Rational Quality – Practical public transportation* .522
Relational development– Social Interaction* .473
Responsibility - Integrity .822
Responsibility - Discipline .797
Responsibility - Reciprocity .726
Motivation – Appearances* .638
Motivation – Risk, danger, fear* .619
Motivation - Status* .618
Personal development – Emotional Intelligence .591
Co-creation - Participation in the provision / creation / diffusion / consumption of services or products in Quito .751
Co-creation - Possibility to adapt the product to my preferences in real time .728
3.3 Valuation of factor importance
Importance given by surveyed tour-ists to factors/dimensions shows different values as can be seen in Table 4, where the
mean, mode, and median values are pre-sented. As can be seen, dimension valued with the highest score was multisensory while the lowest score valued was co-crea-tion.
Table 4 – Valuation of factor importance: mean, median, and mode values
Uni
que
ness
Moti
v
ati
on
Co
-creati
on
Mu
lti
sensor
y
E
ntert
ai
nm
ent
Pe
rs
onal
devel
opment
Rel
ati
onal
devel
opment
Rati
onal
qu
al
it
y
Responsi
bi
li
ty
N Valid 402 402 402 402 402 402 402 402 402
Invalid 0 0 0 0 0 0 0 0 0
Mean 3.74 3.43 2.77 3.94 3.41 3.56 3.52 3.55 3.54 Mode 4.00 4.00 3.00 4.00 4.00 4.00 4.00 4.00 3.00 Median 4.00 4.00 3.00 4.00 4.00 4.00 4.00 4.00 3.00
One-way ANOVA test analysis results confirms there are significant statistical dif-ferences among importance values. Taking the analysis deeper, the Tukey’s test demon-strates a wide variability in the assessment of
importance given to dimensions, noting that there is no statistical difference in just 8 com-binations of 64 possible, which are shown in Table 5
Table 5 – Tukey’s multiple comparisons test
(I)Group (J)Group Sig.
Uniqueness Motivation 1.00
Personal development 1.00
Motivation Personal development 1.00
Multisensory Entertainment 0.06
Rational development 0.99
Entertainment Relational development 1.00
Rational quality 0.35
Relational development Rational quality 0.19
Indicators that make up each fac-tor/dimension obtained diverse scores, not-ing than more than a half of them obtained a median and statistical mode value equal to 4, what represents a high value. Indicators bet-ter valued were: singular history of the place, arts and culture, for which the assessment
143 Matovelle, P. A. T. ; Baez, S. Tourist experience measurement in Quito city
Rev. Bras. Pesq. Tur. São Paulo, 12(1), pp. 133-156, jan./abr. 2018. Figure 1 - Tourist experience median score
0 1 2 3 4 5
Unique resources History an singularity of the place Particular weather Inimitable tourism product Unique environmental quality Characteristic food of the place Unique idiosyncrasy of the people of the area Prestige Pride Status Appearances Honor Respect Reputation Risk/danger/fear Self-realization
Participation in the provision / creation / diffusion… Possibility to adapt the product to my preferences…Satisfaction
Wellbeing
. Positive/negative feelings experienced… Positive/negative evaluation of the senses (sight,…
Fun and sport activities Outdoors and nature Enjoyment Party atmosphere Shows and concerts Arts and culture Learning and education Cultural interest
Expand horizons Affective needs covered Self-realization needs covered Cultural enrichment Emotional intelligence Social interaction
Affordable prices Travel comfort Easy to find locations Practical public transportation Attributes of service
Professionalism and skills that are demonstrated…Integrity
3.4 Independence analysis of variables
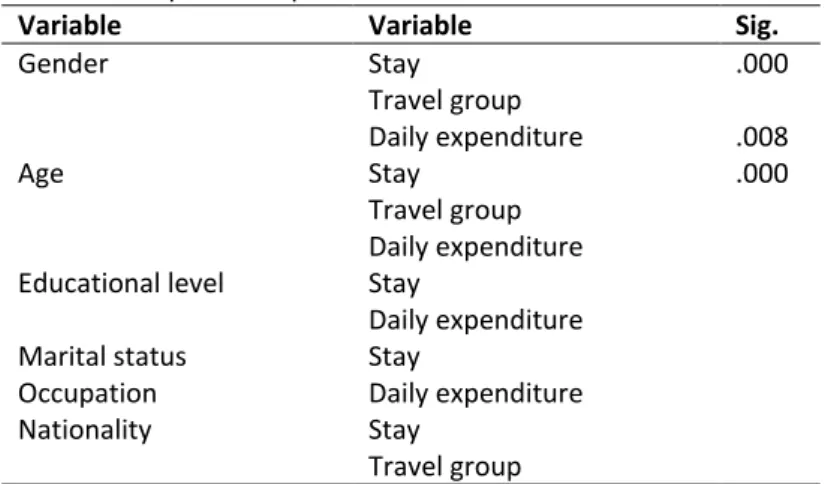
The Chi-Square Test of Independence confirms that gender shows a relationship with: length of stay, travel group, and daily expenditure. In this sense, it is found that the most mentioned length of stay by women was the longest (12 days or more) while the most selected by men is the shortest (1-3 days). In addition, while men and women co- incide in selecting more frequently the cate-gory of friends as a travel group, the second preference, mostly selected by men, is "alone" and by women, "family". In terms of daily spending, men spend more than women with a daily average between USD 51 and 75 while women spending is between USD 26 and 50.
Age variable is related to: stay, travel group, and daily expenses. Thus, younger people (under 25 years of age) most often choose the longest stay, while older people prefer the shortest stay (1 to 3 days). Like-wise, the preferred travel group for people under 35 years of age is "friends", and "cou-ple" for those from 36 years old or more. Re- garding daily spending, it can be noted that as age increases the preference for organized tour also increases.
Educational level variable is related to stay and daily expenditure. In this way it is found that people with high school studies stay more days, while people with a higher educational level stay less time (mostly be-tween 1 and 3 days). Also, it is found that the higher levels of education, the greater the ex-pense.
Marital status and stay are depend-ents variables. In this sense, it is observed
that widows stay longer (12 or more days) than single women, and the latter stay longer (3-7 days) than married women.
Also, occupation and daily expendi-ture are related variables too. It is found that the most frequent spending range for stu-dents is from USD 26-50, and for profession als it amounts to USD 51-75, reaching the range of USD 76-100 for retirees.
145 Matovelle, P. A. T. ; Baez, S. Tourist experience measurement in Quito city
Rev. Bras. Pesq. Tur. São Paulo, 12(1), pp. 133-156, jan./abr. 2018. the stay the lower the daily expense. Table 6
shows this relationship between variables
and the value of significance resulting from Chi-square test.
Table 6 - Chi square independence test
Variable Variable Sig.
Gender Stay .000
Travel group
Daily expenditure .008
Age Stay .000
Travel group Daily expenditure Educational level Stay
Daily expenditure Marital status Stay
Occupation Daily expenditure
Nationality Stay
Travel group
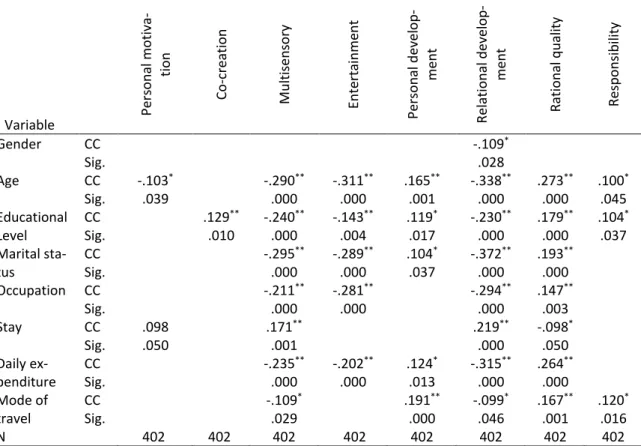
Results from Spearman correlation coefficient confirms there is a set of variables that show greater influence on valuation of importance of the dimensions under study. These are: gender, age, educational level, marital status, occupation, stay, daily ex-penditure, and mode of travel.
In this set, the following variables stood out: "age" and "educational level" be-cause they influence the greatest number of dimensions (seven factors/dimensions); fol-lowed by "marital status", "daily expendi-ture", and "travel mode" (five dimensions); and "occupation", and "stay" (four dimen-sions). Finally, the variable "gender" influen- ces a single dimension. It should be noted that for the dimension "special and unique attributes of the destination" the cited varia-bles do not show dependence.
Expanding the analysis, it is found that the variables that most influence dimen-sion "opportunities for social relations" are: gender, age, educational level, marital status, daily expenditure, and mode of travel. In con-trast, for the dimension "value experiences
to be counted" the most influential variables are age and length of stay.
In the case of dimension "partake in design, execution and/or diffusion of tourism services and activities", a single influential variable is revealed, i.e. educational level. In-stead, for dimension "sensations and emo-tions during the trip" the influential variables are numerous: age, educational level, marital status, occupation, stay, daily expenditure, and mode of travel.
calculated values are shown in Table 7 On the other hand, the same analysis applied to indicators of tourism experience in Quito confirms the influence of the variables: nationality, educational level, marital status, stay, travel group, and daily expenditure. In
detail, daily expenditure is influential in 80% of the indicators, while educational level is in 60%, stay in 56%, marital status in 51%, na-tionality in 47%, and travel group in 9% of all indicators.
Table 7 - Spearman coefficients of correlation between selected variables and dimensions
Variable Pe
rs
onal
moti
va-ti
on
Co
-creati
on
Mu
lti
sensor
y
E
ntert
ai
nm
ent
Pe
rs
onal
devel
op-me
nt
Rel
ati
onal
devel
op-me
nt
Rati
onal
qu
al
it
y
Responsi
bi
li
ty
Gender CC -.109*
Sig. .028
Age CC -.103* -.290** -.311** .165** -.338** .273** .100*
Sig. .039 .000 .000 .001 .000 .000 .045
Educational Level
CC .129** -.240** -.143** .119* -.230** .179** .104*
Sig. .010 .000 .004 .017 .000 .000 .037
Marital sta-tus
CC -.295** -.289** .104* -.372** .193**
Sig. .000 .000 .037 .000 .000
Occupation CC -.211** -.281** -.294** .147**
Sig. .000 .000 .000 .003
Stay CC .098 .171** .219** -.098*
Sig. .050 .001 .000 .050
Daily ex-penditure
CC -.235** -.202** .124* -.315** .264**
Sig. .000 .000 .013 .000 .000
Mode of travel
CC -.109* .191** -.099* .167** .120*
Sig. .029 .000 .046 .001 .016
N 402 402 402 402 402 402 402 402
CC= Correlation coefficient; Sig = Sig. (2 label);**. Correlation is significant at the 0.01 level *. Correlation is significant at the 0.05 level
Study shows that travel group consti-tution influences "partake of tourists in pro-vision, creation, diffusion and/or consump-tion of tourist services and products", as well
147 Matovelle, P. A. T. ; Baez, S. Tourist experience measurement in Quito city
Rev. Bras. Pesq. Tur. São Paulo, 12(1), pp. 133-156, jan./abr. 2018.
Table 8 - Spearman coefficients of correlation between travel group variable and indicators corresponding to co-creation, entertainment, and personal development factors
Variable
Co-creation [Participation in the provision/creation
/diffusion/consumption of services or products in
Quito]
Entertainment [Out-doors and nature]
Personal develop-ment [Affective needs covered]
Travel group CC .099* -.111* .116*
Sig. .047 .026 .020
CC= Correlation coefficient; Sig = Sig. (2 label);**. Correlation is significant at the 0.01 level *. Correlation is significant at the 0.05 level
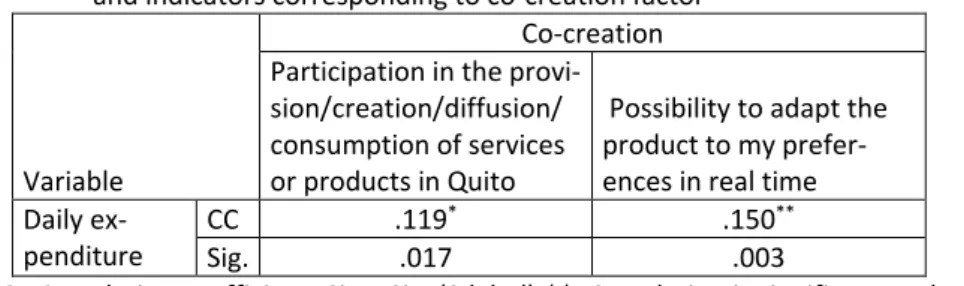
Similarly, it is found that daily ex-penditure is influential on the assessment given by tourists to co-creation; entertain-ment (obtained based on nature and out-doors, party atmosphere, shows and con-certs, and art and culture); personal develop-ment (based on learning and education, needs for self-fulfillment, and emotional in-telligence); social interaction; rational quality
(appreciated in terms of affordable prices, comfort, ease of finding places, public trans-portation, service attributes, and profession-alism in customer service); as well as in the practice of values such as discipline, integrity and reciprocity. Values of Spearman coeffi-cient are shown in Tables 9 through 13 be-low.
Table 9 - Spearman coefficient of correlation between diary expenditure variable and indicators corresponding to co-creation factor
Variable
Co-creation Participation in the provi-sion/creation/diffusion/ consumption of services or products in Quito
Possibility to adapt the product to my prefer-ences in real time Daily
ex-penditure
CC .119* .150**
Sig. .017 .003
CC= Correlation coefficient; Sig = Sig. (2 label);**. Correlation is significant at the 0.01 level *. Correlation is significant at the 0.05 level
Table 10 - Spearman coefficient of correlation between diary expenditure variable and indicators corresponding to entertainment factor
Variable
Entertainment
Outdoors and nature
Party at-mosphere
Shows and con-certs
Arts and culture Daily
ex-penditure
CC .172** -.409** -.207** .194**
Sig. .001 .000 .000 .000
Table 11 - Spearman coefficient of correlation between daily expenditure variable and indicators corresponding to personal development factor
Variable Personal development Learning and educa-tion Self-realization needs covered Emotional intelligence Daily ex-penditure
CC .151** -.119* .239**
Sig. .002 .017 .000
CC= Correlation coefficient; Sig = Sig. (2 label);**. Correlation is significant at the 0.01 level *. Correlation is significant at the 0.05 level
Table 12 - Spearman coefficient of correlation between daily expenditure variable and indicators corresponding to relational development and rational quality factors
Variable
Relational
development Rational quality
Soc ial I nterac ti on Afforda bl e pri ces Tr ave l comfort E asy to fi n d lo cati ons Pr acti cal publ ic tra ns-portati on Attri bu
tes of s
erv ice Pr ofess ional ism an d ski ll s that are d em on-str ated i n cust ome r ser vi ce Daily ex-penditure
CC -.227** .218** .258** .202** -.231** .301** .358**
Sig. .000 .000 .000 .000 .000 .000 .000
CC= Correlation coefficient; Sig = Sig. (2 label);**. Correlation is significant at the 0.01 level *. Correlation is significant at the 0.05 level
Table 13 - Spearman coefficient of correlation between daily expenditure variable and indicators corresponding to responsibility factor
Variable
Responsibility
Integrity Discipline Reciprocity Daily
ex-penditure
CC .156** .112* .155**
Sig. .002 .025 .002
CC= Correlation coefficient; Sig = Sig. (2 label);**. Correlation is significant at the 0.01 level *. Correlation is significant at the 0.05 level
The variable "stay" influences aspects such as: sports and recreational activities, fun, party atmosphere, and arts and culture within the entertainment factor; expand ho-rizons, needs for affection, self-fulfillment and emotional intelligence, within the factor of personal development; social interaction;
149 Matovelle, P. A. T. ; Baez, S. Tourist experience measurement in Quito city
Rev. Bras. Pesq. Tur. São Paulo, 12(1), pp. 133-156, jan./abr. 2018.
Table 14 - Spearman coefficient of correlation between stay variable and indicators corresponding to enter-tainment factor
Variable
Entertainment
Fun and sport activities Enjoyment
Party at-mosphere
Shows and concerts
Arts and culture
Stay CC .125* .111* .340** .199** -.123*
Sig. .012 .026 .000 .000 .013
CC= Correlation coefficient; Sig = Sig. (2 label);**. Correlation is significant at the 0.01 level *. Correlation is significant at the 0.05 level
Table 15 - Spearman coefficient of correlation between stay variable and indicators corresponding to personal development and relational development factors
Variable
Personal development
Relational development
Expand ho-rizons
Affective needs covered
Self- realization needs covered
Emotional in-telligence
Social inter-action
Stay CC .129** .174** .121* -.140** .332**
Sig. .010 .000 .015 .005 .000
CC= Correlation coefficient; Sig = Sig. (2 label);**. Correlation is significant at the 0.01 level *. Correlation is significant at the 0.05 level
Table 16 - Spearman coefficient of correlation between stay variable and indicators corresponding to rational quality factor
Variable
Rational quality
Affordable prices
Travel com-fort
Easy to find loca-tions
Practical pub-lic
transporta-tion
Professionalism and skills that are demonstrated in customer service
Stay CC -.127* -.223** -.145** .275** -.165**
Sig. .011 .000 .004 .000 .001
CC= Correlation coefficient; Sig = Sig. (2 label);**. Correlation is significant at the 0.01 level *. Correlation is significant at the 0.05 level
In addition, study shows that depend-ing on tourist nationality, motive that drives them to tell their experiences differs be- tween prestige, pride, status, honor, respect, and self-realization. Likewise, educational level influences these reasons except self-re-alization, where no association between var-iables was found. The marital status of tour-ists, basically seems to influence four of the motivations studied: prestige, pride, honor, and respect. The calculated values of the
sense of satisfaction as long as tourist had partaken on provision, creation, diffusion and/or consumption of services and produc-
ts; and, have had the possibility of adapting product to their preferences in real time.
Table 17 - Spearman coefficient of correlation between nationality, educational level, and marital status vari-ables and indicators corresponding to motivational factor
Variable Motivation
Pr
esti
ge
Pr
ide
Statu
s
Ap
p
earan
ces
Honor Respec
t
Reputati
on
Sel
f-real
izati
on
Nationality CC -.249** -.232** -.129** -.142** -.200** -.227** -.274** -.116*
Sig. .000 .000 0.01 .004 .000 .000 .000 0.020
Educational level
CC .188** .167** .178** .185** .180** .160** .205**
Sig. .000 .001 .000 .000 .000 .001 .000
Marital status CC .112* .149** .105* .119*
Sig. .024 .003 .036 .017
CC= Correlation coefficient; Sig = Sig. (2 label);**. Correlation is significant at the 0.01 level *. Correlation is significant at the 0.05 level
Finally, it is also found that aspects of entertainment such as sports and recrea-tional activities, nature and outdoors, fun, need for affection, and self-realization, cul-tural enrichment, and emotional intelligence,
151 Matovelle, P. A. T. ; Baez, S. Tourist experience measurement in Quito city
Rev. Bras. Pesq. Tur. São Paulo, 12(1), pp. 133-156, jan./abr. 2018.
Table 18 - Spearman coefficient of correlation between feeling of satisfaction and selected variables Feeling of satisfaction compared to: CC. Sig.
Uniqueness Unique resources .194** .000
History and singularity of the place .182** .000
Particular climate .256** .000
Unique tourism product .223** .000
Unique environmental quality .163** .001
Characteristic food of the place .277** .000
Unique idiosyncrasy of the people of the area .290** .000 Co-creation Participation in the provision / creation / diffusion /
consump-tion of services or products in Quito .171
** .001
Possibility to adapt the product to my preferences in real time .158** .001
Entertainment Fun and sport activities .170** .001
Outdoors and nature .255** .000
Enjoyment .307** .000
Arts and culture .348** .000
Personal develop-ment
Learning and education .225** .000
Cultural interest .224** .000
Expand horizons .124* .013
Affective needs covered .193** .000
Self-realization needs covered .132** .008
Cultural enrichment .294** .000
Emotional intelligence .198** .000
Rational quality Affordable prices .170** .001
CC= Correlation coefficient; Sig = Sig. (2 label);**. Correlation is significant at the 0.01 level *. Correlation is significant at the 0.05 level
3.5 Importance-performance assessment of tourist experience in Quito
The evaluation of tourists’ experience in Quito through the matrix of importance- performance, shows that the dimensions uniqueness, multisensory, rational quality, and personal development are located in the first quadrant, which explains that the expe-rience of tourists from these dimensions is equivalent to the importance given by them. In other words, it is considered that in these dimensions, Quito has offered the tourist what he has expected.
Likewise, the dimensions of relational development and responsibility are in the
second quadrant, which translates as weak aspects of tourists’ experience in the sense that they are perceived below their expecta-tions. Accordingly, opportunities for rela-tional development and practice of values linked to responsibility in Quito have not been enough to be up to the importance they have in the perspective of the tourist who vis-its the city.
Finally, in the fourth quadrant is moti-vation as a dimension related to the desire to achieve experiences worthy of being commu-nicated to friends and family. This is ex-plained as an aspect to which tourists give lit-
tle importance but which, nevertheless, has been perceived with a high valuation in the city. Figure 2 below shows the importance-performance matrix.
Figure 2 -Tourist experience in Quito: Importance-performance analysis matrix
4 DISCUSSION
Based on hypothesis confirmation made in previous works by authors as: Mar-tin, Castellanos and Oviedo (2010); Chen and Chen (2010), Rodríguez, Frías and Castañeda (2012); Naehyun, Lee and Lee (2015); and Cevdet & Erkut (2015); that places experi-ence as a forerunner of consumer tion in tourism, and assuming that a satisfac-tory experience is one that produces a high sense of satisfaction, it can be inferred within the framework of this investigation, that the tourist experience in Quito is highly satisfac-tory and is linked to 5 factors: uniqueness, co-creation, entertainment, personal devel-opment, and rational quality; measures by a set of 21 indicators for which statistical cor-relation was found and which are: unique re-sources, history and uniqueness of the place,
particular climate, unique tourism products, quality of the environment, local food, unique idiosyncrasy of local people, partici-pation in services and products, adaptation of the product to tourist preferences in real time, sports and recreational activities, na-ture and outdoors, fun, arts and culna-ture, ed-ucation and learning, cultural interest, ex-pand horizons, needs for affection and self-fulfillment, cultural enrichment and emo-tional intelligence, and affordable prices.
5 CONCLUSIONS
This research establishes empirical valid-ity of dimensions and indicators proposed by the authors Pulido and Navarro (2014), for the context of Quito as a destination and its tourist demand.
153 Matovelle, P. A. T. ; Baez, S. Tourist experience measurement in Quito city
Rev. Bras. Pesq. Tur. São Paulo, 12(1), pp. 133-156, jan./abr. 2018. ence factors do not have the same
im-portance for tourists surveyed; conversely, statistical differences were significant in 87.5% of the paired combinations of dimen-sions. This must be understood keeping in mind the type of destination that represents Quito (city) and its dominant product lines (urban and cultural), since the valuation could vary in other types. In this same aspect, it can be considered that none of the factors obtained a very high valuation, but rather a predominance of the high valuation was ob-served.
Characteristics of tourists as gender, age, educational level, marital status, and oc-cupation; as well as travel preferences in terms of stay, daily expense, and mode of travel, influence the importance they assign to most factors of their experience (8 out of 9). These aspects represent valuable infor-mation with implications for products struc-turing and destination integral management. Correlation found among socio-demographic variables, suggests the implementation of differentiated strategies considering gender, age, educational level, occupation, national-ity, and travel group to stimulate stay and the average daily expenditure.
Similarly, study provides key infor-mation for management, at the level of influ-ential indicators of tourist satisfaction. Thus, it is found that the unique history of the city, the arts and culture are highly appreciated as aspects of the tourist experience in Quito, followed by local food and idiosyncrasies which should be protected to ensure their permanence over time. Along the same lines, other attributes of the city and the service that should be maintained are: nature and
outdoors, recreational sports activities, fun, social interaction, prices, comfort, ease of lo-cation, quality and professionalism related to the service.
Tourists participation is the least val-ued aspect in the city, followed by public transportation, party atmosphere, and con-certs and shows. This calls for reflection of the city tourist actors in order to take correc-tive actions. At an intermediate level, that is, oscillating between a high and a low valua-tion, there is the unique quality of the tourist product and the environmental quality of the city.
From an integral perspective of im-portance-performance, assessment of tour-ist experience in Quito reveal that into di-mensions as uniqueness, multisensory, ra-tional quality, and personal development, the tourist expectations are balanced with what they obtained during their trip; while dimensions as relational development and responsibility are perceived below their ex-pectations.
REFERENCES
Aho, S. (2001). Towards a general theory of
touristic experiences: Modelling experience process in tourism. Tourism Review, 56(3/4), 33 – 37.
Bosangit, C., Hibbert, S., & McCabe, S. (2015).
‘‘If I was going to die I should at least be having fun”: Travel blogs, meaning and tourist
experi-ence. Annals of Tourism Research, 55, 1-14.
Burns, P., & Holden, A. (1995). Tourism: A new
Carballo, F., Moreno, S., León, C., & Ritchie, J. (2015). La creación y promoción de experien-cias en un destino turístico: un análisis de la
in-vestigación y necesidades de actuación. Cuadernos de Turismo, (35), 71-94.
Cetin, G., & Bilgihan, A. (2015). Components of
cultural tourists’ experiences in destinations.
Current Issues in Tourism, (February), 1-18. doi: 10.1080/13683500.2014.994595
Cevdet, M., & Erkut, B. (2015). Cultural tourism
in Istanbul: The mediation effect of tourist ex-perience and satisfaction on the relationship between involvement and recommendation in-tention. Journal of Destination Marketing &
Management, Article in press.
http://dx.doi.org/10.1016/j.jdmm.2015.06.00 3i
Chen, C., & Chen, F. (2010). Experience quality,
perceived value, satisfaction and behavioral in-tentions for heritage tourists. Tourism
Mana-gement, 31(1), 29–35.
Fusté Forné, F., & Nava Jiménez, C. (2015). La
Experiencia Turística y su Crítica Intercultural. Turismo em Análise, 26(4), 843-858.
Hernández, F., Vargas J., & Aguilar, J. (2015) El efecto emocional de una experiencia turística:
el mercado de artesanías de Oaxaca, México. Cathedra et Scientia. International Journal, 1(1), 147-154.
Hossany, S. & Gilbert, D. (2014). Measuring
Tourists’ Emotional Experiences toward
He-donic Holiday Destinations. Journal of Travel
Research, 49(4), 513–526.
Hosany, S., & Witham, M. (2010). Dimensions
of cruisers’ experiences, satisfaction, and
in-tention to recommend. Journal of Travel
Re-search, 49(3), 351-364.
Ingram, C., Caruana, R., & McCabe, S. (2017). Participative inquiry for tourist experience
Claire. Annals of Tourism Research, 65, 13-24.
Karayilan, E., & Cetin G. (2016). Tourism Desti-nation: Design of Experiences. En: M. Sotiriadis & D. Gursoy (Eds.) The Handbook of Managing
and Marketing Tourism Experiencies. (pp. 65-84) Bingley: Emerald Group Publishing Limited.
Kim, H., Ritchie, J., & McCormick, B. (2010). De-velopment of a Scale to Measure Memorable
Tourism Experiences. Journal of Travel Re-search, 51(1), 12–25.
Kim, J. (2014). The antecedents of memorable
tourism experiences: The development of a scale to measure the destination attributes as-sociated with memorable experiences. Tourism
Management,44, 34-45.
Larsen, S. (2007). Aspects of a Psychology of the Tourist Experience. Scandinavian Journal of
Hospitality and Tourism, 7(1), 7-18.
Martin, D., Castellanos, M., & Oviedo, M.
(2010). A visitor’s evaluation index for a visit to
an archaeological site. Tourism Management, 31(5), 590–596
155 Matovelle, P. A. T. ; Baez, S. Tourist experience measurement in Quito city
Rev. Bras. Pesq. Tur. São Paulo, 12(1), pp. 133-156, jan./abr. 2018. Naehyun, J., Lee, S., & Lee, H. (2015). The effect
of Experience Quality on Perceived Value, Sat-isfaction, Image and Behavioral Intention of
Water Park Patrons: New versus Repeat Visi-tors. Internacional Journal od Tourism Re-search, 17: 82-95. doi: 10.1002/jtr.1968
Nunnally, J., & Bernstein, I. (1994). Psychomet-ric theory (3rd ed.). New York: McGraw Hill
Oakeshot, M. (1933) Experiences and its modes. Cambridge Philosophy Classics Edition,
Cambridge: Cambridge University Press.
Otto, J., & Ritchie, J. (1996). The service expe-rience in tourism. Tourism Management, 17(3), 165-174.
Park, S. & Almeida, C. (2016) Exploring the Tourist Experience: A Sequential Approach.
Journal of Travel Research, (January), 1-12.
Pine, J., & Gilmore, J. (1998). Welcome to the Experience Economy. Harvard Business
Re-view, 76(4), 97-105.
Prayag, G., Hosany, S., & Odeh, K. (2013). The role of tourists' emotional experiences and sat-isfaction in understanding behavioral inten-tions. Journal of Destination Marketing &
Man-agement, 2, 118-127.
Pulido, J., & Navarro, U. (2014). Identificación de ítems para medir las experiencias del turista en destino. Cultur, Revista de Cultura e
Tu-rismo,8(1), 4-34.
Rodríguez, M., Frías, D., & Castañeda, J. (2013). The moderating role of past experience in the
formation of a tourist destination’s image and
in tourists’ behavioural intentions. Current
Is-sues in Tourism, 16(2), 107 –127. doi:
10.1080/13683500.2012.665045
Ryan, C. (2010). Ways of Conceptualizing the Tourist Experience: A Review of Literature. Tourism Recreation Research, 35(1), 37-46
Rivera, M. (2013). El turismo experiencial como forma de turismo responsable e intercultural. Universidad de Córdova, Cátedra Intercultural (Eds). Jornadas sobre Investigación e
Innova-ción para la Interculturalidad. (pp. 199-217) Córdoba, España
Sernatur (2016). Manual de Diseño Experien-cias Turísticas. Verde Ltda. Santiago, Chile. 103
p.
Sharpley, R., & Stone, P. (2011). Introduction: Thinking about the tourist experience. En: R.
Sharpley & P. R. Stone (Eds.), Tourism experi-ence; contemporary perspectives, (pp.1-8). Ab-ingdon, Oxon: Routledge.
Tussyadiah, L. (2014). Toward a Theoretical
Foundation for Experience Design in Tourism.
Journal of Travel Research, 53(5), 543–564
Wearing, S., & Foley, C. (2017). Understanding
the tourist experience of cities. Annals of
Tour-ism Research, 65, 97–107.
______________
Information on the authors
aca-demic interests include tourist destination com-petitiveness, planning and management, socio-cultural impacts of tourism development; tour-ism safety and security, tourtour-ism and consumer behavior; managing cultural and heritage tour-ism; community based tourtour-ism; and sustainable tourism. E-mail: pablotorresmato-velle@gmail.com / pablo_t@ftur.uh.cu - ORCID: 0000-0001-9634-6353