The relationship between malnutrition and
quality of life in haemodialysis and peritoneal
dialysis patients
Serkan Günalay1
Yasemin Kiliç Öztürk1
Harun Akar2
Haluk Mergen1
1. University of Health Sciences, Izmir Tepecik Health Research and Application Center - Department of Family Medicine, Yenişehir/İzmir, Turkey
2. University of Health Sciences, Izmir Tepecik Health Research and Application Center, Department of Internal Medicine, Izmir,Turkey.
http://dx.doi.org/10.1590/1806-9282.64.09.845
SUMMARY
BACKGROUND: One of the most important factors affecting the quality of life of chronic kidney disease (CKD) patients is nutrition. Pre-vention of malnutrition increases patients’ quality and length of life. In this study, we aimed to determine the frequency of malnutrition, quality of life, and the relationship between them in patients with end-stage renal disease (ESRD).
METHOD: The study was conducted with a total of 60 CKD patients including 50 haemodialysis patients and 10 peritoneal dialysis patients. Patients’ data associated with socio-demographics, body mass index (BMI), waist circumference, triceps skin-fold thickness (TSFT), pre-dialysis systolic and diastolic blood pressure, Kt/V and urea reduction ratio (URR) values, laboratory parameters, Mini-Nu-tritional Assessment-Short Form (MNA-SF) and European Quality of Life 5-Dimensions (EQ5D) scale were recorded.
FINDINGS: Of the total 60 patients; 27 were male (45%), 33 were female (55%), 83.3% were receiving haemodialysis treatment (HD), and 16.7% were receiving peritoneal dialysis treatment (PD). The mean MNA-SF score was 10.4 ± 2.8 in the HD group and 10.5 ± 2.9 in the PD group; there was no difference between the scores of the HD and PD groups. The mean EQ5D score was 0.60 ± 0.29 in the HD group and 0.68 ± 0.33 in the PD group, no significant difference was found between the HD group and the PD group. The quality of life was found lower in malnourished group (p=0.001).
CONCLUSION: The quality of life needs to be increased by early diagnosis and treatment of malnutrition in patients at risk.
KEYWORDS: Renal insufficiency, chronic. Malnutrition. Quality of life. Nutrition assessment. Nutrition surveys. Surveys and question-naires.
DATE OF SUBMISSION: 25-Dec-2017 DATE OF ACCEPTANCE: 06-Jan-2018
CORRESPONDING AUTHOR: Serkan Günalay
University of Health Sciences, Izmir Tepecik Health Research and Application Center Department of Family Medicine – Yenişehir/İzmir, Turkey – 35180
E-mail: serkangunalay@hotmail.com
dryko38@gmail.com harunakar.md@gmail.com haluk.mergen@gmail.com
INTRODUCTION
Malnutrition is a frequent finding in patients with chronic kidney disease (CKD). The incidence of malnutrition is between 18-75% in haemodialysis patients and 10-50% in peritoneal dialysis patients, depending on the criterion that the patient is as-sessed by1,2. Malnutrition is associated with
de-layed recovery and an increase in hospitalization, susceptibility to infection, mortality, and
morbid-ity3-5. Chronic diseases are often associated with
chronic functional impairment and adversely af-fect the quality of life6. Malnutrition is one of the
factors affecting the quality of life7,8. Early
inter-vention in patients with malnutrition increases the quality of life and reduces mortality 9. It has been
early diagnosis and treatment of malnutrition is important10-12. Recent studies have led to the
con-clusion that the effects on improving the quality of life as well as on the long-term survival should be considered when evaluating the effectiveness of the treatment in chronic diseases13. There was
a close relationship between the quality of life, morbidity, and mortality in patients with end-stage renal disease (ESRD). Therefore, treatment options that will increase patients’ quality of life should be focused on14-18.
This study was aimed to evaluate the nutritional parameters, anthropometric parameters, and mal-nutrition status in order to determine the levels of the quality of life and to determine the relationship between malnutrition and the quality of life in pa-tients with CKD.
METHODS
This study was planned as a descriptive cross-sec-tional study and was conducted in İzmir Tepecik Training and Research Hospital between May 2016 and August 2016 following its approval by the local ethics committee. No sampling was done for the study; a total of 60 patients, including 50 haemodi-alysis patients and 10 peritoneal haemodihaemodi-alysis pa-tients, who received routine haemodialysis services at the Hospital, were over 18 years old, and volun-teered were included in the study. A questionnaire consisting of three sections was applied to all pa-tients. The first section included the socio-demo-graphic data, anthropometric measurements, and laboratory parameters; the second section included the Mini Nutritional Assessment-Short Form (MNA-SF) scale; and the third section included the Euro-pean Quality of Life 5-Dimensions (EQ-5D) general quality of life scale.
Mini Nutritional Assessment-Short Form (MNA-SF)
The MNA-SF scale was used to determine the patients’ malnutrition levels. MNA-SF is performed using verbal interrogation and anthropometric mea-surements19.
The MNA, developed by Guigoz et al.20,
con-tains eighteen questions. Patients are categorized as normal nutritional status, malnutrition risk, or malnutrition based on the result of evaluation. Sev-eral studies have shown that MNA correlates well
with nutritional intake, anthropometry, laboratory data, functional status, morbidity, mortality, and length of hospital stay20,21. In 2001, Cohendy et al.22
reviewed the MNA and developed a 6-item MNA-SF, a short form of the MNA, which was found to have high correlation in nutritional evaluation. The va-lidity and reliability test of MNA-SF were done by Kaiser et al. in 2009. The validity and reliability test of the Turkish version was done by Sarikaya23, in
2013.
European Quality of Life 5-Dimensions (EQ-5D) General Quality of Life Scale
In various diseases, the quality of life can be measured by using general health scales and/or disease-specific scales. The EQ-5D was developed in 1987 by EuroQol, the Western European Quality of Life Research Society. The EQ-5D general health scale has been translated into more than 60 languag-es, including Turkish, by the EuroQol group. It was first published in 1990 and has maintained the same features (5 dimensions) since 1991. The scale consists of two parts 24.
The EQ-5D index scale consists of five dimen-sions: mobility, self-care, usual activities, pain/dis-comfort, and anxiety/depression. In each dimension, the answer is one of the three options: there is no problem, there are some problems, and there are major problems. Thus, it is possible to define 243 (35=243) different health outcomes with the scale.
An index score ranging from -0.59 to 1 is calculated from the five dimensions of the scale. In the score function, a value of 0 indicates death and 1 indicates perfect health while negative values represent living unconscious, dependent on bed, etc. The coefficients produced by Dolan et al. 25 are used in calculating the
index score in the EQ-5D24.
EQ-5D VAS scale is a visual analogue scale where individuals grade their current health status and mark it on a thermometer-like scale. Thus, a quality of life score ranging from 0 to 100 is obtained. Turk-ish validity and reliability study for the EQ-5D gen-eral quality of life scale was conducted by Süt26, in
2011; Cronbach alpha value of the scale was found 0.86. EQ-5D has been successfully applied in chronic dialysis patients while being a general health mea-sure used in measuring quality of life27.
per-centages for categorical variables, and as mean and standard deviation for numerical variables. For mul-tiple-independent group comparisons with numeri-cal variables, analysis of variance (ANOVA) was used when the normal distribution was satisfied; Kruskal Wallis test was used when the normal distribution was not satisfied. For two-independent group com-parisons, t test was used when the normal distribu-tion was satisfied; Mann Whitney U test was used when not. For the categorical variables, Chi-square test was used for multiple and two-group compari-sons when conditions were satisfied. Pearson test was used for correlations between normal-distrib-uted numerical data; Spearman’s rho test was used when not. The level of statistical significance was considered to be p<0.05.
RESULTS
A total of 60 patients were included in the study, 83.3% were haemodialysis (HD) and 16.7% peritoneal dialysis (PD) patients. Socio-demographics of the pa-tients are shown in Table 1.
The clinical and anthropometric characteristics of the patients are shown in Table 2. The average triceps skin-fold thickness (TSFT) was found signifi-cantly higher in the PD group than the HD group (p=0.033). The presence of comorbid disease was significantly higher in the PD group than in the HD group (p=0.037). The frequency of hypertension as a comorbid disease was higher in the PD patients than in the HD patients (p=0.023).
When biochemical parameters were considered, the levels of parathormone (pth p=0.041), alkaline
TABLE 1: SOCIO-DEMOGRAPHICS AND BIOCHEMICAL DATA OF HD AND PD PATIENTS.
HD (%83, n:50)
PD
(%16.7, n:10) p value
Age (years) 50±18,9 52,4±15,1 0.71 Gender (%) Male
Female 4654 4060 0.728 Education (%) None
Elementary Middle School High School
44.0 36.0 16.0 4.0
40.0 30.0 10.0 20.0 Marital Status (%) Married
Single Widow
Separated-Divorced 50.0 26.0 18.0 6.0
70.0 20.0 10.0 0
0.834
Monthly Income (%) < 1,300 TL 1,300 TL 1,300-2,000 TL > 2,000 TL
76.0 22.0 0 2
50.0 40.0 10.0 0
0.096
Smoking (%) 26 10 0.427
phosphatase (alp, p=0.047), and potassium (p=0.041), were higher in the HD group while the levels of cal-cium (p=0.002), total cholesterol (p=0.024), total iron binding capacity (TIBC) (p=0.001), and transferrin (p=0.001) levels were higher in the PD group. Pa-tients’ biochemical data are summarized in Table 1.
Prevalence of malnutrition
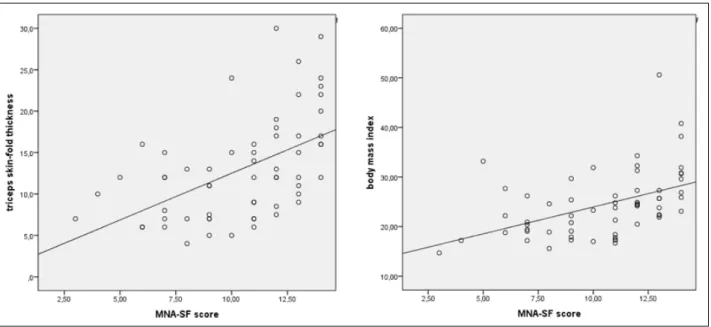
In the HD group, malnutrition risk was 34% and malnutrition was 20% while they were 30% and 10% in the PD group, respectively. The mean MNA-SF score was 10.4 ± 2.8 in the HD group and 10.5 ± 2.9 in the PD group. There was no significant difference between HD and PD groups in terms of malnutrition (p=0.936). The comparison of various aspects of the patients in terms of the malnutrition classification is shown in Table 3. Correlation between malnutrition score and TSFT and BMI show in figure 1. (p<0.001,
p<0.001).
Quality of life
The mean EQ5D index score was found 0.60 ± 0.29 (min -0.086, max 1) in the HD group while it was 0.68 ± 0.33 (min -0.166, max 1) in the PD group. The EQ5D VAS score was 66.7 ± 22.3 (min 20, max 100) in the HD group while it was 58.1 ± 13.1 (min30 max 76) in the PD group. No significant difference was found between the HD group and the PD group in terms of quality of life.
When the answers to the EQ-5D scale were ex-amined in terms of comorbidity, it was found that the patients with comorbid coronary artery disease
(CAD) had significantly more complaints than the non-CAD patients only in terms of mobility (p=0.007) and usual activities (p=0.028).
There was a negative correlation between EQ-5D score and age (r=-0,459 p<0,001). There was a posi-tive correlation between EQ-5D score and Kt/V ratio (r=0,262 p=0,043). There was no correlation between EQ-5D score and duration of CKD/ duration of dialy-sis/ haemoglobin/ albumin / phosphorus/ calcium (r=-0.013 p=0.920, r=-0.012 p=0.926, r=-0.108 p=0.413, r=0.189 p=0.147, r=0.202 p=0.122, r=0.203 p=0.119)
Malnutrition - quality of life relationship
The mean EQ5D index score was 0.71 ± 0.22 in the nornutrition group, 0.64 ± 0.28 in the mal-nutrition-risk group, and 0.32 ± 0.33 in the malnu-trition group according to the MNA-SF classification. There was a significant difference between the EQ5D index scores of the groups (p=0.001).
The mean EQ5D VAS score was 71.8 ± 17.5 in the normal-nutrition group, 63.5 ± 21.5 in the malnutri-tion-risk group, and 51.1 ± 23.7 in the malnutrition group according to the MNA-SF classification. There was a significant difference between the EQ5D VAS scores of the groups (p=0.017).
DISCUSSION
Chronic kidney disease (CKD) is an important global public health problem because of the increas-ing prevalence, high cost of treatment, and its nega-tive impact on the quality of life. As well as being a
TABLE 2: CLINICAL AND ANTHROPOMETRIC CHARACTERISTICS OF PATIENTS.
All Groups HD (%83, n:50) PD (%16,7, n:10) P CKD Duration (months) 68.4±62 68.5±62.9 68±60.6 0.980 Dialysis Duration (months) 51±44.7 53.5±48.3 38.5±14.2 0.338 CKD Etiology (%) Unknown
Diabetes Hypertension Other
66.7 10.0 11.7 11.7
66.0 10.0 10.0 14.0
70.0 10.0 20.0 0
0.592
Presence of Comorbidity (%) Yes Diabetes Hypertension CAD Other
73.3 23.3 66.7 28.3 8.3
68 24 60 32 6
100 20 100 10 20
0.037 0.023
Skipping Dialysis Sessions (%) Never
Once to Thrice 85.015.0 8812 7030 0.163 BMI (kg/m2) 24.4±6.6 24.2±7 25.5±4.1 0.572 Waist Circumference (cm) 93.4±16.2 92.3±16.9 98.7±10.7 0.264 TSFT (mm) 12.9±6.2 12.2±5.6 16.8±7.6 0.033
IDWG (gr) 2330±1217 N/A
Kt/V 1.6±0.5 1.4±0.3 2.5±0.6 < 0.001
URR 70.4±6.7 N/A
Systolic BP (mm/Hg) 137±30 145±23 0.471 Diastolic BP (mm/Hg) 80±18 88±17 0.346
Abbreviations: CAD, coronary artery disease; IDWG, interdialytic weight gain; URR, urea reduction ratio; BP, blood pressure;
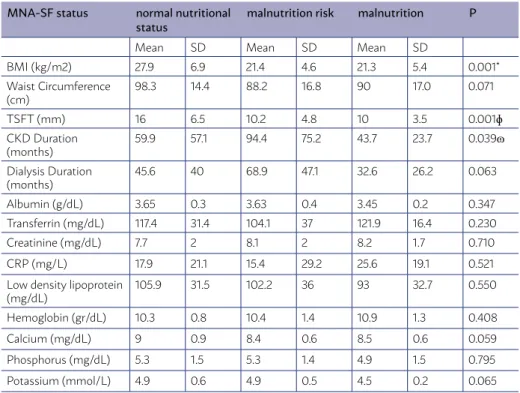
TABLE 3: COMPARISON OF VARIOUS ASPECTS OF THE PATIENTS IN TERMS OF THE MALNUTRITION RATING.
MNA-SF status normal nutritional
status malnutrition risk malnutrition P
Mean SD Mean SD Mean SD
BMI (kg/m2) 27.9 6.9 21.4 4.6 21.3 5.4 0.001* Waist Circumference
(cm) 98.3 14.4 88.2 16.8 90 17.0 0.071 TSFT (mm) 16 6.5 10.2 4.8 10 3.5 0.001ɸ
CKD Duration
(months) 59.9 57.1 94.4 75.2 43.7 23.7 0.039ɷ Dialysis Duration
(months)
45.6 40 68.9 47.1 32.6 26.2 0.063 Albumin (g/dL) 3.65 0.3 3.63 0.4 3.45 0.2 0.347 Transferrin (mg/dL) 117.4 31.4 104.1 37 121.9 16.4 0.230 Creatinine (mg/dL) 7.7 2 8.1 2 8.2 1.7 0.710 CRP (mg/L) 17.9 21.1 15.4 29.2 25.6 19.1 0.521 Low density lipoprotein
(mg/dL)
105.9 31.5 102.2 36 93 32.7 0.550 Hemoglobin (gr/dL) 10.3 0.8 10.4 1.4 10.9 1.3 0.408 Calcium (mg/dL) 9 0.9 8.4 0.6 8.5 0.6 0.059 Phosphorus (mg/dL) 5.3 1.5 5.3 1.4 4.9 1.5 0.795 Potassium (mmol/L) 4.9 0.6 4.9 0.5 4.5 0.2 0.065
common finding in individuals with CKD, malnutri-tion is associated with increased mortality and mor-bidity. Malnutrition, in itself, also has a negative im-pact on the quality of life. Prevention of malnutrition increases the quality and length of life in patients.
The prevalence of malnutrition in patients with CKD is between 18-75% in haemodialysis patients and 10-50% in peritoneal dialysis patients, depend-ing on the criterion that the patient is assessed with. Malnutrition in chronic renal failure is often due to decreased energy intake associated with uremic syn-drome and systemic chronic inflammation2. In
pa-tients who have not started renal replacement ther-apy, when GFR is lower than 50 mL/dL, oral intake has begun to deteriorate in patients and malnutrition has been established28.
In our study, 34% of the patients in the HD group were under malnutrition risk and 20% was malnour-ished; these were 30% and 10% in the PD group, re-spectively. The relatively low PD patient count is limitation of our study. Studies conducted on large patient populations throughout the world have shown that the MNA test may detect nutritional defi-ciencies even if the patient’s albumin level and body mass index (BMI) are within the normal ranges, and that hypoalbuminemia may be present in patients with normal nutritional status as well as the albumin levels of malnourished patients may be normal29-34.
In a study by Erdoğan35, biochemical parameters
of patients in various malnutrition categories were compared and it was found that the albumin, creati-nine, low density lipoprotein (LDL), haemoglobin lev-els were lower in the malnourished group but there was not a significant difference in calcium and phos-phorus levels.
When biochemical parameters of patients in var-ious malnutrition categories in our study were com-pared, it was found that the albumin, creatinine, LDL, haemoglobin, calcium, potassium, and phosphorus levels were not significantly different. The study by Girija and Radha36 also did not find a relationship
be-tween malnutrition level and albumin level.
In a study by Rammohan and Aplasca37, triceps
skin-fold thickness (TSFT) was found to be an im-portant anthropometric measure for detecting mal-nutrition. In a study conducted by Janardhan et al.38,
nutritional score and TSFT were found to negative-ly correlated. In our study, it was also found that is TSFT was lower in malnourished patients. In a study by Kalantar-Zadeh et al.39, a negative correlation was
found between malnutrition score and BMI; similar results were also obtained in our study.
The quality of life in dialysis patients is related to the biochemical parameters such as haemoglo-bin, serum albumin level, phosphorus, and calcium; the Kt/V ratio, duration of dialysis, age, and gen-der14-18,40,41. In our study, Kt/V value was found to
cor-relate positively with the quality of life score. How-ever, there was no significant relationship between the quality of life and duration of CKD, duration of dialysis, the levels of albumin, phosphorus, and cal-cium in this study.
In previous studies, a significant relationship was found between the quality of life and age41-43. In our
study, a negative correlation was found between the EQ5D index score and age.
There are studies in literature, indicating a better quality of life with HD than with PD as well as the opposite44,45. In our study, although the mean EQ5D
score was higher in the PD group, this was not statis-tically significant.
It has been found in some studies that having comorbid disease adversely affects the quality of life46-49. A study by Şahin50 found lower physical
component scores for patients with CAD comorbid-ity. Similarly, in our study, patients with comorbid CAD diagnosis were found to have more complaints related to mobility and usual activities than patients without CAD.
In a study examining the malnutrition levels of the patients were in connection with the EQ5D in-dex score and the EQ5D VAS score, the EQ5D inin-dex score and the EQ5D VAS score decreased as the de-gree of malnutrition increased51. Similar results were
obtained in our study; the EQ5D index score and the EQ5D VAS score, which are the quality of life scores, were found to decrease with increasing malnutrition. The results obtained in our study were also similar to those of Jiménez-Redondo et al.52.
CONCLUSION
RESUMO
INTRODUÇÃO: O estado nutricional é um dos principais determinantes da qualidade de vida de pacientes com doença renal crônica (DRC) e a prevenção da desnutrição aumenta o tempo e a qualidade de vida nessa população. O objetivo do presente estudo foi determinar a prevalência de desnutrição, a qualidade de vida e a inter-relação entre esses fatores em pacientes com DRC em terapia dialítica.
MÉTODOS: Incluímos 60 pacientes com DRC estágio 5 sob terapia dialítica (50 pacientes em hemodiálise [HD] e 10 em diálise peritone-al [DP]). Os pacientes foram anperitone-alisados com relação aos seus dados sociodemográficos, índice de massa corporperitone-al (IMC), circunferência abdominal, dobra cutânea triciptal, pressão arterial sistólica e diastólica pré-diálise, Kt/V e índice de remoção de ureia, parâmetros laboratoriais, miniavaliação nutricional (MNA) e questionário EuroQol-5 Dimensions (EQ-5D).
RESULTADOS: Do total de pacientes, havia 27 homens (45%) e 33 mulheres (55%), 83,3% em HD e 16,7% em DP. O MNA médio foi 10,4 ± 2,8 nos pacientes em HD e 10,5 ± 2,9 naqueles em DP, não havendo diferença significativa entre os grupos. O EQ-5D médio foi 0,60 ± 0,29 nos pacientes em HD e 0,68 ± 0,33 naqueles em DP, não havendo diferença estatisticamente significativa entre os grupos. A qualidade de vida foi pior nos pacientes desnutridos (p=0,001).
CONCLUSÃO: O diagnóstico e o tratamento precoce da desnutrição são necessários para melhorar a qualidade de vida dessa população. PALAVRAS-CHAVE: Insuficiência renal crônica. Desnutrição. Qualidade de vida. Avaliação nutricional. Inquéritos nutricionais. Inquéritos e questionários.
REFERENCES
1. Hakim RM, Levin N. Malnutrition in haemodialysis patients. Am J Kidney Dis. 1993;21(2):125-37.
2. Caimi G, Carollo C, Lo Presti R. Pathophysiological and clinical aspects of malnutrition in chronic renal failure. Nutr Res Rev. 2005;18(1):89-97.
3. Canada-USA (CANUSA) Peritoneal Dialysis Study Group. Adequacy of
dialysis and nutrition in continuous peritoneal dialysis: association with clinical outcomes. J Am Soc Nephrol. 1996;7(2):198-207.
4. Allison SP. Malnutrition, disease and outcome. Nutrition. 2000;16(7-8):590-3.
5. Gündoğdu H. Protein-enerji malnutrisyonu. In: İliçin G, Ünal S, Biberoğlu
K, Akalin S, Süleymanlar G, eds. Temel İç Hastaliklari. Ankara: Güneş Ki-tabevi; 1996. p.1610-6.
6. Demirağ SA. Kronik Hastaliklar ve Yaşam Kalitesi. Sağlikli Yaşam Tarzi Dergisi. 2009;2:58-63.
7. Alvares J, Cesar CC, Acurcio FA, Andrade EI, Cherchiglia ML. Quality of
life of patients in renal replacement therapy in Brazil: comparison of treat-ment modalities. Qual Life Res. 2012;21(6):983-91.
8. Kring DL. Using the revised Wilson and Cleary model to explore factors affecting quality of life in persons on haemodialysis [Doctoral thesis]. Greensboro: The University of North Carolina; 2008.
9. Ferguson M, Capra S, Bauer J. Banks M. Quality of life in patients with malnutrition. J Am Diet Assoc. 1998;98(9 Suppl.):A22.
10. Laky B, Janda M, Kondalsamy-Chennakesavan S, Cleghorn G, Obenmair A. Pretreatment malnutrition and quality of life: association with pro-longed length of hospital stay among patients with gynecological cancer: a cohort study. BMC Cancer. 2010;10:232.
11. Sohrabi Z, Eftekhari MH, Eskandari MH, Rezaeianzadeh A, Sagheb MM.
Malnutrition-inflammation score and quality of life in haemodialysis pa-tients: is there any correlation? Nephrourol Mon. 2015;7(3):e27445.
12. Afşar B. Hemodiyaliz hastalarinda beslenme ve yaşam kalitesi. Turkiye Klinikleri J Nephrol-Special Topics. 2015;8(3):30-4.
13. Çaylan R. Kronik hepatitler ve yaşam kalitesi. In: Tabak F, Tekeli E, Balik İ,
eds. Viral hepatit. Istambul: Viral Hepatitle Savaşim Derneği; 2007. p.376-82.
14. Kalender N, Tosun N. Determination of the relationship between ad-equacy of dialysis and quality of life and self-care agency. J Clin Nurs. 2013;23(5-6):820-8.
15. Moattari M, Ebrahimi M, Sharifi N, Rouzbeh J. The effect of empower-ment on the self-efficacy, quality of life and clinical and laboratory indica-tors of patients treated with haemodialysis: a randomized controlled tria. Health Qual Life Outcomes. 2012;10:115.
16. Chan R, Brooks R, Erlich J, Gallagher M, Snelling P, Chow J, et al. How do clinical and psychological variables relate to quality of life in end-stage renal disease? Validating a proximal-distal model. Qual Life Res. 2014;23(2):677-86.
17. Özçetin A, Bicik Bahçebaşi Z, Bahçebaşi T, Cinemre H, Ataoğlu A. Diyaliz
uygulanan hastalarda yaşam kalitesi ve psikiyatrik belirti dağilimi. Anato-lian J Psychiatry. 2009;10:142-50.
18. Uğurlu N, Bastug D, Cevirme A, Uysal DD. Determining quality of life,
depression and anxiety levels of haemodialysis patients. Healt Med. 2012;6(8):2860-9.
19. Vellas B, Guigoz Y, Garry PJ, Nourhashemi F, Bennahum D, Lauque S, et al. The Mini Nutritional Assessment (MNA) and its use in grading the nu-tritional state of elderly patients. Nutrition. 1999;15(2):116-22.
20. Guigoz Y, Lauque S, Vellas BJ. Identifying the elderly at risk for malnutri-tion: The Mini Nutritional Assessment. Clin Geriatr Med. 2002;18(4):737-57.
21. Bauer JM, Vogl T, Wicklein S, Trögner J, Mühlberg W, Sieber CC. Comparison
of Mini Nutritional Assessment, Subjective Global Assessment, and Nutri-tional Risk Screening (NRS 2002) for nutriNutri-tional screening and assessment in geriatric hospital patients. Z Gerontol Geriatr. 2005;38(5):322-7.
22. Cohendy R, Rubenstein LZ, Eledjam JJ. The Mini Nutritional Assess-ment-Short Form for preoperative nutritional evaluation of elderly pa-tients. Aging (Milano). 2001;13(4):293-7.
23. Sarikaya D. Geriatrik hastalarda Mini Nütrisyonel Değerlendirme (MNA)
testinin uzun ve kisa (MNA-SF) formunun geçerlilik çalişmasi [Yayimlan-mamiş tipta uzmanlik tezi]. Ankara: Hacettepe Üniversitesi; 2013.
24. Drummond MF, O’Brien BJ, Stoddart GL, Torrance GW. Methods for the
economic evaluation of health care programmes. New York: Oxford Uni-versity Press, 1997.
25. Dolan P, Gudex C, Kind P, Williams A. The time trade-off method: results from a general population study. Health Econ. 1996;5(2):141-54.
26. Süt HK. Akut koroner sendromlu hastalarda yaşam kalitesi: EQ-5D
ölçeği-nin geçerlilik ve güvenilirlik çalişmasi. [Yüksek Lisans Tezi]. Edirne: Trakya Üniversitesi Sağlik Bilimleri Enstitüsü Hemşirelik Anabilim Dali İç Hasta-liklari Hemşireliği Yüksek Lisans Programi; 2009.
27. Wasserfallen JB, Halabi G, Saudan P, Perneger T, Feldman HI, Martin PY.
Quality of life on chronic dialysis: comparison between haemodialysis and peritoneal dialysis. Nephrol Dial Transplant. 2004;19(6):1594-9.
28. Ünal HÜ, Korkmaz M, Selçuk H. Kronik böbrek hastalarinda
malnütri-syon patogenezi ve değerlendirilmesi. Güncel Gastroenteroloji Dergisi. 2010;14(2):103-111.
29. Omran ML, Morley JE. Assessment of protein energy malnutrition in old-er pold-ersons, part I: History, examination, body composition, and screening tools. Nutrition. 2000;16(1):50-63.
30. Huffman GB. Evaluating and treating unintentional weight loss in the el-derly. Am Fam Physician. 2002;65(4):640-50.
31. Guigoz Y. The Mini Nutritional Assessment (MNA) review of the litera-ture: what does it tell us? J Nutr Health Aging. 2006;10(6):466-85.
32. Forse RA, Shizgal HM. Serum albumin and nutritional status. JPEN J
Par-enter Enteral Nutr. 1980;4(5):450-4.
(CSRG). Is serum albumin a marker of malnutrition in chronic disease? The scleroderma paradigm. J Am Coll Nutr. 2010;29(2):144-51.
34. Friedman AN, Fadem SZ. Reassessment of albumin as a nutritional
mark-er in kidney disease. J Am Soc Nephrol. 2010;21(2):223-30.
35. Erdoğan EY. Hemodiyaliz hastalarinda nutrisyonel durumun belirlenme-sinde biyoelektrik impedans analiz yöntemlerinin güvenilirliğinin saptan-masi [Uzmanlik Tezi]. Ankara: Başkent Üniversitesi Tip Fakültesi İç Hasta-liklari Anabilim Dali Tipta; 2013.
36. Girija K, Radha R. Correlation between Subjective Global Assessment (SGA) and serum albumin in haemodialysis patients. Int J Recent Sci Res. 2015;6(2):2790-3.
37. Rammohan M, Aplasca EC. Caliper method vs bioelectrical impedance analysis for determining body fat in patients undergoing chronic dialysis and in healthy individuals. J Am Diet Assoc. 1992;92(11):1395-7.
38. Janardhan V, Soundararajan P, Rani NV, Kannan G, Thennarasu P, Chacko
RA, et al. Prediction of malnutrition using modified Subjective Global As-sessment: dialysis malnutrition score in patients on haemodialysis. Indian J Pharm Sci. 2011;73(1):38-45.
39. Kalantar-Zadeh K, Kleiner M, Dunne E, Lee GH, Luft FC. A modified quantitative subjective global assessment of nutrition for dialysis patients. Nephrol Dial Transplant. 1999;14(7):1732-8.
40. Mapes DL, Lopes AA, Satayathum S, McCullough KP, Goodkin DA,
Lo-catelli F, et al. Health-related quality of life as a predictor of mortality and hospitalization: the Dialysis Outcomes and Practice Patterns Study (DOPPS). Kidney Int. 2003;64(1):339-49.
41. Mingardi G, Cornalba L, Cortinovis E, Ruggiata R, Mosconi P, Apolone G. Health-related quality of life in dialysis patients. A report from an Italian study using the SF-36 Health Survey. DIA-QOL Group. Nephrol Dial Transplant. 1999;14(6):1503-10.
42. Blake C, Codd MB, Cassidy A, O’Meara YM. Physical function, employment and quality of life in end-stage renal disease. J Nephrol. 1999;13(2):142-9.
43. Moreno F, López Gomez JM, Sanz-Guajardo D, Jofre R, Valderrábano F.
Quality of life in dialysis patients. A spanish multicentre study. Spanish Cooperative Renal Patients Quality of Life Study Group. Nephrol Dial Transplant. 1996;11(Suppl 2):125-9.
44. Merkus MP, Jager KJ, Dekker FW, de Haan RJ, Boeschoten EW, Krediet
RT. Physical symptoms and quality of life in patients on chronic dialysis: results of The Netherlands Cooperative Study on Adequacy of Dialysis (NECOSAD). Nephrol Dial Transplantat. 1999;14(5):1163-70.
45. Cameron JI, Whiteside C, Katz J, Devins GM. Differences in quality of life across renal replacement therapies: a meta-analytic comparison. Am J Kidney Dis. 2000;35(4):629-37.
46. Mittal SK, Ahern L, Flaster E, Maesaka JK, Fishbane S. Self-assessed phys-ical and mental function of haemodialysis patients. Nephrol Dial Trans-plant. 2001;16(7):1387-94.
47. Sayin A, Mutluay R, Sindel S. Quality of life in haemodialysis, peritoneal
dialysis, and transplantation patients. Transplant Proc. 2007;39(10):3047-53.
48. Stojanovic M, Stefanovic V. Assessment of health-related quality of life in
patients treated with haemodialysis in Serbia: influence of comorbidity, age, and income. Artif Organs. 2007;31(1):53-60.
49. Malindretos P, Sarafidis P, Spaia S, Sioulis A, Zeggos N, Raptis V, et al. Ad-aptation and validation of the Kidney Disease Quality of Life-Short Form questionnaire in the Greek language. J Nephrol. 2010;31(1):9-14.
50. Şahin MA. Yetişkin bireylerde diyet kalitesi ile yaşam kalitesi arasindaki il-işkinin değerlenlendirilmesi [Lisans Tezi]. Ankara: Hacettepe Üniversitesi Sağlik Bilimleri Enstitüsü Beslenme Bilimleri Programi Yüksek; 2014.
51. Kvamme JM, Olsen JA, Florholmen J, Jacobsen BK. Risk of malnutrition and health-related quality of life in community-living elderly men and women: the Tromsø study. Qual Life Res. 2011;20(4):575-82.