2019
UNIVERSIDADE DE LISBOA
FACULDADE DE CIÊNCIAS
DEPARTAMENTO DE FÍSICA
Continuous Monitoring of Vital Parameters for Clinically Valid
Assessment of Human Health Status
Neusa Rebeca Adão Martins
Mestrado Integrado em Engenharia Biomédica e Biofísica
Perfil Sinais e Imagens Médicas
Dissertação orientada por:
Dr. Alexandre Andrade
iii
Acknowledgments
First, I would like to express my deepest gratitude to God, for all He is and has done for me. Many thanks to my family. Words cannot describe my thankfulness for your support, care and love throughout my academic journey.
A special thanks to my supervisors, Alexandre Andrade and Simon Annaheim. Thank you very much for your support, guidance and constructive criticism during the entire process of producing this dissertation.
I would also like to acknowledge the valuable contribution of Isabelle Gentgen, Claire Guignier, Dario, Martin Camenzind, Michel Schmid, Piero Fontana and Patrick Eggenberger, to this work.
iv
Abstract
The lack of devices suitable for acquiring accurate and reliable measures of patients' physiolog-ical signals in a remote and continuous manner together with the advances in data acquisition technol-ogies during the last decades, have led to the emergence of wearable devices for healthcare. Wearable devices enable remote, continuous and long-term health monitoring in unattended setting. In this con-text, the Swiss Federal Laboratories for Material Science and Technology (Empa) developed a wearable system for long-term electrocardiogram measurements, referred to as textile belt. It consists of a chest strap with two embroidered textile electrodes. The validity of Empa’s system for electrocardiogram monitoring has been proven in a clinical setting. This work aimed to assess the validity of the textile belt for electrocardiogram monitoring in a home setting and to supplement the existing system with sensors for respiratory monitoring. Another objective was to evaluate the suitability of the same weara-ble, as a multi-sensor system, for activity monitoring.
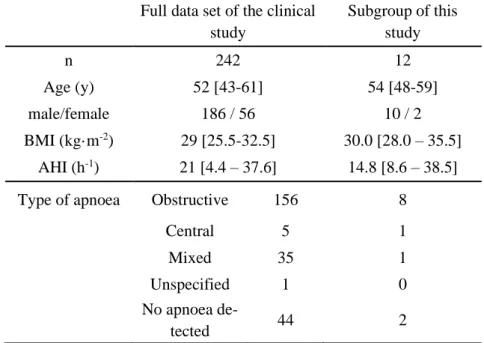
A study involving 12 patients (10 males and 2 females, interquartile range for age of 48–59 years and for body mass indexes of 28.0–35.5 kg.m-2) with suspected sleep apnoea was carried out. Overnight electrocardiogram was measured in a total of 28 nights. The quality of recorded signals was assessed using signal-to-noise ratio, artefacts detection and Poincaré plots. Study data were compared to data from the same subjects, acquired in the clinical setting. For respiratory monitoring, optical fibre-based sensors of different geometries were integrated into the textile belt. Signal processing algorithms for breathing rate and tidal volume estimation based on respiratory signals acquired by the sensors were developed. Pilot studies were conducted to compare the different approaches for respiratory monitoring. The quality of respiratory signals was determined based on signal segments “sinusoidality”, evaluated through the calculation of the cross-correlation between signal segments and segment-specific reference waves. A method for accelerometry-based lying position recognition was proposed, and the proof of concept of activity intensity classification through the combination of subjects’ inertial acceleration, heart rate and breathing rate data, was presented. Finally, a study with three participants (1 male and 2 females, aged 21 ± 2 years, body mass index of 20.3 ± 1.5 kg.m-2) was conducted to assess the validity of the textile belt for respiratory and activity monitoring.
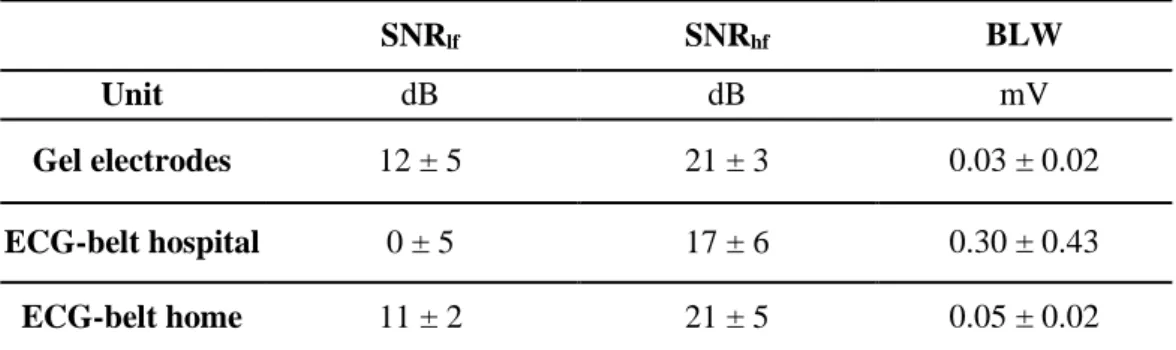
Electrocardiogram signals acquired by the textile belt in the home setting were found to have better quality than the data acquired by the same device in the clinical setting. Although a higher artefact percentage was found for the textile belt, signal-to-noise ratio of electrocardiogram signals recorded by the textile belt in the home setting was similar to that of signals acquired by the gel electrodes in the clinical setting. A good agreement was found between the RR-intervals derived from signals recorded in home and clinical settings. Besides, for artefact percentages greater than 3%, visual assessment of Poincaré plots proved to be effective for the determination of the primary source of artefacts (noise or ectopic beats).
Acceleration data allowed posture recognition (i.e. lying or standing/sitting, lying position) with an accuracy of 91% and positive predictive value of 80%. Lastly, preliminary results of physical activity intensity classification yielded high accuracy, showing the potential of the proposed method.
The textile belt proved to be appropriate for long-term, remote and continuous monitoring of subjects’ physical and physiological parameters. It can monitor not only electrocardiogram, but also breathing rate, body posture and physical activity intensity, having the potential to be used as tool for disease prediction and diagnose support.
Keywords: long-term electrocardiogram; respiratory monitoring; fibre optic sensing; activity
v
Resumo
Contexto: A falta de dispositivos adequados para a monitorização de sinais fisiológicos de um modo
remoto e contínuo, juntamente com avanços tecnológicos na área de aquisição de dados nas últimas décadas, levaram ao surgimento de wearable devices, i.e. dispositivos vestíveis, no sector da saúde.
Wearable devices possibilitam a monitorização do estado de saúde, de uma forma remota, contínua e de
longa duração. Quando feito em ambiente domiciliar, este tipo de monitorização (i.e. contínua, remota e de longa duração) tem várias vantagens: diminui a pressão posta sobre o sistema de saúde, reduz despesas associadas ao internamento e acelera a resposta a emergências, permitindo deteção precoce e prevenção de condições crónicas. Neste contexto, a Empa, Laboratórios Federais Suíços de Ciência e Tecnologia de Materiais, desenvolveu um sistema vestível para a monitorização de eletrocardiograma de longa duração. Este sistema consiste num cinto peitoral com dois elétrodos têxteis integrados. Os elétrodos têxteis são feitos de fio de polietileno tereftalato revestido com prata e uma ultrafina camada de titânio no topo. De modo a garantir a aquisição de sinais de alta qualidade, o cinto tem nele integrado um reservatório de água que liberta vapor de água para humidificar os elétrodos. Este reservatório per-mite a monitorização contínua de eletrocardiograma por 5 a 10 dias, sem necessitar de recarga. A vali-dade do cinto para a monitorização de eletrocardiograma em ambiente clínico já foi provada.
Objetivo: Este trabalho teve por objetivo avaliar a validade do cinto para a monitorização de
eletrocar-diograma em ambiente domiciliar e complementar o sistema existente com sensores para monitorização respiratória. Um outro objetivo foi analisar a adequação do cinto, como um sistema multisensor, para monitorização da atividade física.
Métodos: Um estudo com 12 pacientes com suspeita de apneia do sono (10 homens e 2 mulheres,
am-plitude interquartil de 48–59 anos para a idade e de 28.0–35.5 kg.m-2 para o índice de massa corporal) foi conduzido para avaliar a qualidade do sinal de eletrocardiograma medido em ambiente domiciliar. O sinal de eletrocardiograma dos pacientes foi monitorizado continuamente, num total de 28 noites. A qualidade dos sinais adquiridos foi analisada através do cálculo da razão sinal-ruído; da deteção de ar-tefactos, i.e., intervalos RR com um valor inviável de um ponto de vista fisiológico; e de gráficos de Poincaré, um método de análise não linear da distribuição dos intervalos RR registados. Os dados ad-quiridos neste estudo foram comparados com dados dos mesmos pacientes, adad-quiridos em ambiente hospitalar.
Para a monitorização respiratória, sensores feitos de fibra óptica foram integrados no cinto. Al-gorítmicos para a estimar a frequência respiratória e o volume corrente dos sujeitos tendo por base o sinal medido pelas fibras ópticas foram desenvolvidos neste trabalho. As diferentes abordagens foram comparadas através de estudos piloto. Diferentes métodos para avaliação da qualidade do sinal adquirido foram sugeridos.
Um método de reconhecimento da postura corporal através do cálculo de ângulos de orientação com base na aceleração medida foi proposto. A prova de conceito da determinação da intensidade da atividade física pela combinação de informações relativas á aceleração inercial e frequências cardíaca e respiratória dos sujeitos, é também apresentada neste trabalho. Um estudo foi conduzido para avaliar a validade do cinto para monitorização da respiração e da atividade física. O estudo contou com 10 parti-cipantes, dos quais 3 vestiram o cinto para monitorização da respiração (1 homem e 2 mulheres, idade 21 ± 2 anos, índice de massa corporal 20.3 ± 1.5 kg.m-2).
Resultados: O estudo feito com pacientes com suspeita de apneia do sono revelou que os sinais
eletro-cardiográficos adquiridos pelo cinto em ambiente domiciliar foram de melhor qualidade que os sinais adquiridos pelo mesmo dispositivo em ambiente hospitalar. Uma percentagem de artefacto de 2.87% ±
vi
4.14% foi observada para os dados adquiridos pelos elétrodos comummente usados em ambiente hospi-talar, 7.49% ± 10.76% para os dados adquiridos pelo cinto em ambiente domiciliar e 9.66% ± 14.65% para os dados adquiridos pelo cinto em ambiente hospitalar. Embora tenham tido uma maior percenta-gem de artefacto, a razão sinal-ruído dos sinais eletrocardiográficos adquiridos pelo cinto em ambiente domiciliar foi semelhante á dos sinais adquiridos pelos elétrodos de gel em ambiente hospitalar. Resul-tados sugerem uma boa concordância entre os intervalos RR calculados com base nos eletrocardiogra-mas registados em ambientes hospitalar e domiciliar. Além disso, para sinais com percentagem de arte-facto superior a 3%, a avaliação visual dos gráficos de Poincaré provou ser um bom método para a determinação da fonte primária de artefactos (batimentos irregulares ou ruído).
A monitorização da aceleração dos sujeitos permitiu o reconhecimento da postura corporal (isto é, deitado ou sentado/em pé) com uma exatidão de 91% e valor preditivo positivo de 80%. Por fim, a classificação da intensidade da atividade física baseado na aceleração inercial e frequências cardíaca e respiratória revelou elevada exatidão, mostrando o potencial desta técnica.
Conclusão: O cinto desenvolvido pela Empa provou ser apropriado para monitorização de
longa-dura-ção de variáveis físicas e fisiológicos, de uma forma remota e contínua. O cinto permite não só monito-rizar eletrocardiograma, mas também frequência respiratória, postura corporal e intensidade da atividade física. Outros estudos devem ser conduzidos para corroborar os resultados e conclusões deste trabalho. Outros sensores poderão ser integrados no cinto de modo a possibilitar a monitorização de outras vari-áveis fisiológicas de relevância clínica. Este sistema tem o potencial de ser usado como uma ferramenta para predição de doenças e apoio ao diagnóstico.
Palavras-chave: eletrocardiograma de longa duração; monitorização da respiração; sensorização por
vii
Contents
Acknowledgments ... iii
Abstract ... iv
Resumo... v
List of Figures ... viii
List of Tables ... ix
List of Abbreviations and Acronyms ... x
1. INTRODUCTION ... 1
1.1. Project scope and research plan ... 1
1.2. State of the art... 2
1.2.1. ECG monitoring ... 3
1.2.1.1. Textile Belt for Long-Term ECG monitoring ... 5
1.2.2. Respiratory Monitoring ... 6
1.2.3. Activity monitoring ... 10
1.2.4. Multi-sensor monitoring systems ... 12
2. ECG MONITORING ... 14
2.1. Quality assessment of ECG signal... 15
2.2. Study: ECG monitoring in a home setting ... 19
2.2.1 Results and discussion ... 20
2.2.2 Conclusions ... 24
3. RESPIRATORY MONITORING ... 25
4. ACTIVITY MONITORING ... 26
4.1. Physical Activity Intensity ... 26
4.1.1. Algorithm for physical activity intensity classification ... 28
4.2. Algorithm for body posture recognition ... 31
5. VALIDATION STUDY ... 33
6. CONCLUSION AND FUTURE WORK ... 34
REFERENCES ... 35
viii
List of Figures
Figure 1.1. Textile belt connected to data logger (red device). ... 6
Figure 2.1. Example of ECG wave of a healthy subject ... 14
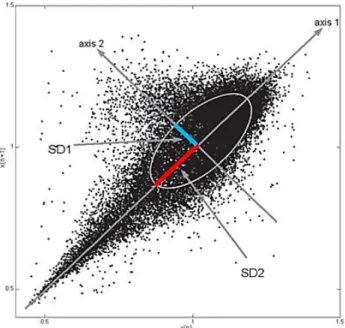
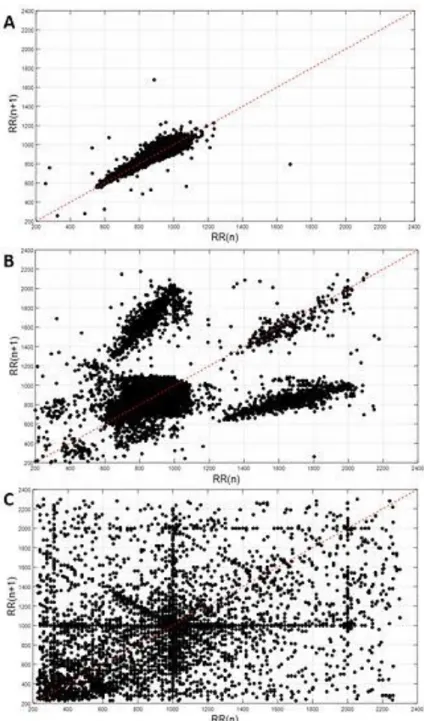
Figure 2.2. Example of Poincaré plot of a healthy subject ... 18
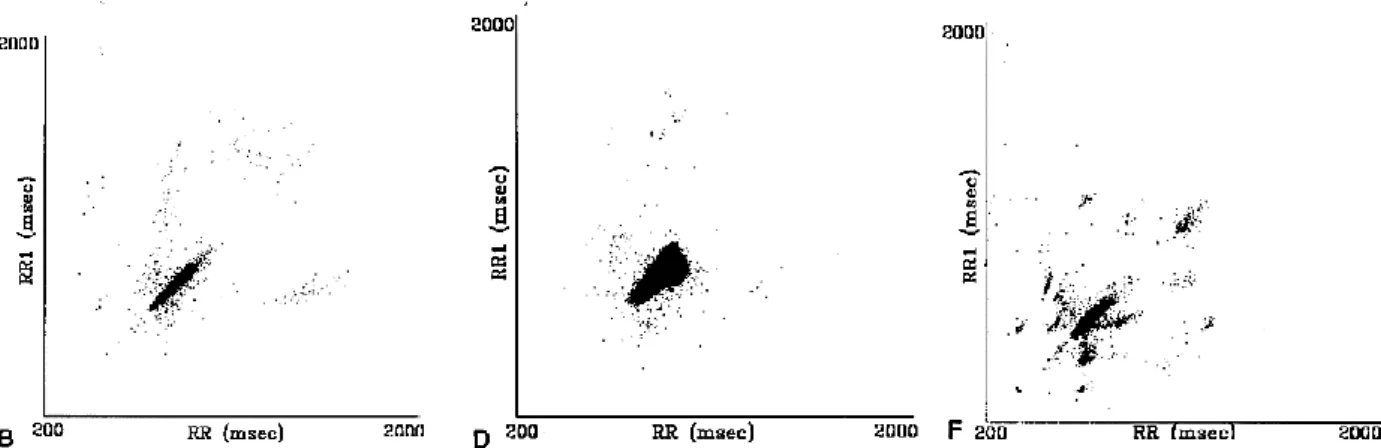
Figure 2.3. Example of pathological Poincaré plots ... 19
Figure 2.4. Example of Poincaré plot. ... 22
Figure 2.5. Boxplot of artefact percentage according to subjects lying position ... 23
Figure 4.1. Flow chart of the algorithm for activity intensity classification. ... 31
ix
List of Tables
Table 1.1. Wearable devices for remote, continuous and long-term ECG monitoring ... 5
Table 1.2. Optical fibre-based sensors for respiratory monitoring ... 9
Table 1.3. Wearable devices for remote, continuous and long-term respiratory monitoring ... 9
Table 1.4. Multi-sensor wearable devices for remote, continuous and long-term monitoring ... 13
Table 2.1. Description of study participants. Comparison with the clinical study ... 20
Table 2.2. Comparison of the quality of ECG signals recorded in the hospital (Gel electrodes and ECG-belt hospital) and at home (ECG-ECG-belt home). ... 21
Table 2.3. Artefact percentage of RR-intervals derived from the ECG recordings ... 21
Table 2.4. Correlation between artefact percentage and Poincaré plot descriptors (SD1, SD2 and SD1/SD2)... 23
x
List of Abbreviations and Acronyms
ACSM American College of Sports Medicine
AHI Apnea-hypopnea index
AUC Area under the curve
BLW Baseline wander
BMI Body mass index
bpm Beats per minute
BR Breathing rate
CE Conformité Européenne
dBc Decibels relative to the carrier DLW Doubly labeled water
ECG Electrocardiogram
EE Energy expenditure
Empa Swiss Federal Laboratories for Material Science and Technology FBG Fiber Bragg grating
FDA Food and Drug Administration FFT Fast Fourier transform
FOS Fiber optic sensor
HR Heart rate
HRV Heart rate variability ICU Intensive care unit LED Light-emitting diode LoA Limits of agreement LPG Long period granting MAE Mean absolute error
MAPE Mean absolute percentage error MET Metabolic equivalent of the task
mg Milligravity
MRI Magnetic resonance imaging
PPG Photoplethysmography
PPV Positive predictive value
PSG Polysomnography
RIP Respiratory inductive plethysmography ROC Receiver-operating characteristic RPE Rating of perceived exertion
SD Standard deviation
SEE Standard error of estimates SNR Signal-to-noise ratio SQA Signal quality assessment TEE Total energy expenditure
TV Tidal volume
USB Universal serial bus WHO World Health Organization
1 1. INTRODUCTION
1.1. Project scope and research plan
The lack of devices suitable for acquiring accurate and reliable measures of patients' physiological signals in a remote and continuous manner together with the advances in data acquisition technologies during the last decades, has led to the emergence of wearable devices for healthcare. Within this field, the use of textile-based sensors is valuable as it enables unobtrusive and comfortable means of meas-urement, while allowing long-term monitoring.
Remote, continuous health monitoring in unattended setting has many advantages: decreases pres-sure on health systems, reduces expenses associated with inpatient care and accelerates the response to emergencies while enabling early detection and prevention of chronic conditions. However, the lack of confidence in the quality of the signal acquired and its clinical relevance, the need to acquire and process large amount of data as well as the need to combine simplicity of use and robustness against artifacts while ensuring acceptable integration in user's daily life, data security and data privacy, are some of the main challenges within this field.
Long-term health monitoring also requires systems with low power consumption and high energy efficiency and, when done by means of wearable sensors, the durability and signal integrity of the sen-sors with time and cleaning process must be ensured. Most of the proposed systems consider only a specific physiological signal or parameter. However, the use of several wearable devices to monitor different physiological parameters is neither practical nor ergonomically sound; therefore, developing multi-sensor monitoring systems is desirable.
With that knowledge in mind, the Swiss Federal Laboratories for Material Science and Technology (Empa) aim to develop a wearable monitoring system that enables continuous and non-invasive moni-toring of multiple vital parameters, fulfilling accuracy requirements to be used in clinical settings. At this point, the system consists of a textile belt with integrated sensors combining own technologies, such as embroidered electrodes with Silver/Titanium coating for ECG monitoring [1] and optical fibre-based sensor for respiratory monitoring [2], with commercially available sensors, giving rise to the concept of "lab on the belt".
The parameters of interest are respiratory rate; electrocardiogram (ECG) and RR-intervals based on the former; body posture, physical activity, movement patterns and energy expenditure; and, lastly, blood oxygen saturation (SpO2), since all these parameters can be measured from the skin surface.
Respiratory rate, also called breathing rate, is one of the four classic vital signs, crucial to determine subjects' health status. It is used in the diagnosis of sepsis/ septic shock, sleep related breathing disorders, such as sleep apnea, and many other conditions. Likewise, ECG is essential in the diagnosis of cardio-vascular diseases, the main cause of death globally according to the World Health Organization (WHO). Additionally, continuous ECG monitoring is used in intensive care unit (ICU) to monitor critically ill patients. Thus, due to their clinical relevance, these two parameters will be our focus of research.
Furthermore, body posture and physical activity is taken into account, since it has been shown its suitability not only for fall detection in elderly care, but also for assistance of patients suffering from neurodegenerative disorders, motor diseases and cancer.
Within this framework, this master thesis project intended to answer the following questions: 1) How accurate is the ECG data recorded without supervision in home setting?
2) Is it possible to accurately and continuously monitor breathing through the integration of optical fibre into the belt?
a. If yes, is it possible to measure respiratory rate? b. And tidal volume?
2
3) Is it possible to accurately recognize lying positions/ body postures/ activities/ activity patterns from accelerometry data?
1.2. State of the art
Devices currently used in clinical practice for the assessment of patients’ health status enable accu-rate measurement of physiological parameters, yet they are not suitable for continuous ambulatory mon-itoring. Even though continuous monitoring of vital signs, such as ECG and breathing rate, is applied to patients in ICUs, the vital signs of patients that are not in a critical condition are measured intermittently. However, patients’ health status may degrade in the time between measurements. Standard medical de-vices used for diagnosis provide a “snapshot in time”[3] of patients’ health status. Nevertheless, relevant events may not occur during the examination, as might be the case in patients suffering from rare occur-ring arrhythmias [4]; and the presence of a healthcare professional may induce changes in patients vital signs, as happens in white coat effect (i.e. increase in blood pressure associated with clinical visit [5]). Therefore, there is a need for medical devices enabling long-term, remote and continuous monitoring.
The suitability of wearable devices for remote, continuous and long-term monitoring of physiolog-ical parameters makes of such a technology the focus of study of many researchers, especially nowadays. Over the past decades, it has been observed a gradual increase in life expectancy worldwide simultane-ously with declining birth rates. This phenomenon results in population aging, which requires a consid-erable economic investment in order to provide the assistance needed to elderly, especially concerning healthcare [6].
Wearable devices are any device a subject can “wear without encumbering daily activities or re-stricting mobility” [3]. Sensors have been integrated in clothes (T-shirts, bras, socks, pants), watches, chest straps, elastic bands, patches, tags, glasses etc., ensuring continuous monitoring with the maximum wear comfort and minimum interference in subjects’ daily activities [3]. There is a wide range of appli-cation fields of wearable devices [3], [6]–[9]:
▪ Healthcare: monitoring for disease prediction, anomaly detection, recovery, rehabilitation, diagnosis support;
▪ Assistive living;
▪ Surveillance and security: monitoring of subjects in risky situations (e.g. solders, firefight-ers or astronauts);
▪ Fitness/Sport: monitoring of physical and physiological parameters to improve performance or increase wellness;
▪ Human computer interaction and robotics.
To be used in healthcare, wearable devices must satisfy various medical and ergonomic require-ments. They must be of small dimension, comfortable, its components should be flexible, chemically inert, nontoxic, and hypoallergenic to the human body. For the successful commercialization, it should also be low-cost, lightweight, user-friendly, unobtrusive (should not require the user to wear many sen-sors), non-invasive and, additionally, the whole system should not require user interaction too often [6], [8], [9].
Depending on their application, wearable devices can be used to monitor healthy subjects and pa-tients, in home or clinical environment. Data can be stored locally on the wearable device (in the data-logger unit) or be transmitted, via Bluetooth, Wi-Fi, ZigBee or long range radio, to receiving devices where it is displayed in real-time, or even to a remote monitoring center. While offline monitoring is adequate for disease prediction and diagnose support, it is not appropriate for activity monitoring or
3
anomaly detection (e.g. fall, seizure, or cardiac arrest detection), as both require real-time feedback (e.g. alarms) to medical staff and wearer [3], [10].
The monitored bio signals and physiological parameters include ECG, heart rate (HR), electroen-cephalogram, electromyogram, gait patterns, minute ventilation, breathing rate, breathing pattern, air quality, physical activity, arterial oxygen saturation, blood pressure, blood glucose, skin perspiration, galvanic skin response, capnography and body temperature [3], [6], [10], [11]. The sensor most widely used in wearable devices is the accelerometer [11].
A huge number of wearable devices are available on the market; however, the reliability, accuracy, safety and efficacy of the vast majority has not been proved. In fact, only an extremely reduced fraction of existing wearable devices are CE (Conformité Européenne) or FDA (Food and Drug Administration) approved [3]. CE [12] and FDA [13] definitions of medical devices clearly include wearable devices for healthcare applications. Thus, most commercially available wearable devices cannot be commercialized as medical devices, as they do not have a mark of conformity.
Wearable devices market has been constantly growing, being estimated that its total worth is over $50 billion this year [14]. Wearables for lifestyle, fitness and sport applications are predominant in this market. The market of wearable devices for healthcare applications is also growing, however, the lack of confidence in the quality of the acquired signal on the part of clinicians as well as the requirements in terms of device certification have been hindering its growth [10], [11].
A summary on the standard devices as well wearable devices used for ECG, breathing and physical activity monitoring is presented in the following sections.
1.2.1. ECG monitoring
The surface ECG is a continuous record of voltage changes, generated as a response of cardiac muscles to electrical impulses generated by pacemaker cells [15]. In this way, the ECG reflects the cyclic electro-physiologic events in the myocardium, revealing the condition of heart’s electrical func-tion [16]. It has a preponderant role in detecfunc-tion of heart defects and cardiac diseases such as auricular or ventricular hypertrophy, myocardial infarction (heart attack), arrhythmias and pericarditis. It also allows the analysis of heart rate variability (HRV), a straightforward way to study the autonomic nervous system activity. ECG signals are acquired by means of electrodes.
Today’s gold standard for ECG recording are the gel electrodes. However, these electrodes have a limited application period, i.e. one or maximum two days, since they tend to run dry as the moisture content evaporates, and cause skin irritations on long-term use, apart from being uncomfortable for users [1], [17].
Generally, biopotential electrodes can be categorized in three groups: wet, dry and non-contact elec-trodes. Wet electrodes are the most common type, being the gold standard for clinical applications. Gel electrodes belong to this class. They consist of a metal (e.g. silver or gold) surrounded by a wet or solid hydrogel that is coupled to the skin (galvanic coupling). Dry electrodes operate without the use of an explicit moisturizing substance. Instead, the metal in the electrode directly contacts the skin using only some degree of moisture coming from the environment or emitted from the body (e.g. sweat). Their performance usually increases over time with increasing moisture between the electrode and the skin, as it reduces the electrode-skin impedance. There are also dry contact electrodes with capacitive cou-pling, in which a thin dielectric layer is used to form an insulated contact with the body. Such electrodes measure electric surface potentials on the skin by the principle of electrostatic induction. The non-con-tact electrodes are a particular case of dry electrodes. They function without being in direct connon-con-tact with skin. Non-contact electrodes enable data acquisition through an insulation layer such as clothing [17]. Although dry electrodes enable long-term ECG monitoring, to be used for clinical purposes their per-formance must match that of gel electrodes.
4
Textile electrodes, made from textile fibers with conductive properties, have also been used as an alternative to gel electrodes. They are flexible, adjusting easily to body topography, and can be unob-trusively integrated into a garment. Additionally, air and moisture can pass through the porous textile electrodes, decreasing the risk for skin inflammation and increasing users’ comfort. However, data ac-quired by textile electrodes is more susceptible to motion artefacts as electrodes can easily move relative to the skin. Ensuring electrodes integrity and durability as well as cope with the electric performance variation of such electrodes are among the greatest challenges in the field of textile electrodes for ECG monitoring [18].
The most popular device for long-term, ambulatory monitoring of ECG is the HolterTM ECG Re-corder. It is a 12-lead wearable device that allows remote and continuous ECG monitoring up to 3 days [11], [19]. However, Holter monitors use conventional gel electrodes. Efforts have been made to develop wearable systems using different types of electrodes and with fewer leads, thus increasing comfort and unobtrusiveness, while increasing the monitoring time. Several wearable systems for long-term ECG monitoring, mainly chest straps, t-shirts and adhesive patches [10], have been proposed.
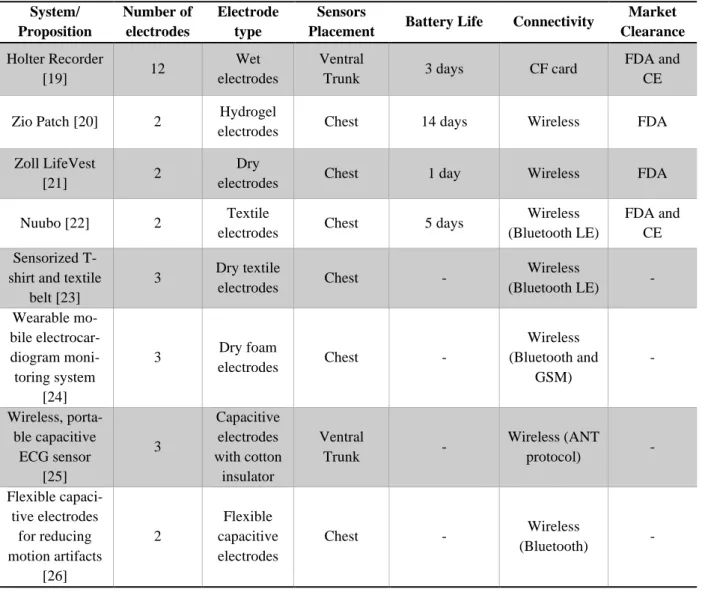
Table 1.1 presents some of the existing wearable devices for ECG monitoring. From the systems presented, the first four are commercially available, while the other four were proposed in literature. Zio, developed by iRhythm, is a patch able to monitor ECG for up to two weeks. Nuubo is a chest strap with integrated textile electrodes for long-term ECG-monitoring. Both are currently in use for clinical applications. Zoll LifeVest is a wearable cardioverter defibrillator that monitors ECG. It has been used to monitor patients at risk of sudden cardiac death.
5
Table 1.1. Wearable devices for remote, continuous and long-term ECG monitoring. CF: compact flash; LE: low energy; GMS: Global System for Mobile communications; ANT: Adaptive Network Topology.
System/ Proposition Number of electrodes Electrode type Sensors
Placement Battery Life Connectivity
Market Clearance Holter Recorder [19] 12 Wet electrodes Ventral
Trunk 3 days CF card
FDA and CE
Zio Patch [20] 2 Hydrogel
electrodes Chest 14 days Wireless FDA
Zoll LifeVest
[21] 2
Dry
electrodes Chest 1 day Wireless FDA
Nuubo [22] 2 Textile
electrodes Chest 5 days
Wireless (Bluetooth LE)
FDA and CE Sensorized
T-shirt and textile belt [23] 3 Dry textile electrodes Chest - Wireless (Bluetooth LE) - Wearable mo-bile electrocar-diogram moni-toring system [24] 3 Dry foam electrodes Chest - Wireless (Bluetooth and GSM) - Wireless, porta-ble capacitive ECG sensor [25] 3 Capacitive electrodes with cotton insulator Ventral Trunk - Wireless (ANT protocol) - Flexible capaci-tive electrodes for reducing motion artifacts [26] 2 Flexible capacitive electrodes Chest - Wireless (Bluetooth) -
1.2.1.1. Textile Belt for Long-Term ECG monitoring
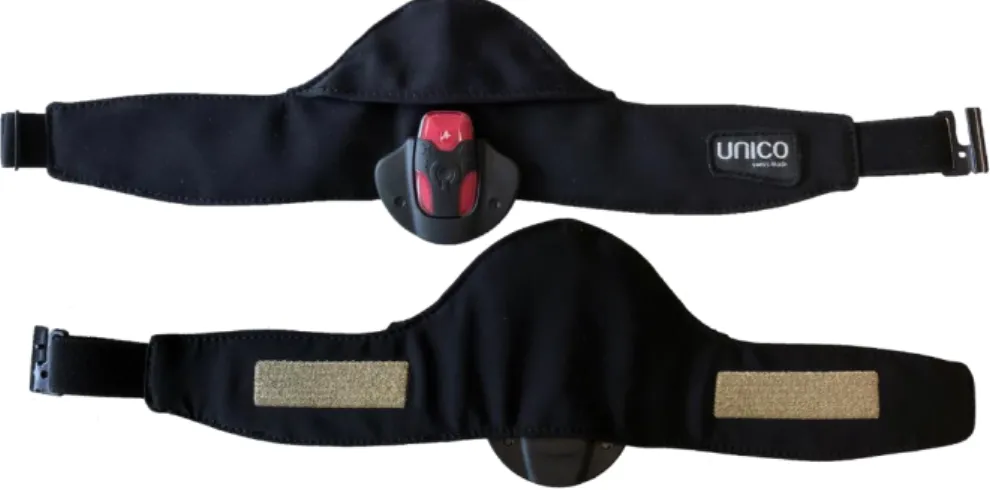
Empa developed a system for long-term ECG measurements. It consists of a textile belt (Unico Swiss Tex GmbH, Alpnachstad, Switzerland) with two embroidered textile electrodes from polyeth-ylene terephthalate yarn, which are plasma coated with silver and with an ultra-thin titanium layer on top. The belt has stretchable parts and trims to ensure good electrode-skin contact for different body sizes, as shown in Figure 1.1.
Since it was proved that humidification improves the signal quality in motion, electrodes are mois-turized with a very low amount of water vapor from an integrated reservoir [1]. The integrated reservoir is composed of a wetting pad made from polyester that is impermeable to liquid water but allows the passage of water vapor. The wetting pad is connected to a flexible water tank and releases a small amount of water that evaporates mainly due to body heat of the wearer. The water vapor permeates the mem-branes of the wetting pad thus creating a favorable silver-titanium-water electrode chemistry due to a high relative humidity atmosphere. This atmosphere prevents artifacts that results from the friction be-tween electrode and skin, allowing the acquisition of good quality signal with baseline stability even when there are large body motions during the measurement. The water reservoir allows continuous ECG recording over 5-10 days without a refill.
6
Figure 1.1. Textile belt connected to data logger (red device). Front (top) and back (bottom) view.
Electrodes measures are stored in a data logger. The validity, reliability and clinical relevance of this system are being tested by means of experiments with volunteers and clinical trials [27], [28].
1.2.2. Respiratory Monitoring
At present, respiratory rate monitoring is done in a continuous manner only in ICUs. On general hospital wards, nurses measure it intermittently only. They do it manually, counting the number of breaths, based on patient's chest movement, during a minute. Apart of being a time-consuming task, it is hard to apply this methodology to non-cooperative patients. Consequently, breathing rate is the most neglected vital sign and its value is sometimes simply estimated or even guessed [29], [30].
Respiratory rate is an early indicator of patient's health status deterioration since the compensatory mechanisms normally first increase heart and respiratory rates. It is valuable to recognize acute changes in patients' condition, especially when measured in a continuous manner, as patient's health status can drastically change in the gaps between measurements when an intermittent methodology is followed. Respiratory rate increases in hypovolemia and increased respiratory rate can be an early marker of aci-dosis. Additionally, abnormal respiratory rate is common prior to cardiac arrest [29]. Measuring tidal volume is also important when it comes to respiratory monitoring. Tidal volume is the volume of air that is inhaled and exhaled with each breath. Abnormalities in its value are related with asthma, pneu-monia and chronic obstructive pulmonary disease.
Respiratory rate and tidal volume are calculated from the respiratory signal acquired through differ-ent techniques. The clinical standard techniques for respiratory monitoring include capnography, spi-rometry, impedance pneumography, and respiratory inductive plethysmography (RIP). Capnography, also called end-tidal CO2 monitoring, is the standard for respiratory monitoring in ICUs and in the op-erating room. It is the measurement of CO2 concentration in exhaled air over time [31]. Spirometry is the gold standard for tidal volume measurement [32]. Even though it is an accurate method, it is also invasive. During spirometry, the patient must breathe through a tube while wearing a nose clip or a face mask. Thus, such device is not suitable for continuous monitoring. It is uncomfortable and alters pa-tient’s natural breathing behaviors.
Impedance pneumography consists in measuring changes in transthoracic impedance as a function of respired volume using superficial thoracic electrodes [33], [34]. Pairs of electrodes (usually one or two [35]), one injecting current and other measuring voltage changes, are placed on the subject’s thorax to measure its impedance. Research has been conducted to find the optimal electrodes configuration, increasing accuracy and reducing obtrusiveness [36]. It is the clinical standard for electronic breathing
7
rate measurement [37]. It has been used during overnight polysomnography (PSG), the gold standard for the diagnosis of sleep related disorders [38], to monitor respiratory effort.
RIP enables non-invasive respiratory monitoring by measuring the movement of the chest and ab-dominal wall. Two inductance sensors (coils) integrated into elastic bands, one placed at the level of nipples and other at the level of umbilicus, are deployed to monitor respiratory movements. Respiratory movements cause changes on the surface encircled by the sensors, altering the current induced by mag-netic field in the coils [39], [40]. Output signal must be calibrated to measure volume. RIP devices are standard in clinical environment. Due to their portability, ambulatory RIP has been proposed [39][41], however body posture changes invalidate calibration. Thus, for volume measurement, recalibration is required each time subjects’ body position changes. Brüllmann et al.[40] proposed an accelerometry-based approach to solve the recalibration problem. Another study suggest that ambulatory RIP is a reli-able method for respiratory monitoring [42].
A review on the existing contact methods for measuring respiratory rate is presented in by Massaroni et al. [35]. They categorized the sensing principles for respiratory monitoring in seven groups:
1) Respiratory airflow: measurement of the volume or velocity of inhaled and exhaled air using flowmeters. This method enables accurate breathing rate estimation but is intrusive, as usu-ally implies use of face mask.
2) Respiratory sounds: recording of respiratory sounds using microphones. This approach en-ables monitoring with reduced encumbrance, being suitable to be applied in wearable de-vices. However, its use is not recommended as microphones can easily record sounds that are not related to breathing.
3) Air temperature: measurement of the difference between the temperature of inhaled and exhaled air, as inhaled air is at ambient temperature, while exhaled air is warmer. Thermis-tors, thermocouples, pyroelectric sensors and optical fibres have been used for this purpose. This approach is sensitive to environmental factors, intrusive and not suitable for ambula-tory monitoring.
4) Air humidity: measurements of the water vapor content of inhaled and exhaled air, as ex-haled air has higher humidity. Capacitive and resistive sensors are often used for humidity measurements. Optical fibres have also been employed. Although this approach is robust against motion artefacts, it is invasive and may require the use of a face mask. Air humidity sensors have been used in ICUs.
5) Air components: measurement of level of carbon dioxide in inhaled (0.04%) and exhaled (6%) air, termed capnography, using infrared sensors and fiber optic sensors. It is an accu-rate technique but also intrusive due to the high number of cables and connections. Capno-graphy enables continuous monitoring of respiratory, however usually requires use of face mask. This is the approach commonly used in ICUs.
6) Chest wall movements: respiratory monitoring based on the recording of respiratory mus-cles movement. Strain sensors (i.e. resistive, capacitive, inductive and fiber optic sensors) have been used for detection of chest wall movements. Additionally, transthoracic imped-ance sensors and movement sensors (i.e. accelerometers, gyroscopes and magnetometers) have also been deployed. Those sensors enable continuous recording of respiratory wave-forms, being easily integrated into clothes and garments. This technique is unobtrusive, however, sensitive to motion artefacts.
7) Modulation cardiac activity: extraction of respiratory signal from ECG or photoplethys-mography (PPG), based on the respiratory modulation of cardiac signals. The main ad-vantage of this approach is that ECG and PPG sensors are already in use in clinical and home settings. This method is unobtrusive, but sensitive to motion artefacts.
8
Respiratory monitoring through non-contact methods have also been proposed [32], [43].
As the reader may notice, fiber optic sensors (FOSs) have been widely explored for respiratory monitoring purposes. Due to their good metrological properties, small size, flexibility and immunity from electromagnetic field, they are suitable to monitor patients remote and continuously, even in mag-netic resonance imaging (MRI) environments, where standard electronic sensors cannot be deployed [44].
In FOSs, the optical fibre can be the sensing element (intrinsic sensors) or it can simply be used as a medium to transport light (extrinsic). There are two main types of FOSs employed in smart textiles for health monitoring: Fiber Bragg grating (FBG) technology based and intensity-based sensors [44]. Fun-damentally, FBG sensors are a short segment of fiber optic, with usually 3 mm to 6 mm, which reflects a narrow range of wavelengths of the input light and transmits all the others due to exposure of the fibre core to an intense optical interference pattern. The wavelength range in which light is reflected is sensi-tive to temperature and strain. Thus, those sensors enable temperature and strain estimation. They have been used to monitor stroke volume, blood pressure, heartbeats as well as respiration. Similar to FBG, long period granting (LPG) sensors enable measurement of several parameters. LPG “consists of a pe-riodic change in the refractive index profile along the fiber” [45]. Characteristics of the attenuation bands enable the measurement of strain, bending, load and temperature.
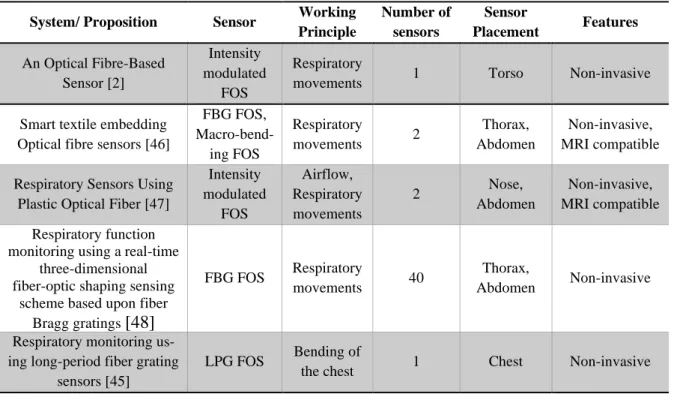
On the other hand, the working principle of intensity-based sensors is that the intensity of the light emitted by one fibre and conveyed into other fibre in close proximity to the first, is an indirect measure of the distance between the two fibres, and consequently of other parameters that influence this distance. A subtype of these group, macro-bending sensors, are based on the loss of light when the optical fibre is bent. Different bent radius result in different intensity modulations of the light transmitted by the fiber. Intensity-based sensors are used to monitor pressure and temperature. They have been proposed to meas-ure intravascular and intracranial pressmeas-ure. Macro-bending FOSs are mainly applied in respiratory movement monitoring. Table 1.2 presents some examples of sensors for respiratory monitoring based on optical fibres. Other approaches are presented in [44].
The sensor proposed by Krehel et al. [2] was developed by Empa researchers. They developed an optical fibre-based sensor that measures force or pressure applied to the sensor based on the light loss induced by changes in wave guiding properties due to changes in fibre’s geometry [44].
9
Table 1.2. Optical fibre-based sensors for respiratory monitoring. MRI: magnetic resonance imaging.
System/ Proposition Sensor Working Principle Number of sensors Sensor Placement Features An Optical Fibre-Based Sensor [2] Intensity modulated FOS Respiratory
movements 1 Torso Non-invasive
Smart textile embedding Optical fibre sensors [46]
FBG FOS, Macro-bend-ing FOS Respiratory movements 2 Thorax, Abdomen Non-invasive, MRI compatible Respiratory Sensors Using
Plastic Optical Fiber [47]
Intensity modulated FOS Airflow, Respiratory movements 2 Nose, Abdomen Non-invasive, MRI compatible Respiratory function
monitoring using a real-time three-dimensional fiber-optic shaping sensing
scheme based upon fiber Bragg gratings
[48]
FBG FOS Respiratory
movements 40
Thorax,
Abdomen Non-invasive
Respiratory monitoring us-ing long-period fiber gratus-ing
sensors [45]
LPG FOS Bending of
the chest 1 Chest Non-invasive
Several commercially available wearable systems include sensors for respiratory monitoring. Some examples are shown in Table 1.3. The vast majority monitors breathing rate based on respiratory move-ments as this is the working principle more appropriate for data acquisition outside clinical setting [35].
Table 1.3. Wearable devices for remote, continuous and long-term respiratory monitoring. BR: breathing rate; TV: tidal volume, RIP:Respiratory inductive plethysmography; bpm: breaths per minute.
System Wearable Sensor Working Principle
Respiratory Parameters
EquivitalTM EQ02
LifeMonitor [49], [50] Chest strap RIP sensors
Respiratory movements
BR (0 to 70 bpm)
LifeShirt® [51] Elastic garment (Shirt) RIP sensors Respiratory movements BR, TV, minute ventilation ZephyrTM BioHarnessTM [52], [53] Chest strap Capacitive sen-sors Respiratory movements BR (3 to 70 bpm) Hexoskin® [54] Smart garment
(Shirt) Inductive sensors
Respiratory movements
BR, TV, minute ventilation
The Spire [55] Tag Force sensors Respiratory
10
1.2.3. Activity monitoring
In the last decades, the importance of physical activity not only for fitness but also for wellbeing and health has called the attention of health providers and scientists. Several studies show its relevance on the progress and impact of many conditions such as cancer [56], [57], cardiovascular diseases [58], pulmonary diseases, diabetes and obesity, as well as on the outcome of several medical interventions [59], [60].
The standard for physical activity and functional ability assessment in healthcare are questionnaire tools, validated functional tests, observations among other approaches. However, these methods are "ei-ther time consuming and expensive, requiring access to specialized equipment and a dedicated labora-tory set-up, or they are subjective and rely on clinician observation or patient recall"[61]. Furthermore, a short-term assessment does not always reveal the condition of the patient in his/her familiar environ-ment.
Objective measurement of subject's physical activity in home environment is possible through wear-able sensors for activity monitoring. A significant part of the wearwear-able devices for healthcare applica-tions monitor activity. According to Mukhopadhyay [8], the most commonly used activity sensors are accelerometers, HR sensors, temperature sensors, and wearable ECG sensors. Even though gyroscopes, magnetometers, pressure sensors, microphones, and camera- and depth-based systems have also been employed [7]. Among these, accelerometers, due to their simplicity and cost-effectiveness, are the most common.
Continuous monitoring of users acceleration allows [6]–[8], [62]: ▪ Activity recognition;
▪ Classification of activity level; ▪ Fall prediction and detection; ▪ Posture recognition and analysis; ▪ Balance assessment;
▪ Metabolic expenditure estimation; ▪ Gait/walking patterns assessment; ▪ Sleep assessment.
Additionally, accelerometers are often integrated into wearable devices to use their data in algorithms for motion artifacts removal from physiological signals, such as ECG [63].
There are many wearable devices with integrated accelerometers suitable for measurements lasting several days, but there is no standard for activity monitoring in healthcare. Activity monitoring in home environment can be conducted in three modes [61]: clinical assessment, event monitoring and longitu-dinal monitoring.
1) Clinical assessment: Supervised, short-term monitoring. It aims to provide an objective clin-ical examination of the subject's particular movements, in home environment. The acquired infor-mation may be used as a complement to other physical activity and functional ability assessment approaches.
2) Event monitoring: Unsupervised and long-term monitoring; real-time data processing. It aims to accelerate the response to emergencies. Thus, this mode of monitoring requires triggering an alarm each time an abnormal event is detected (e.g. fall or absence of movement).
3) Longitudinal monitoring: Unsupervised, long-term monitoring. It aims to predict or prevent certain conditions. In this mode, parameters that quantitatively measure activity are monitored. Those parameters can be movement specific (for example step rate, postural sway and rise time) or not, which is the case for metabolic energy expenditure, amount of time spent resting and other general parameters of movement. In the first case, it is necessary to recognize the activity before measure the parameter, while in the latter there is no need for activity classification.
11
Wide ranges of physical activity parameters have been monitored [61]. Metabolic energy expendi-ture; physical activity; posexpendi-ture; time in activity, total sleep/awake time; walking cadence (i.e. steps/mi-nute); variability and intensity of activity are some examples. The most common is the metabolic energy expenditure.
Although one of the main purposes of physical activity monitoring is to monitor physical activity, there is no consensus on the acceleration-derived parameters that should be used to this end. The most common parameters are step count [64]–[66] (i.e. number of steps), activity counts [67] (calculated after filtering, rectifying and aggreging acceleration over a time window [68], defined by the activity monitor manufacturer [69]), mean acceleration vector magnitude [70] (i.e. the average length of the acceleration vector) and vector magnitude units [71] (i.e. the vectorial sum of activity counts in three orthogonal directions), all calculated in 1 minute intervals. A study [72] used posture allocation to analyze sedentary behavior and inactivity.
Apart from measuring physical activity, it is important to know its distribution (at which time of day/day of the week?), frequency (how many times?), duration (time in activity) and intensity in order to analyze the activity pattern. Thus, the acquired data must have the necessary time resolution.
Some of the parameters proposed for the assessment of activity pattern based on acceleration are: a) Gini coefficient [65], [72]: very often used for comparing patterns of accumulation (i.e. how
the total value was achieved), this coefficient measures inequality among values; ranges from 0 (complete equality, i.e. all values are the same; e.g. activity bouts contribute equally to the total activity time) to 1 (complete inequality, e.g. total activity time is due to a few long activity bouts);
b) Intensity gradient [73]: measures physical activity distribution; it is the gradient of a sub-ject's log-log linear regression which relates the activity intensity and the time accumulated at that intensity;
c) Physical activity aggregation [64]: measures activity distribution over the monitoring pe-riod, ranges from 0 (low aggregation, i.e. well spread over the monitoring period) to 1 (max-imal temporal aggregation);
d) Coefficient of variation [66] : measures the variability of activity, i.e. the dispersion or spread of physical activity, 𝐶𝑉 = 100 × 𝑠𝑡𝑎𝑛𝑑𝑎𝑟𝑑 𝑑𝑒𝑣𝑖𝑎𝑡𝑖𝑜𝑛/𝑚𝑒𝑎𝑛;
e) Approximate entropy [66]: measures the randomness of activity fluctuations, ranges from 0 (short sequences of data points are perfectly repeatable) to 2 (any repeating sequences of points occur by chance alone);
Since there is no standard method, there is still space for new approaches to quantitatively evaluate activity patterns.
The majority of population-based studies that monitor physical activity for healthcare purposes [65], [67], [70] applied a longitudinal monitoring mode, with measurements lasting several days. The recom-mended duration [71] is at least 7 days to ensure the reliability of the measurement. Wearing an activity monitor can lead subjects to, intentionally or not, increase their activity level. This effect, however, tends to decrease with increasing monitoring time. Moreover, subjects' routine may greatly vary from day to day, but it is more or less constant from week to week.
Determining the "valid" monitoring period is also part of physical activity monitoring. One [64] can define the potential time of activity as the time in which the subject is awake. Thus, only data acquired while the subject was awake is taken into account in the activity pattern assessment. Others [64], [70] may consider that every time the subject can be active and so, all the data acquired while the subject wore the activity monitor is considered in the analysis. In the first case it is necessary a criterion to define sleeping periods and, in the second, a criterion must be set to determine the wearing time.
12
Accelerometer based physical activity monitoring is a very promising approach although it has also some limitations. One of them is that it is not suitable for monitoring activities such as resistance train-ing, swimming or cycling. When the accelerometer is placed in central body location (e.g. waist or chest), information regarding movement of body extremities cannot be acquired. On the other side, soft tissue movement or external vibrations imposed on the body, for example while travelling in a motor vehicle, may add noise to the signal. A joint effort is needed to further explore this topic.
ActiGraph, Axivity and GENEActiv accelerometers are the ones most often used in large global surveys [73]. Several companies, such as Fitbit [74], launched smart watches with integrated accelerom-eters to monitor activity, recognize exercises and assess sleep quality.
1.2.4. Multi-sensor monitoring systems
The use of several wearable devices to monitor different physiological parameters is neither practi-cal nor ergonomipracti-cally sound, thus several multi-sensor systems have been proposed for continuous, long-term and remote health monitoring. However, almost none of those systems is already approved for clinical applications. Thus, they are being used for fitness or wellness purposes, while waiting for FDA and/or CE clearance. The approval of such devices will prompt advances in Telemedicine, begin-ning a new phase in healthcare.
VITALITI [75], develop by Cloud DX, is a wearable vital sign monitor that measures ECG, HR, oxygen saturation, respiration rate, core body temperature, blood pressure, movement, steps and posture. It enables 72 hours of continuous recording and is now undergoing FDA clearance for medical use.
ZephyrTM BioHarnessTM [52], [53]is a multisensory chest strap “intended to monitor adults in the home, workplace and alternative care settings” [76]. The system monitors HR, breathing rate, activity level, subject orientation, skin temperature, blood pressure (optional external sensor) and blood oxygen saturation (optional external sensor). It has been used for sports and academics/research purposes as well as to monitor first responders (e.g. firefighters), solders and astronauts. ZephyrTM BioHarnessTM is FDA-approved (510(k)). Its battery lasts 18 to 24 hours.
Hexoskin® [54] is a smart shirt that monitors ECG, breathing rate, tidal volume, minute ventilation and tri-axis acceleration-derived parameters (activity intensity, peak acceleration, steps, cadence posi-tions and best sleep tracker). The system has 12 to more than 30 hours battery life. The battery life was increased to 48 hours with Astroskin, a system developed by the same company to monitor astronauts. Astroskin monitors blood pressure, pulse oximetry, 3-lead ECG, breathing (RIP), skin temperature, and tri-axis acceleration (activity). Both systems have been used for academic and research purposes, first responders monitoring, defense, industrial, space and aerospace applications.
Another example is EquivitalTM EQ02+ LifeMonitor [50], a device “intended for monitoring of adults (16-65 years) in hospital care facilities, the home, workplace, and alternate care settings” [76]. It is a wearable system that monitors ECG, HR, interbeat interval, respiratory rate, skin and core temper-ature, galvanic skin response, oxygen saturation, PPG, and activity/body position through a tri-axis ac-celerometer. The system has two components, the sensor electronics module and the sensor chest belt. It has FDA 510(k) clearance and is CE marked. This system was designed to provide "real-time mobile human data to keep healthy people healthy” [50]. It enables up to 48 hours of recording without recharge the battery and has been used to monitor people in extreme environments, i.e., soldiers, firefighters, athletes, miners etc.
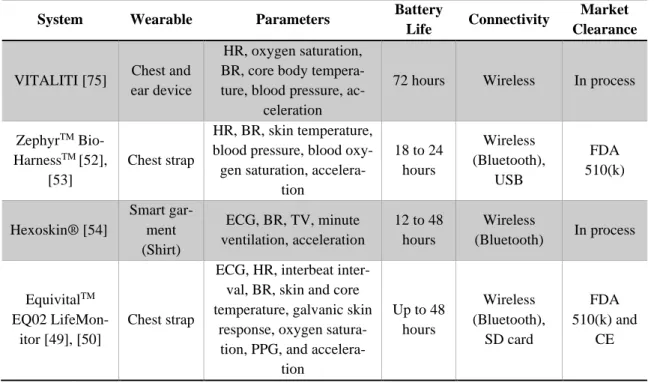
A summary of those four systems characteristics is presented in Table 1.4. Many more wearable systems have been proposed in the literature. Even though they are not yet applied for clinical applica-tions, they already show the great potential of wearable technology in remote, continuous and long-term monitoring of physiological signs.
13
Table 1.4. Multi-sensor wearable devices for remote, continuous and long-term monitoring. HR: heart rate; BR: breathing rate; TV: tidal volume.
System Wearable Parameters Battery
Life Connectivity
Market Clearance
VITALITI [75] Chest and ear device
HR, oxygen saturation, BR, core body tempera-ture, blood pressure,
ac-celeration
72 hours Wireless In process
ZephyrTM Bio-HarnessTM [52],
[53]
Chest strap
HR, BR, skin temperature, blood pressure, blood
oxy-gen saturation, accelera-tion 18 to 24 hours Wireless (Bluetooth), USB FDA 510(k) Hexoskin® [54] Smart gar-ment (Shirt) ECG, BR, TV, minute ventilation, acceleration 12 to 48 hours Wireless (Bluetooth) In process EquivitalTM EQ02 LifeMon-itor [49], [50] Chest strap
ECG, HR, interbeat inter-val, BR, skin and core temperature, galvanic skin
response, oxygen satura-tion, PPG, and
accelera-tion Up to 48 hours Wireless (Bluetooth), SD card FDA 510(k) and CE
This work aimed to assess the validity of the textile belt for electrocardiogram monitoring in a home setting and to supplement the existing system with sensors for respiratory monitoring. Another objective was to evaluate the suitability of the same wearable, as a multi-sensor system, for activity monitoring. The thesis is organized as follows: in Chapter 2 we assess the validity of Empa’s textile belt for ECG monitoring in a home setting through a study involving patients with suspected sleep apnoea; the inte-gration of optical fibre-based sensors into the textile belt for respiratory monitoring is discussed in Chap-ter 3 and, in Chapter 4, the proof of concept of an algorithm for activity monitoring using the data recorded by the textile belt (i.e. breathing rate, HR and tri-axis acceleration), as a multi-sensor system, is provided. Accelerometry-based body posture recognition is also discussed in the Chapter 4. A study was conducted to assess the validity of the textile belt for respiratory and activity monitoring. It is de-scribed in Chapter 5. Finally, the general conclusion and future prospects of the project are presented in
14 2. ECG MONITORING
The surface ECG is a continuous record of electrical signals, generated as a response of cardiac muscles to electrical impulses generated by pacemaker cells [15]. In this way, the ECG reflects the cyclic electro-physiologic events in the myocardium, revealing the condition of heart’s electrical func-tion [16]. It has a critical role in detecfunc-tion of heart defects and cardiac diseases such as auricular or ventricular hypertrophy, myocardial infarction (heart attack), arrhythmias and pericarditis. ECG has also been used for emotion recognition and biometric identification [77], [78]. Figure 2.1 shows a typical ECG signal of a healthy subject.
Figure 2.1. Example of ECG wave of a healthy subject. Image adapted from [79].
The ECG is characterized by its waves, segments and intervals [15]. The P wave corresponds to the atrial myocardium depolarization, the QRS complex (composed by Q, R and S waves) to the ventricular myocardium depolarization, the T wave to the ventricular myocardium repolarization and the U wave, unseen under normal conditions, in thought to be related with endocardial structures repolarization or ventricular myocardium depolarization [15], [80].
One of the most relevant ECG features is the RR-interval, the time between consecutive R peaks. It is also called heart beat interval [81]. The analysis of HRV, i.e. the fluctuations in RR-intervals, is a straightforward way to study the autonomic nervous system activity. Disease induced changes on HRV have been used for the diagnosis of several diseases, among them is sleep apnoea [82], [83].
Sleep apnoea syndrome is a disorder characterized by repetitive cessation of respiratory airflow during sleep. An apnea (Greek word which means “without breath” [84]) episode is the cessation of breathing for at least 10 seconds [85]. Apneas are classified as central or obstructive based on the ab-sence or preab-sence of respiratory effort (abdominal and chest wall movement), respectively. Mixed ap-neas are periods of absent airflow that are initially associated with an absence of respiratory effort and that persist upon resumption of respiratory effort indicating upper airway obstruction [86]. Conse-quently, sleep apnea is classified as central, obstructive or mixed according to the type of detected ap-neas. In central sleep apnea the brain fails to send the appropriate signal to the breathing muscles, re-sulting in cessation of the airflow. Obstructive sleep apnoea, in turn, is the obstruction of the upper airway due to pharyngeal collapse. It is more likely to occur when a supine posture is present since in this position gravitational effects are exerted on the tongue base and soft palate [87]. Partial occlusion of the upper airway is termed hypopnea. Apneas and hypopneas usually last 10 to 50 seconds, although hypopneas lasting several minutes may occur in rapid eye movement sleep [86].
Sleep apnoea syndrome severity is measured by the apnea-hypopnea index (AHI), which is the number of apneas and hypopneas per hour of sleep [4]. The gold standard for sleep apnea diagnosis is overnight PSG in a sleep laboratory. PSG incorporates recording of electroencephalogram,
electro-15
oculogram, chin electromyogram, snoring (microphone), oronasal airflow (thermistor), ECG, pulse ox-imetry and tibialis anterior electromyogram [82]. Due to the high cost of PSG and its obtrusiveness, alternative tools for sleep apnoea diagnosis have been explored. Approaches using oxygen saturation [88], snoring [89] and HRV analysis have been proposed [90].
In this context, the applicability of Empa’s textile belt for overnight ECG monitoring was analyzed. A clinical study involving 242 patients with suspected sleep apnoea was carried out. Patients wore the textile belt while undergoing overnight PSG. RR-intervals derived from ECG signal recorded by the textile belt and the gel electrodes were compared. Results revealed that the belt enables RR-intervals measurement with high validity [28].
In this project, we would like to go a step further and explore the applicability of the same textile belt for ECG monitoring in home setting. No reference device was used in this study. Thus, a method to assess the quality of the acquired ECG signal, and consequently the validity of the textile belt for ECG monitoring in unattended setting, was developed. Existing approaches for ECG signal quality assess-ment (SQA) are described below, as well as, the method we propose.
2.1. Quality assessment of ECG signal
The frequency range of diagnostic ECG signal is 0.05 to 100 Hz [91]. Generally, when the ECG recording is clean and the heart is in sinus rhythm (i.e. electrical impulse generated by the sinoatrial node [92]), QRS complex frequency ranges between 4 and 20 Hz, and P and T waves between 0.5 and 10 Hz. Most ECG power is contained below 30 Hz [80].
Real-world ECG signals are often corrupted by various noises. Seven types of noise mainly affect ECG signals [80], [81], [93]:
a) Power line interference: noise caused by “differences in electrodes impedance and to stray currents through the patient and the cables” [94]. The noise has a frequency of 50 or 60 Hz, and an amplitude equivalent to 50% of the peak-to-peak signal amplitude. Power line noise can be modeled as sinusoids or combination of sinusoids.
b) Electrode contact noise: the loss of contact between the electrode and the skin results in abrupt baseline shifts which decays exponentially to the baseline value and has a super-imposed component of 60 Hz. The noise can be permanent or intermittent and its am-plitude equals the maximum recorded value.
c) Motion artefacts: changes in electrode-skin impedance caused by subject’s movement result in transient baseline changes with a shape similar to one cycle of a sine wave. The baseline disturbance is of 500% of the peak-to-peak signal amplitude.
d) Muscle contraction or electromyography noise: results from the contraction of non-car-diac muscles. It can be assumed to be transient bursts of zero-mean band-limited Gauss-ian noise, with a standard deviation of around 10% of the peak-to-peak signal amplitude. It has a wide frequency range (DC to 10 kHz).
e) Baseline wander: baseline drift due to respiratory amplitude modulation. It can be rep-resented as a low frequency sinusoidal wave (or combination of sinusoidal waves), of frequency between 0.15 and 0.3 Hz, and amplitude of 15% of the peak-to-peak signal amplitude. Sometimes baseline wander coincides with P and T waves frequencies. f) Instrumentation noise: noise arising from electronic equipment used for data acquisition
and signal processing.
g) Electrosurgical noise: noise of amplitude equivalent to 200% of peak-to-peak signal amplitude and frequency between 100 kHz and 1 MHz. It is produced by other medical apparatus used in parallel to ECG recordings.
16
Among them, power line interference and baseline wander are the most common. Although, when it comes to wearable devices, motion artefacts are predominant.
Different approaches have been proposed to assess the quality of ECG signals. In the second chapter of a recently published book [91], Orphanidou gives an overview of the existing methods for automatic assessment of ECG signal quality, especially of data recorded by wearable devices. Depending on the device application, basic quality or diagnostic quality is required. In basic quality ECG signals, R peaks are clearly identifiable; the signal enables reliable calculation of HR as well as extraction of HRV infor-mation. In ECG signals of diagnostic quality, QRS complex, P, if present, and T waves are clearly identifiable; the signal can be used for clinical diagnosis.
In summary, single- and multi-channel SQA approaches have been proposed. Some algorithms are based on time domain, while others on frequency domain features obtained from the ECG signal. The first step of SQA algorithms is beat detection. Then, feasibility checks are applied to differentiate be-tween acceptable (i.e. high quality) and unacceptable (i.e. low quality) signal segments. Flat line detec-tion, amplitude limits and variability, baseline wander, noise power measures and physiological feasi-bility have been used for SQA.
Flat signal segments are a sign of a missing lead as ECG signal is never constant. Therefore, the detection of zero or constant difference between consecutive points during a predefined time has been used for flat line recognition [95]. As mentioned before, several noises (e.g. motion artefacts, power line interference and electrode contact noise) affect signal baseline, resulting in a wide amplitude range. Thus, amplitude limits are an indicator of signal quality. Thresholds for minimum and maximum am-plitude are set and, depending on the percentage of the signal outside the acceptable range, a signal segment is classified as acceptable or not [96]. Baseline wander (BLW) can be identified using a low-pass filter. A signal segment is classified as unacceptable if the BLW exceeds an empirically set thresh-old [97].
Noise-power measures rely on the assumption that the noise is gaussian and the signal stationary, which is not always true. Therefore, it is recommended to complement noise-power measures with other techniques that can cope with noises that do not meet these criteria. Root mean square power in the isoelectric region (i.e. region between the P wave and the QRS complex, thought to be a marker for 0 V), the ratio between in-band and out-of-band spectral power and the power in the residual after a fil-tering process, are some of the proposed noise-power measures [98], [99].
Lastly, signal classification using physiological feasibility relies on the well-defined range and var-iability of RR-intervals. The average HR (should be between 40 and 180 beats per minute), the maxi-mum RR-interval (usually set to 1500 ms), the ratio between the maximaxi-mum and the minimaxi-mum RR-inter-vals (e.g. should not exceed 1.1 in a signal segment of 10 second as change in HR over 10% is improb-able in such a short time period) have been used to reject signal segments with data that is not physio-logically viable [100]. Care should be taken, however, when using physiological feasibility for SQA as it is not possible to differentiate between signal variability arising from noise and from cardiac abnor-malities, such as ectopic beats (i.e. abnormal beats that are due to unusual impulses [101], they add variability to the RR-intervals).
Given that the heart follows a regular rhythm and that noise can deform ECG wave morphology, trend-based methods have been used to search for regularity in signal segments. It is assumed that the more regular an ECG segment, the higher its quality and, consequently, the more reliable is the infor-mation extracted from it. Skewness and kurtosis, which measure the symmetry and shape of a distribu-tion, have been used to assess the regularity of ECG signal segments [102], [103]. The variability in RR-intervals, indicated for example by their standard deviation [104], and the correlation between each individual QRS complex and the reference QRS complex of the segment (often taken as the average of all QRS complexes detected in the segment), termed template matching [100], have also been used as signal quality indices.
![Figure 2.1. Example of ECG wave of a healthy subject. Image adapted from [79].](https://thumb-eu.123doks.com/thumbv2/123dok_br/18556428.906347/24.892.239.675.291.528/figure-example-ecg-wave-healthy-subject-image-adapted.webp)