Analysing
hydrological
services provided
by forests to
support spatial
planning and land
management
Cláudia Maria Carvalho dos Santos
Tese de Doutoramento apresentada à
Faculdade de Ciências da Universidade do Porto Biodiversidade, Genética e Evolução
2014
A n a ly s in g h y d ro lo g ic a l s e rv ic e s p ro v id e d b y fo re s ts to s u p p o rt s p a ti a l p la n n in g a n d la n d m a n a g e m e n t C lá u d ia Ma ri a C a rv a lh o d o s Sa n to sPh
D
FCUP 2014 3.º CICLOD
D
D
Analysing
hydrological
services provided
by forests to
support spatial
planning and land
management
Cláudia Maria Carvalho dos Santos
Doctoral Program in Biodiversity, Genetics and Evolution (BIODIV)
Department of Biology 2014
Supervisor
João José Pradinho Honrado
Professor Auxiliar, Faculty of Sciences, University of Porto Portugal
3
ANALYSING HYDROLOGICAL SERVICES PROVIDED BY FORESTS
Água a correr na fonte,
Uma quimera líquida que sai
Das entranhas do monte
A saber ao mistério que lá vai
…
Pura,
Branca, inodora e fria,
Cai numa pedra dura
E desfaz o mistério em melodia
…
5
ANALYSING HYDROLOGICAL SERVICES PROVIDED BY FORESTS
Foreword
According to the number 7 of Article 6 from the Regulation of the Doctoral Program in Biodiversity, Genetics and Evolution (BIODIV), Faculdade de Ciências da Universidade do Porto (and in agreement with the Portuguese Law Decree nº 74/2006), this thesis integrates the articles listed below, written in collaboration with co-authors. The candidate hereby declares that she contributed to conceiving the ideas, compiling and producing the databases and analysing the data, and also declares that she led the writing of all Chapters.
List of papers:
Chapter 2 - Carvalho-Santos C., Hein L., Honrado J. (2014) Hydrological services and the role of forests: Conceptualization and indicator-based analysis with an illustration at a regional scale. Ecological Complexity. 20: 69-80. DOI: 10.1016/j.ecocom.2014.09.001
Chapter 3 - Carvalho-Santos C., Marcos B., Espinha Marques J., Alcaraz-Segura D., Hein L., Pradinho Honrado H. (2013) Evaluation of hydrological ecosystem services through remote sensing. In Alcaraz Segura D, Di Bella C M; Straschnoy J V (eds), Earth Observation of Ecosystem Services, CRC Press Taylors and Francis group, Boca Raton, pp. 219-249. ISBN 9781466505889.
Chapter 4 - Carvalho-Santos C., Nunes J.P., Monteiro A.T., Hein L, Honrado J. (under review) Simulating the effects of land cover and future climate conditions on the provision of hydrological services in a medium-sized watershed of Portugal.
Chapter 5 - Carvalho-Santos C., Silva A.R., Gonçalves J., Honrado J. (submitted) From hydrological services to a multifunctional watershed: trade-offs and synergies between biodiversity conservation and forest ecosystem services.
3
ANALYSING HYDROLOGICAL SERVICES PROVIDED BY FORESTS
This thesis was supported by the Portuguese Science Foundation (FCT) through the PhD grant SFRH/BD/66260/2009
Este trabalho foi realizado com o apoio da Fundação para a Ciência e Tecnologia (FCT), através da bolsa de doutoramento com a referência: SFRH/BD/66260/2009 (QREN-POPH, tipologia 4.1)
UNIÃO EUROPEIA
Fundo Social Europeu GOVERNO DA REPÚBLICA
PORTUGUESA
5
ANALYSING HYDROLOGICAL SERVICES PROVIDED BY FORESTS
Acknowledgments
Our achievements would never be possible without the collaboration and interaction with the people that surround us. During the last four years and a half, many people took part of this PhD journey, which directly or indirectly contributed to my learning process and supported me in the good and bad moments.
First of all, I’m very grateful to my supervisor, João Honrado, for receiving me in his research group, encouraging me to explore and develop my ideas and supporting me in this PhD adventure.
I would like to thank Lars Hein for the co-supervision of this thesis, especially during the first two years where everything is a vague idea of what we want to develop further.
My sincere gratitude to Rik Leemans for having received me in ESA group, where during 2 years I was offered a desk, a computer, the inclusion in SENSE program, and the access to all facilities in Wageningen, including the opportunity to attend master classes. Many thanks also for the discussions and in particular for the special way of teaching.
A very special thanks to João Pedro Nunes, my current “boss”, to whom I owe all the learning process of SWAT model, and all the motivation to keep going the work in a field that was new and difficult in the beginning. Thanks for the more than 500 emails exchanged and the extensive chats in Skype. Thanks for all the patience, the contagious joy, the share of knowledge, and especially for giving me the opportunity to further continue in research after the PhD. It has been a pleasure working with you in Aveiro.
A big thanks to my work colleagues, both in Portugal (PRECOL-CIBIO) and in The Netherlands (ESA group), for helping in duties and questions about many issues, and for giving me the motivation for continuing with this research.
I started my PhD in ESA group (2010) and I would like to thank to all ESA members for the nice coffee breaks and lunch walks, and especially a big thank to Katalin, Alexander, Anne, Slava, Sander, Matthias and Roy for the “Monday meettings”.
Back to Portugal in 2012, I’m particularly grateful to those who directly have worked with me and are sharing the publications of this thesis. An enormous thank to Antonio Monteiro, for pushing me up when I was unmotivated, and for helping me with the climate change studies. Ana Rita Silva, my daily fellow, nowadays via Skype, thanks a million for hearing me and helping me with the biodiversity maps. Thanks also for your friendship - I miss a lot our lunch walks! Bruno Marcos, thanks for the nice discussions about remote sensing and satellites, but especially, thanks for the “piadas à Bruno”! And João Gonçalves, for the extraordinary conversations exchanged and all the input given, even being so busy.
6
There are also other important colleagues that I have to mention: Cristiana Vieira for the very nice period spent together in The Netherlands, and the helpful advices in the academic and not so academic matters. Paulo Alves, the “alive encyclopedia” for the all the knowledge transferred during our nice conversations, and especially for all the joy in our lunch walks. I will never forget the utilities of a young eucalypt! Cláudia Soares for being an “old sister”. Anabela Amado for showing the natural things. To all people in Porto lab, especially the “Criptodivas” Joana, Helena e Cristiana and the “Criptodivas bebés” Paula, Cristiana e Cláudia for being my fellows in Porto room when I was finishing this thesis. To all people in Vairão lab: Ângela, Joana, Sofia, Emilio and Zé António for all the support. To Vânia Santos for being my first co-oriented student. To Laura Moreno for the very nice moments spent at the time of your Erasmus Mundus in Porto.
And a big thank to all people from “erosivos” - Dao Aveiro for received me during the days when I was trying to solve the problems in SWAT during the PhD, and now for being my fellows, especially Patricia for the long talks in the train.
I would like to express my gratitude to Jorge Espinha for contributing to the book chapter, part of this thesis, and for the nice talks exchanged and the nice way of teaching.
To all my friends in Portugal, especially my cousins Catarina e Angelo for being always present. A big thank to all of my friends in The Netherlands, many of them already spread around the world. Thanks for all the joy, the share of experiences, the opportunity of knowing more about the world.
Also important “things” should be acknowledged, such as Sublime FM radio, former Arrow Jazz FM from The Netherlands, for entertain me along this PhD, now via Internet connection.
And to my cat for amusing me when I was frustrated!
Finally, to my family, to whom I owe everything I am, my profound gratitude for accompanying me.
And to André, for had walking with me through all the steps of this journey. Eternal gratitude for being on my side.
7
ANALYSING HYDROLOGICAL SERVICES PROVIDED BY FORESTS
Table of Contents
FOREWORD V
FINANCIAL SUPPORT VII
ACKNOWLEDGMENTS IX TABLE OF CONTENTS 7 RESUMO 11 ABSTRACT 13 LIST OF FIGURES 15 LIST OF TABLES 17 LIST OF ABBREVIATIONS 19 CHAPTER 1 21 INTRODUCTION 21
1.1. ECOSYSTEM SERVICES, BIODIVERSITY AND FORESTS 23 1.2. HYDROLOGICAL SERVICES AND FORESTS 27
1.2.1.WATER AND FORESTS 27
1.2.2.FROM HYDROLOGICAL PROCESSES TO HYDROLOGICAL SERVICES 30
1.3. TOOLS TO ANALYSE HYDROLOGICAL SERVICES 32
1.3.1. APPROACHES TO MODEL HYDROLOGICAL SERVICES 32
1.3.2. THE SWAT HYDROLOGICAL MODEL 32
1.3.3. REMOTE SENSING FOR ECO-HYDROLOGICAL ASSESSMENT 36
1.4.SCOPE, OBJECTIVES AND THESIS STRUCTURE 39
1.4.1.SCOPE 39
1.4.2.OBJECTIVES 40
1.4.3.THESIS STRUCTURE 41
CHAPTER 2 43
HYDROLOGICAL SERVICES AND THE ROLE OF FORESTS: CONCEPTUALIZATION AND INDICATOR-BASED ANALYSIS WITH AN ILLUSTRATION AT A REGIONAL
SCALE 43
8
2.2.CONCEPTUAL FRAMEWORK FOR HYDROLOGICAL SERVICES 46
2.2.1.CONCEPTUAL FRAMEWORK 46
2.2.2.DIMENSIONS OF HYDROLOGICAL SERVICES AND THEIR RELATION TO FORESTS 48
2.2.2.1. Water quantity 48 2.2.2.2. Water timing 50 2.2.2.3. Water quality 52
2.2.3.INDICATORS FOR EVALUATING HYDROLOGICAL SERVICES 53
2.2.4.SOCIAL-ECOLOGICAL PERSPECTIVE FOR HYDROLOGICAL SERVICES 55
2.3.ILLUSTRATING THE FRAMEWORK AT A REGIONAL SCALE 56
2.3.1.ENVIRONMENTAL AND SOCIAL-ECOLOGICAL SETTING OF NORTHERN PORTUGAL 56
2.3.2.THE FRAMEWORK APPLIED TO WATER SUPPLY AND WATER DAMAGE MITIGATION 58
2.4.DISCUSSION 60
2.5.CONCLUSIONS 64
CHAPTER 3 65
EVALUATION OF HYDROLOGICAL ECOSYSTEM SERVICES THROUGH REMOTE
SENSING 65
3.1.SOCIETY AND HYDROLOGICAL SERVICES 67
3.2.HYDROLOGICAL SERVICES AND THE WATER CYCLE 69 3.3.REMOTE SENSING OF ECOSYSTEM FUNCTIONING FOR HYDROLOGICAL SERVICES PROVISION
71
3.3.1.WATER SUPPLY 71
3.3.1.1 Atmosphere 71 3.3.1.2 Cryosphere 72 3.3.1.3 Surface water 73 3.3.1.4 Soil and ground 77 3.3.1.5 Vegetation 78
3.3.2.WATER DAMAGE MITIGATION 79
3.4.REMOTE SENSING OF DRIVERS AND PRESSURES OF HYDROLOGICAL SERVICES 80 3.5INTEGRATING REMOTE SENSING DATA WITH HYDROLOGICAL MODELLING 80
3.5.1HYDROLOGIC BIO-PHYSIOGRAPHIC VARIABLES 81
3.5.2HYDROLOGIC-STATE VARIABLES 81
3.5.3REMOTE SENSING APPLIED IN SWAT 82
3.6CONCLUSIONS AND PERSPECTIVES 83
CHAPTER 4 85
SIMULATING THE EFFECTS OF LAND COVER AND FUTURE CLIMATE CONDITIONS ON THE PROVISION OF HYDROLOGICAL SERVICES IN A MEDIUM-SIZED
WATERSHED OF PORTUGAL 85
4.1.INTRODUCTION 87
4.2.METHODS AND DATA 89
4.2.1.STUDY AREA 89
4.2.2.INPUT DATA AND SWAT SETUP 91
4.2.3.CALIBRATION AND VALIDATION AGAINST DISCHARGE 93
4.2.4.MODEL VERIFICATION FOR LEAF AREA INDEX (LAI) AND EVAPOTRANSPIRATION (ET) 94 4.2.5.MODEL VERIFICATION FOR TOTAL SUSPENDED SOLIDS (TSS) AND NITRATES (NO3) 94
4.2.6.SCENARIOS 96
4.2.6.1. Land cover 96 4.2.6.2. Future climate 97
4.3.RESULTS AND DISCUSSION 98
4.3.1.SWAT MODEL PERFORMANCE 98
9
ANALYSING HYDROLOGICAL SERVICES PROVIDED BY FORESTS
4.3.3.FUTURE CLIMATE EFFECTS ON HYDROLOGICAL SERVICES PROVISION 104
4.3.4.COMBINED EFFECTS OF LAND COVER AND FUTURE CLIMATE CONDITIONS ON HYDROLOGICAL SERVICES PROVISION 107
5.CONCLUSION 109
CHAPTER 5 111
FROM HYDROLOGICAL SERVICES TO A MULTIFUNCTIONAL WATERSHED: TRADE-OFFS AND SYNERGIES BETWEEN BIODIVERSITY CONSERVATION AND FOREST
ECOSYSTEM SERVICES 111
5.1.INTRODUCTION 113
5.2.METHODOLOGY 114
5.2.1.STUDY-AREA 114
5.2.2.ASSESSMENT OF ECOSYSTEM SERVICES PROVISION 116
5.2.2.1. Hydrological services 116 5.2.2.2. Biomass production and carbon storage 117
5.2.3.ASSESSMENT OF BIODIVERSITY CONSERVATION VALUE 118
5.2.4.SPATIAL ANALYSES 118
5.3.RESULTS 120
5.3.1.CURRENT PATTERNS OF ECOSYSTEM SERVICES PROVISION 120
5.3.2.CURRENT PATTERNS OF BIODIVERSITY CONSERVATION VALUE 121
5.3.3.ECOSYSTEM SERVICES UNDER LAND COVER CHANGE SCENARIOS 121
5.3.4.CONSERVATION VALUE UNDER ALTERNATIVE LAND COVER SCENARIOS AND TRADE-OFFS WITH ECOSYSTEM SERVICES 123
5.4.DISCUSSION 123
5.4.1.LAND COVER AND ECOSYSTEM SERVICES IN THE VEZ WATERSHED 123
5.4.2.TRADE-OFFS WITH BIODIVERSITY CONSERVATION AND IMPLICATIONS FOR LAND
MANAGEMENT 125
5.4.3.SWAT AS AN EFFECTIVE TOOL FOR MAPPING ECOSYSTEM SERVICES 126
5.5.CONCLUSIONS 127
CHAPTER 6 129
GENERAL DISCUSSION AND CONCLUSIONS 129
6.1.GENERAL DISCUSSION 131
6.1.1.FOREST HYDROLOGICAL SERVICES IN A SOCIAL-ECOLOGICAL FRAMEWORK 131
6.1.2.USING REMOTE SENSING TO IMPROVE THE ASSESSMENT OF HYDROLOGICAL SERVICES 133 6.1.3.ANALYSING HYDROLOGICAL SERVICES WITH ECO-HYDROLOGICAL MODELLING TOOLS 133
6.1.4.MODEL-BASED SCENARIO ANALYSIS OF HYDROLOGICAL SERVICES 135
6.1.4.1. Hydrological services in the Vez watershed 135 6.1.4.2 Hydrological services under land cover change scenarios 136 6.1.4.3. Effects of climate and interactions with land cover change 139
6.1.5.ADAPTIVE MANAGEMENT OF HYDROLOGICAL SERVICES IN SMALL WATERSHEDS 141
6.2CONCLUSIONS 142
6.2.1.OVERARCHING CONCLUSIONS 142
6.2.2.ADDITIONAL CONCLUSIONS FROM THE SEVERAL STUDIES 143
6.2.3.RECOMMENDATIONS FOR FUTURE RESEARCH 145
10
APPENDIX A 169 APPENDIX B 170 APPENDIX C 171 CURRICULUM VITAE 175 SENSE CERTIFICATE 177
ANALYSING HYDROLOGICAL SERVICES PROVIDED BY FORESTS 11
Resumo
A água é um recurso vital para todos os organismos vivos da Terra. Os seres humanos dependem dos ecossistemas para a prestação de serviços hidrológicos, tais como o abastecimento de água e a mitigação de danos causados pela água, que são essenciais para o seu bem-estar. No entanto, as preocupações com os problemas relacionados com a água têm vindo a aumentar nas últimas décadas, com especial ênfase para a escassez de água, a sua qualidade e os desastres causados por ela, incluindo as questões relacionadas com as alterações climáticas. Isso tem suscitado o interesse na gestão sustentável dos ecossistemas, em particular das florestas, para a prestação de serviços hidrológicos, tendo em conta o reconhecimento dos processos que suportam essa provisão. Por conseguinte, os serviços hidrológicos devem ser adequadamente conceptualizados, quantificados, mapeados e monitorizados. O principal objetivo de investigação desta tese foi desenvolver quadros teóricos e analíticos para avaliar os serviços dos ecossistemas hidrológicos prestados pelas florestas, apoiando assim as opções para o planeamento e gestão do território. Embora o foco geral desta tese seja o desenvolvimento de abordagens metodológicas, os resultados dessas novas abordagens tem também um potencial para o apoio à tomada de decisão sobre a gestão de bacias hidrográficas. Este potencial foi ilustrado para a bacia hidrográfica do rio Vez, no Noroeste de Portugal, onde a precipitação é alta, embora desigualmente distribuída ao longo do ano, com potencial para a ocorrência de episódios extremos relacionados com a água.
A pesquisa desenvolvida nesta tese é apresentada ao longo de seis etapas sucessivas. Primeiro foi apresentado o estado da arte sobre os diferentes níveis de análise dos serviços hidrológicos, capítulo 1. Em segundo lugar, no capítulo 2, foi elaborado um quadro conceptual para a prestação de serviços hidrológicos com base nas relações entre a água e as florestas, e no contexto da análise de sistemas sócio-ecológicos. Este quadro conceptual foi ilustrado para o abastecimento de água e os serviços de controle da erosão do solo e aplicado a uma escala regional, o Norte de Portugal. Os resultados mostram que o quadro conceptual proposto é uma ferramenta útil de apoio ao ordenamento do território e à gestão florestal, adequando a prestação de serviços hidrológicos com as condições biofísicas e sociais de cada região. A aplicação do quadro sugere que a combinação espacialmente explícita de indicadores relacionados com a propriedade do sistema, as funções, o serviço e o benefício pode ser uma forma eficaz de análise e gestão da oferta e da procura por serviços hidrológicos.
Posteriormente, no capítulo 3 é apresentada uma visão geral dos produtos de satélite que podem ser usados para avaliar e monitorizar a prestação de serviços hidrológicos, com base nos diferentes compartimentos de água existentes na Terra (atmosfera, criosfera, água de superfície, solo, aquífero e vegetação). A avaliação dos serviços de abastecimento de água e de mitigação de danos causados por ela pode beneficiar fortemente do uso de produtos de satélites, contribuindo para uma melhor compreensão dos processos e funções que estão na base da sua provisão, com elevada cobertura espacial e resolução temporal.
Como a ilustração dos serviços hidrológicos apresentados no capítulo 2 foi baseada em modelação estática, foi testada a aplicação de uma estrutura de modelação dinâmica para avaliar o papel das florestas na prestação de serviços hidrológicos. Assim, no capítulo 4, o modelo hidrológico SWAT (Ferramenta de Avaliação de Água e Solo) foi aplicado na bacia hidrográfica do Vez para analisar a prestação de serviços hidrológicos em cenários de alteração do uso/cobertura do solo e as condições climáticas futuras. Os resultados das simulações relativamente aos cenários de cobertura do solo revelaram que a opção por um determinado cenário não comprometeria a prestação global dos serviços hidrológicos. No entanto, cada cenário pode ser adoptado para
12
maximizar a prestação de um determinado serviço, por exemplo florestas de carvalhos naturais podem ser promovidas para melhorar a libertação gradual de água no rio. O estudo mostra ainda que a alteração climática pode afetar a prestação dos serviços hidrológicos de duas maneiras, reduzindo os caudais na estação seca e aumentando os riscos de picos de caudal passiveis de criar inundações durante os meses de chuva. Os efeitos combinados de clima e alteração da cobertura de solo podem compensar os picos de caudal durante o inverno, mas agravar os baixos caudais de verão na presença de florestas. A erosão do solo e a concentração de nitratos no rio aumentarão em condições climáticas futuras, podendo ser agravadas no cenário de uso do solo agrícola. Estes resultados reforçam a necessidade de se considerar não só o clima, como também os impactos da mudança de uso do solo em opções de gestão que visam uma melhor adaptação às novas condições de provisão dos serviços relacionados com a água à escala de bacias hidrográficas.
Com base nos resultados das simulações do SWAT desenvolvidas no capítulo anterior, no capítulo 5 foi desenvolvida uma avaliação espacial dos serviços hidrológicos, da produção de biomassa e do armazenamento de carbono, juntamente com a valoração da conservação da biodiversidade para analisar os conflitos e sinergias entre eles. Os resultados mostraram que o desempenho para o fornecimento da água (quantidade e sazonalidade) é melhor nos cenários de arbustos e de carvalhos, na sub-bacia de alta montanha. Enquanto o cenário de eucalipto e pinheiro tem maior desempenho para a prestação da regulação de picos de cheia e controle de erosão, especialmente na baixa montanha. Este último service é também favorável no cenário arbustivo. O melhor cenário para a conservação da biodiversidade é o de carvalho.
Finalmente no capítulo 6 foram discutidas as contribuições metodológicas, os principais resultados e sua relevância para a gestão de políticas gestão dos usos do solo. A análise de serviços hidrológicos prestados pelas florestas é um tema que combina os princípios e métodos da eco-hidrologia com conceitos e métodos da ciência dos serviços de ecossistemas. As dimensões de análise abrangem não só a aquisição e aplicação dos fundamentos conceptuais de ambas as ciências, mas também uma descrição de formas de avaliação e monitorização para a prestação de serviços hidrológicos. Para além disso, deve também abranger o uso de ferramentas de modelação para ser capaz de entender e prever os processos hidrológicos e suas ligações com as funções ecológicas dos ecossistemas. As principais contribuições desta investigação foram: (1) o desenvolvimento de um quadro conceptual para a análise dos serviços hidrológicos prestados pelas florestas; (2) uma revisão exaustiva das muitas vantagens que a detecção remota oferece para a avaliação, gestão e monitorização de serviços hidrológicos; e (3) a aplicação do modelo SWAT a uma bacia de média dimensão para avaliar as consequências de diferentes opções de uso/cobertura do solo, bem como condições climáticas futuras, na prestação de serviços hidrológicos. Em conclusão, para uma correta avaliação dos processos hidrológicos que levam à prestação de serviços hidrológicos, o uso de modelos hidrológicos é uma abordagem eficaz, especialmente em associação com produtos de satélite para prever e monitorizar a condição das funções hidrológicas dos ecossistemas e paisagens.
Palavras-chave: Alterações Climáticas; Bacia Hidrográfica do Vez; Conservação da Biodiversidade;
Florestas; Indicadores; Ordenamento do território; Produtos de satellite; Quadro conceptual; Serviços hidrológicos; SWAT .
ANALYSING HYDROLOGICAL SERVICES PROVIDED BY FORESTS 13
Abstract
Water is a vital resource for all living organisms on Earth. Humans rely on ecosystems for the provision of hydrological services, namely water supply and water damage mitigation, essential for their well-being. However, concerns over the water problems have been increasing in the last decades, with special emphasis for water scarcity, quality and disasters, including issues related to climate change. This has been raising interest in the sustainable management of ecosystems, in particular of forests, for the provision of hydrological services, taking into account the recognition of the processes behind that provision. As a result, hydrological services should therefore be adequately conceptualized, quantified, mapped and monitored. The main objective of the research underlying this thesis was to develop theoretical and analytical frameworks to assess hydrological ecosystem services provided by forests, thereby supporting options for spatial planning and land management. Although the general focus of this thesis is on the development of methodological approaches, the outcomes from those novel approaches are expected to have a potential to support decision-making on the watershed management and governance. This potential was illustrated for the Vez watershed, in northwest Portugal, where precipitation is high, although unevenly distributed throughout the year, with possible occurrence of water extreme episodes.
The research developed for this thesis was addressed throughout six successive steps. First the current state of knowledge on the different levels of analysis of hydrological services, chapter 1, was presented. Secondly, in
chapter 2, a conceptual framework for the provision of hydrological services based on the relations between
water and forests was elaborated, in the context of social-ecological system analysis. This conceptual framework was illustrated for the water supply and soil erosion control services, applied at a regional scale for northern Portugal. Results show that the proposed conceptual framework is a useful tool to support land planning and forest management, adapting the provision of hydrological services to the regional biophysical and social conditions. The application of the framework across a heterogeneous region suggested that a spatially explicit combination of system property, function, service and benefit indicators can be an effective way of analysing and managing the supply and demand of hydrological services.
Subsequently, in chapter 3, an overview of the satellite products that can be used to evaluate and monitor the provision of hydrological services, based on the different water compartments on Earth (atmosphere, cryosphere, surface water, soil, ground and vegetation) was presented. The assessment of water supply and water damage mitigation services can strongly benefit from the use of satellite-based products, contributing to improve the understanding of the processes and functions behind their provision, on a spatially explicit and near-real time basis.
As the illustration of the hydrological services presented in chapter 2 was based on a static modelling approach, the application of a dynamical modelling structure to evaluate the role of forests on hydrological services provision was then tested. Therefore, in chapter 4, the SWAT (Soil and Water Assessment Tool) hydrological model was applied in the Vez watershed to analyse the provision of hydrological services under scenarios of land use/cover change and future climate conditions. Results for the simulations under land cover scenarios revealed that the option for one particular scenario would not compromise the overall provision of hydrological services. However, each scenario may be adopted to improve the provision of a given service, for instance natural oak forests can be promoted to improve the gradual release of water into the river network. The study showed that climate change could affect the provision of hydrological services in two ways, by reducing dry season flows and by increasing flood risks during wet months. Combined effects of climate and land use change can offset peak flows during winter and reduce low flows in summer in the presence of forests. Soil erosion and
14
nitrates concentration in the river will increase under future climate conditions and could be aggravated in the agricultural land use scenario. These results emphasise the need to consider both climate and land use/cover impacts in management options aimed to improve adaptation to changed conditions in the water services at the watershed scale.
Based on the outputs from SWAT simulations developed in the previous chapter, in chapter 5 a spatial assessment of the hydrological services, biomass production and carbon storage provision, together with the biodiversity conservation value was developed to analyse trade-offs and synergies to support land planning and management at the watershed scale. Results showed that the performance for the provision of water quantity and timing is better under the shrubland and oak scenarios, in the high mountain sub-basin. While the eucalyptus/pine forest scenario has higher performance for the provision of flood regulation and erosion control, especially in the low mountain. Erosion control is also favoured under the shurbland scenario. The scenario with less trade-offs with biodiversity conservation is the oak.
The methodological contributions, the main findings and their relevance for land management and policies were finally discussed in chapter 6. Analysing hydrological services provided by forests is a topic that combines principles and methods of eco-hydrology with concepts and methods from the novel ecosystem services science. The dimensions of the analysis encompass the acquisition and application of the conceptual foundations from both sciences, as well as a description of different ways for evaluating and monitoring the hydrological services provision. Moreover, it should also encompass the use of modelling tools to be able to understand (and predict) hydrological processes and their links to the ecological functions of ecosystems. The main contributions of this research were: (1) the development of a conceptual framework for the analysis of hydrological services provided by forests; (2) an exhaustive review of the many advantages that Earth observation offers for the evaluation, management and monitoring of hydrological services; and (3) the application of the SWAT model to a medium-sized watershed for the evaluation of the consequences of both land use/cover options and future climate conditions on the hydrological services provision. In conclusion, for a correct evaluation of the hydrological processes that lead to hydrological services provision, the use of daily-runoff models is an effective tool, especially in association with the powerful satellite products, to predict and monitor the condition of water functions in dynamic ecosystems and landscapes.
Keywords: Biodiversity conservation; Climate change; Conceptual framework; Forests; Hydrological services;
ANALYSING HYDROLOGICAL SERVICES PROVIDED BY FORESTS 15
List of Figures
Chapter 1
Figure 1. 1–The several types of ecosystem services and their relation with species diversity, from
Elmqvist, 2010. _________________________________________________________________ 24
Figure 1. 2 - Forest ecosystem services organized by major classes, from Shvidenko et al., 2005. 25 Figure 1. 3 – a) Average annual precipitation in Portugal (1961-90 average, from the SNIRH), and
forest distribution in the country by dominant species (National Inventory of Forests, 2010). ______ 26
Figure 1. 4 – The world distribution of water. __________________________________________ 27 Figure 1. 5 – The water cycle, from Diop et al., 2002. ___________________________________ 27 Figure 1. 6 - Hydrologic responses to changes in forest disturbance and management, from Jones et
al. 2009. _______________________________________________________________________ 29
Figure 1. 7 -The relationship between the ecohydrological processes and the provision of
hydrological services, connected by attributes such as of quantity, quality, location and timing, from Brauman et al. 2007. _____________________________________________________________ 31
Figure 1. 8 – The movement of water from precipitation through the vegetation and soil system into
streams, and how it is affected by changes in vegetation, from Le Maître, et al., 2014. __________ 31
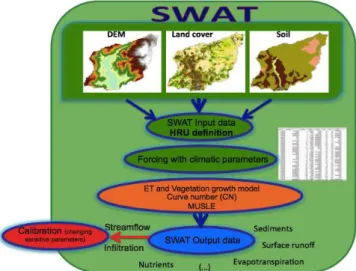
Figure 1. 9 – Simple schematic flow of the steps required in ArcSWAT. _____________________ 34 Figure 1. 10 – Spectral characteristics of the electromagnetic spectrum, from Tuner et al., 2008. _ 37 Figure 1. 11 - Typical spectral reflectance curves for water, soil and vegetation, from de Jong et al.,
2004. _________________________________________________________________________ 37
Chapter 2
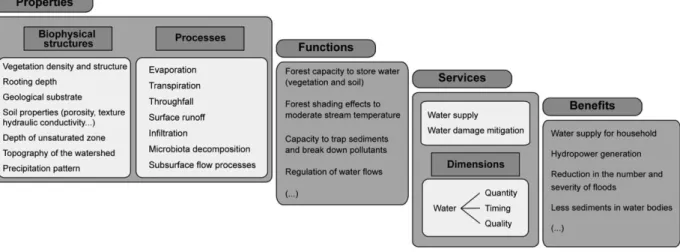
Figure 2. 1 - Conceptual framework for hydrological services provision by forests, showing the relationship between the biophysical ecosystem (properties and functions) and the social system (services and benefits). Inside boxes are some examples of each step of the framework. Adapted from the ecosystem services framework by de Groot et al. (2010b) and Haines-Young & Potschin (2010). _____________________________________________________________________________________________________________ 47
Figure 2. 2 – The Framework for Ecosystem Service Provision (FESP) applied to hydrological
services provided by forests. DPSIR (Drivers, Pressures, State, Impacts and Responses). ESp – ecosystem services providers. ESb – ecosystem services beneficiaries. Modified from Rounsevell et al. (2010). _________________________________________________________________________________________________________ 55
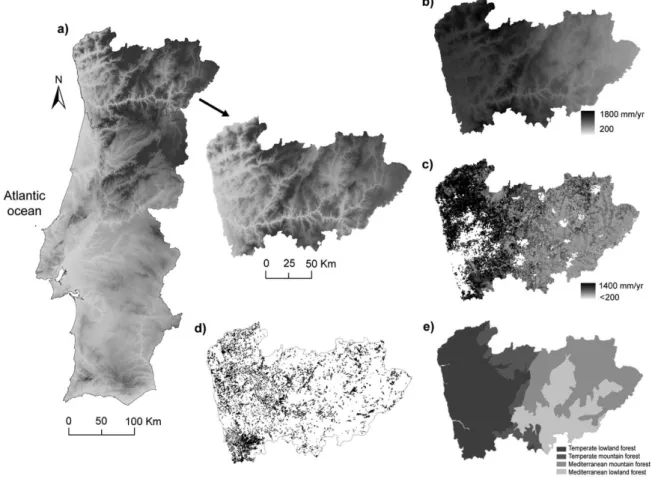
Figure 2. 3 – The study area. Indicators and sources: a) Location - Digital elevation model (SRTM –
90 m resolution); b) Mean annual precipitation (mm/yr, 250 m2 pixel resolution) from Worldclim database, 1950-2000 (Worldclim, 2010); c) Mean annual evapotranspiration (mm/yr, 1km2 pixel resolution) from MODIS, 2000-2010 (MODIS, 2010); d) Forest distribution (evergreen, broadleaved and mixed) – from CORINE Land Cover 2006 (EEA, 2006); and e) Simplified map of potential native forests - modified from Costa et al. (1998). ___________________________________________________________________ 57
Figure 2. 4 - Illustration of the conceptual framework of hydrological services provided by forests
using two examples: water supply (quantity) at the municipality level, and water damage mitigation (soil erosion control) at the sub-basin level. __________________________________________________________________ 62
Chapter 3
Figure 3. 1 - Framework for the provision of hydrological services, in the context of social–ecological
systems. Based on Rounsevell, M. D. A., et al., (2010) and Haines-Young, R., and M. Potschin (2010). _____________________________________________________________________________________________________________ 67
Figure 3. 2- The water cycle in the vicinity of the land surface. Conceptual model based on Fitts, C.
R., (2002). _________________________________________________________________________________________________________ 69
16
Chapter 4
Figure 4. 1 – Location map of Vez watershed in northwest Portugal with 10 sub-basins (white limits),
and the Digital Elevation Model of the region (shadow); a) Land cover map, 2006 (SIGN II, 2008); b) Soil map (Agroconsultores and Geometral, 1995). __________________________________________________________ 90
Figure 4. 2 – Daily observed and simulated discharge for calibration and validation period, after
parameter calibration (table 4.4 and 4.5). Performance statistics are presented in Tables 4.8 and 4.9. _____________________________________________________________________________________________________________________ 99
Figure 4. 3 – Comparison between monthly observed and simulated values for sediments (t/ha.yr)
and monthly nitrates (ton. NO3), after parameter calibration. _____________________________________________ 100
Figure 4. 4 – a) The water balance simulated by SWAT in the Vez watershed (monthly averages for
the period 2003-2008); and b) average monthly discharge under different land cover scenarios (m3/s). ____________________________________________________________________________________________________________________ 101
Figure 4. 5 – Flow duration curves for: (a) land cover scenarios; (b) and future climate conditions
(logarithm scale). Those curves express the probability of exceeding a given streamflow. ___________ 103
Figure 4. 6 – a) Average monthly discharge (m3/s) under future climate conditions; and b) percentage of change in monthly average discharge under future climate conditions combined with land cover scenario of increase eucalyptus/pine forest or increase agriculture. _____________________________________ 107
Chapter 5
Figure 5. 1 – The study area, Vez watershed, with the location of observed data stations used to
setup SWAT model, the range of altitude and a climate plot (yearly average values 1999-2008). ___ 115
Figure 5. 2 – a) Land cover map of Vez watershed (year 2006); b) Biodiversity protection levels in the
Vez watershed. __________________________________________________________________________________________________ 115
Figure 5. 3 – Ecosystem services provision by the major sub-basins (% of the service in the whole
watershed). The values were weighted by the area of each HRU and by the area of the basin. _____ 120
Figure 5. 4 – Spatial distribution of biodiversity conservation value in the Vez watershed; a) current
pattern; b) future pattern under eucalyptus/pine scenario; c) future pattern under oak scenario. ____ 121
Figure 5. 5 – Maps of the ecosystem services simulated in SWAT at the HRU level, under three land
cover scenarios in the Vez watershed. _______________________________________________________________________ 122
Appendices
Figure B. 1 - Average evapotranspiration (mm/yr) by different land-covers in Vez basin from
MOD16A2 product and simulated by SWAT. ________________________________________________________________ 171
Figure B. 2 – Average evapotranspiration in Minho region, by pure 1km2 cells (≥ 75% occupied by a single land cover type). _________________________________________________________________________________________ 171
Figure C. 1 – Box plots representing the median value of the distribution in each scenario. (Shrub n = 500; Oak and EUP = 320). The outliers were not considered in the plots. The tables show the
Wilcoxon test results, with respective hypothesis ans significance. ______________________________________ 173
ANALYSING HYDROLOGICAL SERVICES PROVIDED BY FORESTS 17
List of tables
Chapter 2
Table 2. 1 - Synthesis of general forests ecohydrology and hydrological services, compared forest to
non-forest areas. _________________________________________________________________________________________________ 52
Table 2. 2 – Some examples of indicators for hydrological services evaluation, organized according to
the conceptual framework ______________________________________________________________________________________ 54
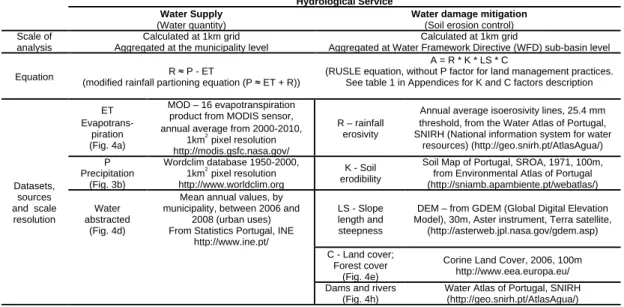
Table 2. 3 - Datasets and sources used to build the maps from Figure 4.4. _____________________________ 58
Table 2. 4 – Methods used in each step of the framework illustration ____________________________________ 59
Chapter 3
Table 3. 2 – Examples of Sensors and Satellites to Measure the Elements of the Water Cycle ______ 76
Chapter 4
Table 4. 1 - Land use classes used in SWAT (Figure 4.1a). _______________________________________________ 90
Table 4. 2 - Potential hydrological services provision related to the SWAT outputs indicators
presented in this study. __________________________________________________________________________________________ 91
Table 4. 3 - SWAT data variables for model setup and calibration/validation. ___________________________ 92
Table 4. 4 - Modified SWAT general parameters for the entire Vez watershed. ________________________ 93
Table 4. 5 - Modified SWAT parameters by land cover for LAI/ET and erosion calibration in crop and
management (.mgt) databases. ________________________________________________________________________________ 95
Table 4. 6 - Comparison between the average annual evapotranspiration, soil erosion and nitrogen rates by land cover (simulated by SWAT) with the values from the literature and MODIS ET. ________ 96
Table 4. 7 - Land cover scenarios considered for SWAT simulation period 2003-2008. Urban areas
(4%) are constant. _______________________________________________________________________________________________ 97
Table 4. 8 - Calibration and validation goodness-of-fit statistics for discharge in SWAT model. ______ 99
Table 4. 9 - Calibration goodness-of-fit statistics for sediments and nutrients in SWAT model. _____ 100
Table 4. 10 - Land cover effects on hydrological services provision, simulation 2003-2008. _________ 102
Table 4. 11 - Changes in precipitation, maximum and minimum temperature, in northwest Portugal,
under RCP 4.5 scenario (ensemble of 4 GCMs). ___________________________________________________________ 105
Table 4. 12 - Future climate effects under the RCP4.5 scenario for 2021-40 and 2041-60 periods,
combined with two different land cover scenarios. Baseline 1981-2000. ________________________________ 106
Chapter 5
Table 5. 1 – SWAT indicators for ecosystem services provision analysis used in the Vez watershed
____________________________________________________________________________________________________________________ 117
Table 5. 2 - Land cover scenarios considered for SWAT simulation period 2003-2008. Urban, CORN and BSVG areas (4%) are constant. _________________________________________________________________________ 119
Table 5. 3 - Spearman correlation test between the services provision and biodiversity conservation
value, in the three land covers. ________________________________________________________________________________ 123
Chapter 6
Table 6. 1 - Performance of land cover change scenarios for provision of hydrological services in the
Vez watershed (based on results from chapters 4 and 5). ________________________________________________ 138
18
Appendices
Table A. 1 – RUSLE equation factors (K and C) applied in northern Portugal. _________________________ 169
Table A. 2 - Tree species and respective environmental characteristics. _______________________________ 169
Table C. 1 - Biodiversity conservation value of each land cover type for five major taxonomic
terrestrial groups. The values were weighted by the protection factor ___________________________________ 172
Table C. 2 - Water damages in Vez watershed related in the newspaper “Notícias dos Arcos”, from a
master thesis (Gonçalves, 2009, FLUP) _____________________________________________________________________ 174
ANALYSING HYDROLOGICAL SERVICES PROVIDED BY FORESTS 19
List of abbreviations
ARIES - Artificial Intelligence for Ecosystem Services CBD – Convention on Biological Diversity
CICES – Common International Classification of Ecosystem Services CMIP5 – Coupled Model Intercomparison Project Phase 5 (IPCC) DPSIR – Drivers Pressures States Impacts Responses
ESA – European Space Agency
ESb – Ecosystem Services beneficiaries ESp – Ecosystem Services providers ET – Evapotranspiration
EU – European Union
FAO – Agriculture Organization of the United Nations FESP – Framework for Ecosystem Service Provision GCM – General Circulation Models
GEO – Geostationary Orbit
GIS – Geographical Information System GNSS – Global Navigation Satellite Systems ha - hectare
HRU – Hydrological response unit (SWAT)
IAHS– International Association of Hydrological Sciences InVEST – Integrated Tool to Value Ecosystem Services
IPBES – International science-policy Platform on Biodiversity and Ecosystem Services IPCC– Intergovernmental Panel on Climate Change
IPMA – Portuguese Institute of the Sea and Atmosphere IR – Infrared Radiation
LAI – Leaf Area Index LEO – Low Earth Orbits
LiDAR – Light Detection and Ranging MA – Millennium Ecosystem Assessment
MODIS – Moderate Resolution Imaging Spectroradiometer MR – Microwave radiation
MUSLE – Modified Universal Soil Loss Equation (SWAT) NASA – National Aeronautics and Space Administration
20 CHAPTER 1. INTRODUCTION
NGO– Non-governmental organizations NIR – Near-Infrared Radiances
NOAA – National Oceanic and Atmospheric Administration NPP – Net Primary Productivity
NSE – Nash-Sutcliffe efficiency PBIAS – Per cent bias
PET – Potential Evapotranspiration POES – Polar Orbiting Platforms PR – Precipitation Radar
R2 – Coefficient of determination
RADAR – Radio Detection and Ranging RCM – Regional Climate Models
RCP – Representative Concentration Pathways RUSLE – Revised Universal Soil Loss Equation
SNIRH – National System for Water Resources Information SWAT – Soil and Water Assessment Tool
SWE – Snow Water Equivalent
TEEB – The Economics of Ecosystems and Biodiversity TRMM – Tropical Rainfall Measuring Mission
VIS – Visible Radiation yr – year
The abbreviations related to the satellite products were not described here, as they are described when mentioned in chapter 3.
ANALYSING HYDROLOGICAL SERVICES PROVIDED BY FORESTS 21
Chapter 1
Introduction
“Water is the elixir of life on Planet Earth,
equally fundamental for humans as for ecosystems.”
(Falkenmark & Rockstrom, 2004)
ANALYSING HYDROLOGICAL SERVICES PROVIDED BY FORESTS 23
1.1. Ecosystem services, biodiversity and forests
Nature provides us with goods (such as timber), and services (such as regulation of water flow and quality), which together have been commonly called “ecosystem services” (de Groot, 1992; Daily, 1997) and more recently, eco-services (Costanza et al., 2014). Pressures such as land-use change, overexploitation, pollution and climate change are causing impacts on ecosystem services provision (MA, 2005; Rounsevell et al., 2010). From the awareness of the importance of those services for human well-being, responses based on spatial planning and land management, such as afforestation actions can be developed to improve ecosystem services delivery (Carpenter et al., 2009; EASAC, 2009).
The Millennium Ecosystem Assessment (MA), was the first international political and scientific effort leaded by the United Nations to assess the consequences of ecosystem change for human well-being (MA, 2003). According to the MA classification there are four categories of ecosystem services: provisioning (e.g. food, timber), regulating (e.g. carbon sequestration, water regulation), cultural (e.g. recreation, inspiration) and supporting services (e.g. soil formation, nutrient cycle) (MA, 2003). The first three categories have a direct impact on human well-being, while the latter gathers the essential processes that support the services in the first three categories, and so it is often not considered for economic assessments (Johnston & Russell, 2011). Several typologies for ecosystem services have emerged since the MA (de Groot et al., 2002; Wallace, 2007; de Groot et al., 2010b), also associated to global initiatives such as TEEB (The Economics of Ecosystems and Biodiversity), which draws attention for the economic costs of biodiversity loss and ecosystem degradation (de Groot et al., 2010a). More recently, CICES (Common International Classification of Ecosystem Services), a new classification system for ecosystem services developed by the European Environment Agency, structures the provisioning, regulating and cultural services by class, avoiding double-counting for economic studies (Haines-Young & Potschin, 2012).
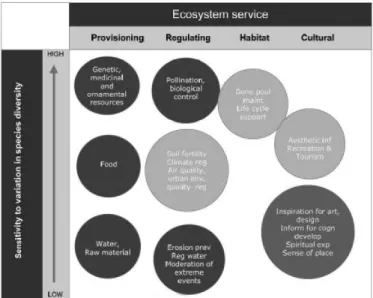
Biodiversity, as part of ecosystems, has an important role in the provision of goods and services for human well-being (MA, 2003; Balvanera et al., 2006; Elmqvist et al., 2009) (Figure 1.1). Furthermore, it is accepted that changes in biodiversity may influence the supply of ecosystem services, as well as many aspects of ecosystem stability, functioning and sustainability (Costanza et al., 2007; Egoh et al., 2010; Mace et al., 2011; Perrings et al., 2011). In fact, some aspects of biodiversity are even considered as ecosystem services themselves, such as the habitat service (Hein et al., 2006), gene pool protection, biological regulation against pest(de Groot et al., 2010b), pollination and seed dispersal (MA, 2003). Biodiversity conservation is also considered as a service considering the cultural goods and amenities that humans can achieve from the existence of biodiversity and nature (Hein,
24 CHAPTER 1. INTRODUCTION
2010; Mace et al., 2012). On the other hand, biodiversity conservation can be considered an important asset subject of trade-off analysis with ecosystem services provision (Nelson et al., 2009). Chapter 5 from this thesis deals with this dimension of biodiversity.
Figure 1. 1 –The several types of ecosystem services and their relation with species diversity, from Elmqvist, (2010).
Despite its significant ecological and economical value, biodiversity is being lost, and in some regions at a rapid rate (Díaz et al., 2006). Indirectly, this implies a decrease of ecosystem services provision, especially the ones more dependent on biodiversity (Figure 1.1) (Carpenter et al., 2009; EASAC, 2009). Over the last decades, biodiversity has been an important environmental and nature conservation issue. However, international initiatives and strategies aimed at halting the loss of biodiversity have failed in achieving their goals (Larigauderie et al., 2012). To cope with this, one of the ultimate reasons for biodiversity conservation is the real interest that people have in the societal benefits it generates, clearly explicit in the new Aichi biodiversity targets for 2020 (CBD, 2010). In 2011, the European Union (EU) adopted an ambitious strategy to halt the loss of biodiversity, acknowledging the value of ecosystems and the need to restore ecosystems for the benefit of both nature and society (EU, 2011). Although in this context biodiversity seems to be an anthropogenic and market concept, the truth is that if well managed, biodiversity and ecosystem services provision can promote a sustainable development and help to cope with biodiversity loss in the next decades (Maes et al., 2012). In this regard, IPBES (Intergovernmental Science-Policy Platform on Biodiversity and Ecosystem Services) or TEEB are examples of joint initiatives that provide an interface between the scientific community, policymakers and NGOs, strengthening decisions on conservation and sustainability for both biodiversity and ecosystem services (Ring et al., 2010). However, some aspects of the relationship between biodiversity and ecosystem services are still unclear, namely to what extent biodiversity
ANALYSING HYDROLOGICAL SERVICES PROVIDED BY FORESTS 25
conservation ensures the provision of services (EASAC, 2009; Egoh et al., 2009), and on how ensuring the provision of ecosystem services can(or not) support biodiversity conservation (Faith and Walker, 2002).
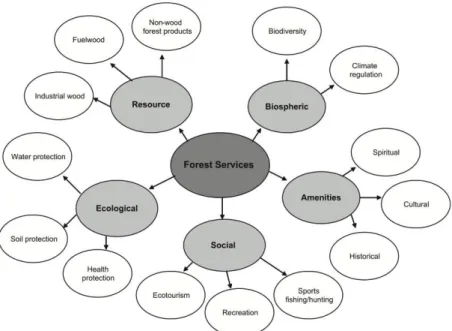
Forests are an important repository of terrestrial biodiversity and are responsible for the provision of important ecosystem services for human well-being (Figure 1.2), such as wood and non-wood forest products, water regulation, carbon sequestration, soil protection or recreation (Shvidenko et al., 2005). However, pressures such as conversion of forests into agricultural land, over-exploitation, the spread of invasive species, air pollution or climate change are causing great stress on forest ecosystems (Louman et al., 2010). The sustainable management of forest ecosystems may mitigate these degradation causes and also improve ecosystem services supply (MA, 2003).In particular, the EU policy for forestry is encouraging forest holders to adopt management plans that integrate biodiversity measures and support innovative funding mechanisms for the maintenance and restoration of ecosystem services that are generated by sustainably managed multifunctional forests (EU, 2013).
Figure 1. 2 - Forest ecosystem services organized by major classes, from Shvidenko et al., (2005).
Forests in Europe currently occupy about 40% of the land, and in Portugal this value is around 38% (Schutyser, 2010; FAO, 2013). In Portugal, cork oak, maritime pine and eucalypt represent more than 85% of the forest area, with the eucalyptus as the species with greatest representation (Pereira et al., 2011). Forests in Portugal provide common indirect services, such as carbon sequestration, soil protection or water regulation. In the northern and central parts of the country, pine and eucalypt stands contribute to wood and pulp production, respectively, and the eucalypt has expanded quickly since the 1960s when the
26 CHAPTER 1. INTRODUCTION
paper industry took off (Carvalho Mendes, 2004). In the south, the montado (a savannah-like, oak agro-forest ecosystem) contributes to more than 50% of the worldwide cork production (Sá-Sousa, 2013). In Portugal, like in other Mediterranean regions, forests are expanding mainly as a result od succession following farmland abandonment, resulting in a positive reduction of soil erosion and river peak flows in winter (García-Ruiz et al., 2011). From an hydrological services perspective, this expansion should be managed considering the conflicts that may arise: (a) between forest growth and water yield in the drier regions, with a general decline in the total streamflow (Bredemeier, 2011); and (b) between forest biomass accumulation and fire hazard, especially when forests are composed by non-native species demanding more effective forest conservation and management strategies (Moreira et al., 2011; Fernandes, 2012).
Forests usually grow in regions with total annual precipitation above 500 mm (Chang, 2009). This indicates the strong connection between forest and water, with the latter determining tree species distribution. For instance, in Portugal the cork oak is mainly distributed in the south, but avoiding the driest areas, which are occupied by holm oak (Figure 1.3).
Figure 1. 3 – a) Average annual precipitation in Portugal (1961-90 average, from the SNIRH), and forest distribution in the country by dominant species (National Inventory of Forests, 2010).
ANALYSING HYDROLOGICAL SERVICES PROVIDED BY FORESTS 27
1.2. Hydrological services and forests
1.2.1. Water and forestsWater plays an essential role in the functioning of ecosystems, underpinning biochemical cycles, supporting living organisms and their growth, and creating aquatic habitats on Earth (ChapinIII et al., 2002). More than 70% of the Earth’s surface is covered by water, and in the atmosphere there is a layer of water vapour about 90 km thick (Chang, 2009). However, the distribution of water in the planet according to the different Earth systems is uneven (Figure 1.4).
Figure 1. 4 – The world distribution of water.
Freshwater, the source of water for human needs, corresponds to only a small portion of the world’s total water (Fetter & Fetter, 2001). Although not directly used by humans, oceans and glaciers, where the majority of water is located, play a rather important role in the water cycle (Figure 1.5).
28 CHAPTER 1. INTRODUCTION
The water cycle, powered by solar radiation, is an essential process to support the dynamics of distribution and purification of water. It is based on the three physical states of water, thereby including a liquid phase, solid phase and gaseous phase (Diop et al., 2002). Water evaporates from the oceans and from the land surface to be transported and lifted into the atmosphere until it condenses and precipitates over land and oceans (Chow et al., 1988). The quantities of water vapour in the atmosphere are mainly obtained from the oceans, followed by evapotranspiration from land (living organisms and soil), and to a lesser extent from freshwater surfaces (Figure 1.5). Evapotranspiration from land returns about 65% of water back to the atmosphere (recycling moisture), which will then feed precipitation somewhere else (van der Ent et al., 2010). Precipitated water over land may be intercepted by vegetation, or when reaching the land surface, water can become either overland flow, or infiltrate into the ground flowing through the soil as surface flow or base flow to be discharged into the streams as runoff (Chow et al., 1988). From the precipitation that falls over land, about 35% returns to the oceans as water runoff and a small portion (2.5%) ends in land water surfaces (Gleick, 1993).
Plants have an active role in the water cycle, namely in water fluxes, such as evapotranspiration (transpiration and interception), throughfall and sediment transport (Kundzewicz, 2002). In particular, forests are considered the most prominent ecosystems interacting with water, due to their height, dense crown canopy, spread of the root system, wide horizontal distribution and vertical coverage (Calder, 2002; Chang, 2009). With forests, the occurrence, distribution and circulation of water are modified, the quality of water is enhanced and the timing of flow is altered (Chang, 2009). Forests and water are connected by physical and biological processes, so the management of forests affects the quantity, quality and timing of water (Jones et al., 2009) (Figure 1.6).
ANALYSING HYDROLOGICAL SERVICES PROVIDED BY FORESTS 29
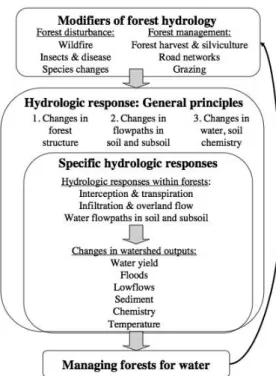
Figure 1. 6 - Hydrologic responses to changes in forest disturbance and management, from Jones et al. (2009).
Ecohydrology is the discipline that links both Hydrology (the study of the water processes) and Ecology (the study of the interactions between the living organisms and their environment), which has evolved since the 1990s following the growing demand for protecting rivers and streams (David M Harper, 2008). It proposes an integrative way of thinking, combining different disciplines seeking solutions for environmental problems related with water (e.g. water scarcity and allocation, floods and their consequences, water quality, eutrophication, soil erosion) (David M Harper, 2008; Vose et al., 2011). The perspectives created by this interdisciplinary view are improving the understanding of vegetation-water-nutrient connections to address the water resource issues (Newman et al., 2006; Vose et al., 2011). Parallel to Ecohydrology, Forest Hydrology is a discipline of Hydrology that studies specifically the relation of forest processes with all phases of the water cycle. However, it is restricted to forest ecosystems in an one-way influence, not considering the influence of water on vegetation growth (Chang, 2009). Studies reporting the interactions between water, biota and the physical conditions of the watershed have been done since several decades ago (Bosch & Hewlett, 1982; Kundzewicz, 2002). Those were traditionally supported by paired watershed studies with experiments in forested/non-forested watersheds, monitoring the effects of forest structure and composition on the storage and flow path of water (Jones et al., 2009). Figure 1.6 shows how forest modifiers, for instance a change in tree species, can influence the hydrologic responses of a watershed.
30 CHAPTER 1. INTRODUCTION
The broad scientific context of the research developed for this thesis is provided by Ecohydrology, complemented with Forest Hydrology regarding the influence of forest management options on water resources. This thesis applies an interdisciplinary approach to predict hydrological responses as a function of land cover and climate change, socio-economic and ecological factors (Vose et al., 2011; Le Maitre et al., 2014). This arises from the growing interest in understanding forest ecohydrological processes, in order to address water resource issues under the worldwide water crises and the on-going climate change debate (David M Harper, 2008; Vose et al., 2011).
1.2.2. From hydrological processes to hydrological services
As referred above, water regulation, carbon sequestration or pollination play an important role in the regulation of essential ecological processes and life support systems through biogeochemical cycles and other processes of the biosphere (de Groot et al., 2002; MA, 2003). Focusing on water and on the processes depending on water, a broad category of ecosystem services came up crossing the MA categories – the hydrological services, i.e. the water related benefits (Brauman et al., 2007). Examples of these benefits are the water supply for household use, mitigation of flood damages, cultural services, and water-related supporting services such as plant growth (Figure 1.7).
One of the most important driving forces acting on hydrological services is forest cover (Calder, 2002). There is a strong link between forests, soil and water, with forests often being compared to sponges due to their soil capacity of storing water (Calder, 2002; Lele, 2009). On the other hand, forests reduce the total annual water yield through their high rates of evapotranspiration to the atmosphere (Bosch & Hewlett, 1982). Positively, there is an increase of water infiltration into the ground, which depends on the canopy intersection (by precipitation and fog), soil characteristics and litter absorption processes (Figure 1.8). In addition, forests maintain water quality by enhancing soil stability and nutrient usage (Pattanayak, 2004; EASAC, 2009). Thus, promoting forestation actions in a watershed may ensure water supply for people and agricultural uses, as well as for hydroelectric power production (Figure 1.7). The benefits of water flow regulation however, may not be provided locally but transferred downstream (Guo et al., 2000).
ANALYSING HYDROLOGICAL SERVICES PROVIDED BY FORESTS 31
Figure 1. 7 -The relationship between the ecohydrological processes and the provision of hydrological services, connected by attributes such as of quantity, quality, location and timing, from Brauman et al. (2007).
Figure 1. 8 – The movement of water from precipitation through the vegetation and soil system into streams, and how it is affected by changes in vegetation, from Le Maître, et al., (2014).
Overall, climatic, topographic and ecological conditions of the regions influence the water balance, with a significant role played by land cover, which can be targeted for ecosystem services management (Calder, 2002). Chapter 2 of this thesis addresses in more detail hydrological services provision and the relationships between forests and water.