Quality of infant care in primary health
services in Southern and Northeastern Brazil
Andréia Soprani dos SantosI, Suele Manjourany Silva DuroII, Nágela Valadão CadeIII, Luiz Augusto FacchiniIV, Elaine TomasiIV
I Universidade Federal do Espírito Santo. Centro Universitário Norte do Espírito Santo. Departamento de
Ciências da Saúde. São Mateus, ES, Brasil
II Universidade Federal de Pelotas. Faculdade de Enfermagem. Pelotas, RS, Brasil
III Universidade Federal do Espírito Santo. Centro de Ciências da Saúde. Departamento de Enfermagem. Vitória,
ES, Brasil
IV Universidade Federal de Pelotas. Departamento de Medicina Social. Pelotas, RS, Brasil
ABSTRACT
OBJECTIVE: To assess the quality of the health care provided to children aged under one year old performed by primary health services in the South and Northeast regions of Brazil.
METHODS: his is a cross-sectional, population-based study carried out in 2010 with 7,915 children aged from one to four years, whose homes are located in the areas of health service coverage. We described the prevalence of procedures and guidelines, such as weight and height measurement, vaccination, newborn blood spot screening, evaluation of umbilical cord, instruction on breastfeeding and introduction of new food, and their respective 95% conidence intervals. he diferences were analyzed using the chi-square test of heterogeneity and linear trend. We considered the main outcome of high-quality infant care if the child had received all recommended procedures and guidelines in the irst year of life. For this analysis, we used the Poisson regression considering hierarchical model.
RESULTS: here was low prevalence for the instruction on breastfeeding in the irst week of life (58.8%, 95%CI 57.5–60.0) and on the introduction of new food in the fourth month care. he prevalence of high-quality in childcare was 42.0% (95%CI 40.5–43.5). he adjusted analysis according to hierarchical model indicated greater probability of this outcome in the Northeast region (PR = 1.17, 95%CI 1.09–1.26), in smaller municipalities (PR = 1.17, 95%CI 1.03–1.33), and in municipalities with 50,000 and 99,000 inhabitants (PR = 1.20, 95%CI 1.09–1.34).
CONCLUSIONS: he Northeast region has higher-quality infant care services, which can be explained by the consolidation of the Family Health Strategy in that region.
DESCRIPTORS: Infant. Child Health Services. Quality of Health Care. Primary Health Care. Uniied Health System. Family Health Strategy.
Correspondence: Andréia Soprani dos Santos Rodovia BR 101 Norte, Km 60, Litorâneo
29932-540 São Mateus, ES, Brasil E-mail: [email protected]
Received: Aug 10, 2016 Approved: Apr 5, 2017
How to cite: Santos AS, Duro SMS, Cade NV, Facchini LA, Tomasi E. Quality of infant care in primary health services in Southern and Northeastern Brazil. Rev Saude Publica. 2018;52:11.
Copyright: This is an open-access article distributed under the terms of the Creative Commons Attribution License, which permits unrestricted use, distribution, and reproduction in any medium, provided that the original author and source are credited.
INTRODUCTION
The monitoring of child development and growth is a primary activity of health professionals, which is a standard practice regarding primary health care for this age
group. hus, childcare service from basic actions23 has a special position guaranteed in
the healthcare policy agenda25.
he irst years of a child are vital because they are a period of great vulnerability and
adaptation to life conditions3; thus, they require continuous monitoring for a consistent promotion of health and prevention of diseases23. In the context of primary services, the
Ministry of Health (MOH) recommends seven routine visits in the irst year of life, distributed
over the irst week and the irst, second, fourth, sixth, ninth, and twelfth months20. hese
services prioritize home visits in the early days of birth, instruction on breastfeeding, and
control of vaccine-preventable diseases and childhood prevalent diseases10.
Infant care services comprise identiication and instruction of parents about exclusive breastfeeding and performance of newborn blood spot screening test, analysis and report on weight and height, vaccination, and assessment of danger signs and possible vulnerabilities20.
hese actions, beyond their individual beneits, are able to generate health indicators that detail the proile of the services. Among those indicators, vaccination coverage, which shows the total percentage of children immunized, relects the result of that service in each territory4.
Although care protocols for children are well established, there is still evidence of questionable
service performance and variation in the quality5,8,24 because of region particularities11 and
diiculties in implementing health promotion actions12,14,24. In that sense, the assessment of
services becomes relevant to the organization and management of healthcare.
In Brazil, when considering the socioeconomic and demographic diferences between the South and Northeast regions, the latter stands out for its high infant mortality and poverty
rates, if compared to the South22. Since high quality care relects on decreasing infant
mortality25, we expected to ind lower quality childcare in the Northeast region. hus, this study aimed to assess the quality of the health care provided to children aged under one year old performed by primary health services in the South and Northeast regions of Brazil.
METHODS
his cross-sectional, population-based study was conducted in the Northeast and South regions of Brazil, in areas covered by traditional primary health units (PHU) and Family Health Strategy units (FHS), randomly selected from urban census tracts. We identiied in these areas the households with children aged under seven years old and their families. his study is part of the research “Health status, use of services, and quality of care for children and families in the South and Northeast regions of Brazil,” carried out from August to October 2010.
The municipalities were randomly selected among those covered between 30% and 70% by the Family Health Strategy, and they were stratiied into four population scales: 10,000–29,999 inhabitants, 30,000–49,999 inhabitants, 50,000–99,999, and 100,000–999,999. We also randomized the urban PHUs from each random municipality using lists of address identiication, care model, and census tracts in their area. For each PHU sampled, two census tracts were chosen: one that included health services and another that was contiguous.
In each sector, for 27 children, the starting point for the location of the households was randomly selected, always systematically jumping ive households from the starting point. In each household, all children aged under seven years old were eligible for the study. For this analysis, the sample was restricted to children aged between one and four years, in order to know the full exposure to infant care at the end of the irst year and to minimize possible
he power of the sample was calculated afterwards, considering 42%5 for high quality
prevalence of infant care services, that is if the child had received all the procedures recommended for the irst year of life, margin for error of 1.7 percentage points, and a design efect of 2.0, adding up to 6,456 children. To verify the association between high quality childcare and household area, we used a signiicance level of 5%, power of 95%, exposed and unexposed rate of 1.0, prevalence of outcome among those unexposed of 40%, and prevalence rate of 1.13, amounting to 4,674 children. In addition to this number, we added 10% for losses or refusals and 30% for the control of confounding factors, resulting in 6,545 children. In total, 7,915 children aged from one to four years integrated the sample.
From the procedures performed – heel prick test, evaluation of the umbilical cord, vaccination, measurement, and instruction on weight and height, breastfeeding, and introduction of new foods –, a variable was constructed with the sum of the positive responses to all items in each of the seven of the services recommended in the irst year of life.
Subsequently, a high-quality childbirth outcome variable was constructed if the child had received all the procedures and guidelines recommended in the irst year of life.
he independent variables were geographic location: region (South, Northeast), size of the city in thousands of inhabitants (10–29, 30–49, 50–99, and 100–999), care model (family healthcare, traditional care); family socioeconomic status: economic classiication of the
Brazilian Association of Research Companies (ABEP – A/B, C, D/E), household income per
capita in quartiles of minimum wages (up to 0.237, 0.238–0.431, 0.432–0.823, 0.824 or more), Bolsa Família– a Brazilian social welfare program – (yes, no); maternal demographic and
social condition: age in years (up to 19, 20–29, 30–39, 40 or more), self-reported race (white, brown, black), school education in years (up to 4, 5–8, 9 or more), presence of spouse/partner (yes, no), total number of live births (1, 2, 3, or more); child status: total number of prenatal appointments (up to 5, 6 or more), sex (male, female), age in years (1, 2, 3, 4), race reported by the mother (white, brown, black).
Data collection was carried out by trained interviewers with the aid of a personal digital assistant (PDA). We used an individual questionnaire containing information on children and their mothers, as well as a socioeconomic questionnaire with information about the household and family. Interviews took place in the households and were answered by the biological mother or, in her absence, by a responsible guardian. For quality control, 8% of the interviews were repeated, when the sample answered again four questions about the child and family. Kappa statistics showed rates between 0.6 and 0.9, understood as good and excellent concordance, respectively16.
We calculated the prevalence and respective 95% conidence intervals (95%CI) for all
procedures and instructions in the seven childcare appointments. We performed a
bivariate analysis calculating the prevalence and associations with chi-square test of heterogeneity and linear trend. Poisson regression was used for the crude and adjusted analysis of the primary outcome, with robust adjustment of variance and prevalence ratios (PR), as well as 95%CI estimated by Wald test for heterogeneity and linear trend. he adjusted analysis was guided by hierarchical model with backward elimination. he input of variables happened by levels, considering the value p < 0.20, identiied in the
crude analysis. We included the geographic location of the variables in the distal level; the socioeconomic variables in the second one; and those related to maternal demographic
and social characteristics, followed by the addition of proximal variables related to the child characteristics in the third level. At each level, the variables were adjusted among themselves and to higher levels. For all analysis, a 5% signiicance level was adopted. All data analyses were conducted using Stata 13.0.
RESULTS
In total, this sample consisted of 7,915 children aged one to four years, with predominance of residents in the Northeast region (51.0%), in municipalities with more than 100,000 inhabitants (59.7%), and in areas covered by FHS (81.8%). Most children belonged to families
from economic class C (53.0%), half had an average monthly income per capita of less
than 0.43 minimum wage (minimum wage value at the time was R$358.35, equivalent to US$203.72), and 35.1% were part of the Bolsa Família Program. More than half of the mothers
were 20–29 years old (52.7%), 46.7% self-reported as white, 54.1% self-reported having nine or more years of school education, 78.8% lived with a spouse/partner, and 43.8% had only one child born alive. Regarding children, 85.7% were monitored in prenatal care with six or more visits, 52.0% were male, and 52.7% were white. he age factor was distributed equally among the four chosen years (Table 1).
On the irst week of life, the recommended actions were ofered to more than 90% of the children, apart from instruction on breastfeeding, which reached only over half the sample. Except for instruction on breastfeeding, all actions were more frequent in the Southern Brazil. Instruction on the introduction of new foods had prevalence under 75.0% until the fourth-month appointment, increasing its results in the sixth-month appointment to 92.5% (95%CI 91.8–93.2). he prevalence related to the other actions was approximated in both regions. From the ninth-month of service onwards, information regarding instruction on breastfeeding and introduction of new foods were collected simultaneously, especially in the Northeast region (Table 2).
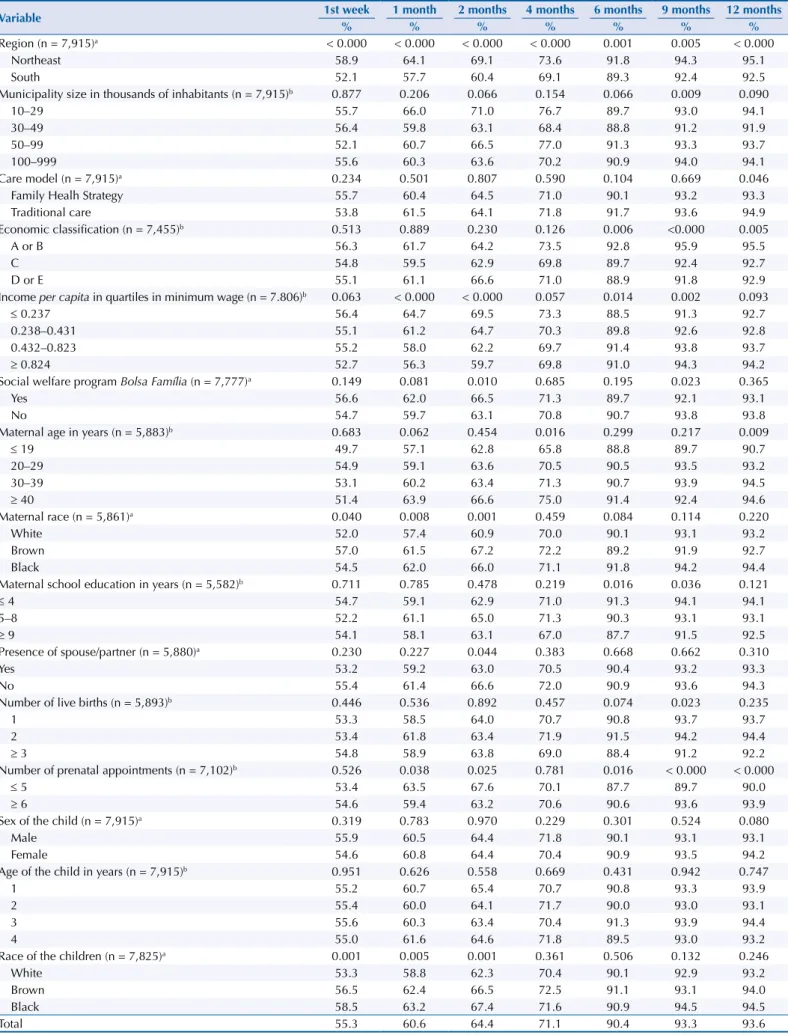
Table 3 presents the prevalence of high quality childcare in each period. In the irst week, 55.3% of the children had weight and height measurements, guidelines on breastfeeding, performance of the heel prick test, and evaluation of the umbilical cord.
Quality of infant care ranged from 55.3% in the irst week appointment to 93.6% in the twelfth-month appointment, with linear growth in the period. Quality of care was better shown in the Northeast region in all seven visits, performance that increased in both regions throughout the period. Municipality size above 100,000 inhabitants inluenced the ninth-month visit. he same was observed in relation to the care model of health facilities in the twelfth-month visit. here were socioeconomic diferences among classes
(A/B, C, D/E) starting from the sixth-month appointment. Regarding income per capita,
the diferences were visible in the irst-, second-, sixth-, and ninth-month appointments.
Children who beneited from Bolsa Família also represented better quality performance
in the second- and ninth-month appointments (Table 3).
We observed a higher prevalence of high quality childcare in mothers aged over 39 years in the fourth- and twelfth-month appointment; the greatest diference was found in the fourth-month appointment among mothers aged under 20 years (65.8%) and mothers aged over 39 years (75.0%). In both periods, the children of mothers aged up to 19 years had the lowest proportions of high quality (Table 3).
Children reported as brown and black by the mothers showed diferences in the prevalence of quality in childcare in the irst three appointments. A similar situation was identiied regarding maternal education, whose contrast was observed in the sixth- and ninth-month appointment. Maternal characteristics related to the presence of spouse/partner and the number of live births showed insigniicant results in association with the quality of childcare services. Mothers who had six or more prenatal appointments reported superior quality in three appointments. Regarding children, sex and age did not show signiicant diferences. Race, on its turn, inluenced the irst three appointments (Table 3).
Table 1. Description of the sample according to demographic, socioeconomic, maternal, and child variables. Southern and Northeastern Brazil, 2010.
Variable n %
Region (n = 7,915)
Northeast 4,041 51.0
South 3,874 49.0
Municipality size in thousands of inhabitants (n = 7,915)
10–29 621 7.8
30–49 1,565 19.8
50–99 1,004 12.7
100–999 4,725 59.7
Care model (n = 7,915)
Family Healh Strategy 6,478 81.8
Traditional care 1,437 18.2
Economic classification (n = 7,455)
A or B 1,575 21.1
C 3,951 53.0
D or E 1,929 25.9
Income per capita in quartiles in minimum wage (n = 7.806)
≤ 0.237 1,767 24.9
0.238–0.431 1,771 25.0
0.432–0.823 1,783 25.2
≥ 0.824 1,765 24.9
Social welfare program Bolsa Família (n = 7,777)
Yes 2,728 35.1
No 5,049 64.9
Maternal age in years (n = 5,883)
≤ 19 469 8.0
20–29 3,098 52.7
30–39 1,875 31.8
≥ 40 441 7.5
Maternal race (n = 5,861)
White 2,739 46.7
Brown 998 17.0
Black 2,124 36.3
Maternal school education in years (n = 5,582)
≤ 4 643 11.5
5–8 1,919 34.4
≥ 9 3,020 54.1
Presence of spouse/partner (n = 5,880)
Yes 4,633 78.8
No 1,247 21.2
Number of live births (n = 5,893)
1 2,578 43.8
2 1,924 32.6
≥ 3 1,391 23.6
Number of prenatal appointments (n = 7,102)
≤ 5 1,016 14.3
≥ 6 6,086 85.7
Sex of the child (n = 7,915)
Male 4,114 52.0
Female 3,801 48.0
Age of the child in years (n = 7,915)
1 2,070 26.2
2 1,968 24.8
3 1,943 24.6
4 1,934 24.4
Race of the child (n = 7,825)
White 4,123 52.7
Brown 1,576 20.1
Table 2. Prevalence of procedures and health guidelines developed in infant care services in the first year of life, according to region. Southern and Northeastern Brazil, 2010.
Variable
Region (n = 7,915)
Total South
(n = 3,874)
Northeast (n = 4,041)
% (95%CI) % (95%CI) % (95%CI)
1st week
Weight measurement 98.7 (98.2–99.0) 97.1 (96.4–97.6) 97.9 (97.5–98.3)
Height measurement 98.5 (98.0–98.8) 96.0 (95.3–96.7) 97.3 (97.0–97.7)
Instruction on breastfeeding 53.5 (51.8–55.2) 64.6 (62.9–66.3) 58.8 (57.5–60.0)
Blood spot screening test 99.0 (98.6–99.3) 94.0 (93.1–94.8) 96.7 (96.2–97.1)
Evaluation of the umbilical cord 93.3 (92.4–94.1) 87.4 (86.2–88.5) 90.6 (89.8–91.3)
1 month
Weight 99.7 (99.5–99.9) 99.5 (99.1–99,7) 99.6 (99.4–99.8)
Weight report 97.5 (96.9–98.0) 97.6 (97.0–98,1) 97.5 (97.1–97.9)
Height 99.2 (98.9–99.5) 97.0 (98.9–99,5) 98.2 (97.9–98.5)
Height report 97.4 (96.8–97.9) 98.2 (97.6–98,6) 97.8 (97.4–98.1)
Vaccination 98.8 (98.4–99.1) 98.7 (98.2–99,0) 98.8 (98.5–99.0)
Instruction on breastfeeding 91.8 (90.8–92.7) 93.7 (92.8–94,5) 92.7 (92.0–93.3)
Introduction of new foods 59.9 (58.3–61.6) 66.1 (64.4–67,9) 62.8 (61.6–64.0)
2 months
Weight measurement 99.6 (99.4–99.8) 99.3 (98.9–99.6) 99.5 (99.3–99.6)
Weight report 97.5 (96.9–98.0) 97.9 (97.3–98.4) 97.7 (97.3–98.0)
Height measurement 99.0 (98.7–99.3) 96.9 (96.3–97.5) 98.1 (97.7–98.4)
Height report 97.3 (96.7–97.8) 98.5 (97.9–98.9) 97.8 (97.4–98.2)
Vaccination 98.8 (98.4–99.1) 98.8 (98.4–99.2) 98.8 (98.5–99.1)
Instruction on breastfeeding 92.2 (91.3–93.1) 95.7 (94.9–96.4) 93.8 (93.2–94.4)
Introduction of new foods 62.0 (60.3–63.6) 70.1 (68.4–71.7) 65.7 (64.5–66.9)
4 months
Weight measurement 99.6 (99.3–99.8) 99.5 (99.1–99.7) 99.5 (99.3–99.7)
Weight report 97.3 (96.7–97.8) 98.0 (97.4–98.4) 97.6 (97.2–98.0)
Height measurement 98.9 (98.4–99.2) 97.3 (96.6–97.8) 98.1 (97.8–98.5)
Height report 97.4 (96.8–97.9) 98.3 (97.7–98.7) 97.8 (97.4–98.2)
Vaccination 98.7 (98.3–99.0) 99.0 (98.6–99.3) 98.9 (98.6–99.1)
Instruction on breastfeeding 92.7 (91.8–93.6) 95.5 (94.7–96.2) 94.0 (93.4–94.6)
Introduction of new foods 70.8 (69.2–72.3) 74.4 (72.8–76.0) 72.5 (71.3–73.6)
6 months
Weight measurement 99.6 (99.3–99.8) 99.6 (99.3–99.8) 99.6 (99.4–99.7)
Weight report 97.6 (97.0–98.0) 98.0 (97.4–98.4) 97.8 (97.4–98.1)
Height measurement 98.8 (98.3–99.1) 97.1 (96.4–97.7) 98.0 (97.6–98.3)
Height report 97.5 (97.0–98.0) 98.4 (97.9–98.8) 97.9 (97.5–98.3)
Vaccination 99.1 (98.8–99.4) 98.7 (98.2–991) 99.0 (98.7–99.2)
Instruction on breastfeeding 92.9 (92.0–93.7) 95.5 (94.6–96.2) 94.1 (93.5–94.7)
Introduction of new foods 91.4 (90.4–92.2) 93.8 (92.8–94.6) 92.5 (91.8–93.2)
9 months
Weight measurement 99.6 (99.3–99.8) 99.4 (99.0–99.6) 99.5 (99.3–99.7)
Weight report 97.3 (97.0–98.1) 98.0 (97.4–98.5) 97.8 (97.4–98.2)
Height measurement 99.0 (98.6–99.3) 97.1 (96.4–97.7) 98.2 (97.8–98.5)
Height report 97.5 (96.9–98.0) 98.4 (97.8–98.8) 97.9 (97.5–98.3)
Vaccination 99.0 (98.6–99.3) 98.7 (98.2–99.0) 98.9 (98.6–99.1)
Breastfeeding and introduction
of new foods 92.6 (91.7–93.4) 95.3 (94.4–96.0) 93.8 (93.2–94.4)
12 months
Weight measurement 99.4 (99.1–99.7) 99.5 (99.2–99.7) 99.5 (99.3–99.6)
Weight report 97.5 (97.0–98.0) 98.3 (97.7–98.7) 97.9 (97.5–98.2)
Height measurement 98.7 (98.3–99.1) 97.0 (96.2–97.5) 97.9 (97.5–98.3)
Height report 97.7 (97.1–98.2) 98.5 (98.0–98.9) 98.1 (97.7–98.4)
Vaccination 99.0 (98.6–99.3) 98.7 (98.2–99.0) 98.9 (98.6–99.1)
Breastfeeding and introduction
Table 3. Prevalence of high quality outcome of child care in different periods, according to demographic, socioeconomic, maternal, and child variables. Southern and Northeastern Brazil, 2010.
Variable 1st week 1 month 2 months 4 months 6 months 9 months 12 months
% % % % % % %
Region (n = 7,915)a < 0.000 < 0.000 < 0.000 < 0.000 0.001 0.005 < 0.000
Northeast 58.9 64.1 69.1 73.6 91.8 94.3 95.1
South 52.1 57.7 60.4 69.1 89.3 92.4 92.5
Municipality size in thousands of inhabitants (n = 7,915)b 0.877 0.206 0.066 0.154 0.066 0.009 0.090
10–29 55.7 66.0 71.0 76.7 89.7 93.0 94.1
30–49 56.4 59.8 63.1 68.4 88.8 91.2 91.9
50–99 52.1 60.7 66.5 77.0 91.3 93.3 93.7
100–999 55.6 60.3 63.6 70.2 90.9 94.0 94.1
Care model (n = 7,915)a 0.234 0.501 0.807 0.590 0.104 0.669 0.046
Family Healh Strategy 55.7 60.4 64.5 71.0 90.1 93.2 93.3
Traditional care 53.8 61.5 64.1 71.8 91.7 93.6 94.9
Economic classification (n = 7,455)b 0.513 0.889 0.230 0.126 0.006 <0.000 0.005
A or B 56.3 61.7 64.2 73.5 92.8 95.9 95.5
C 54.8 59.5 62.9 69.8 89.7 92.4 92.7
D or E 55.1 61.1 66.6 71.0 88.9 91.8 92.9
Income per capita in quartiles in minimum wage (n = 7.806)b 0.063 < 0.000 < 0.000 0.057 0.014 0.002 0.093
≤ 0.237 56.4 64.7 69.5 73.3 88.5 91.3 92.7
0.238–0.431 55.1 61.2 64.7 70.3 89.8 92.6 92.8
0.432–0.823 55.2 58.0 62.2 69.7 91.4 93.8 93.7
≥ 0.824 52.7 56.3 59.7 69.8 91.0 94.3 94.2
Social welfare program Bolsa Família (n = 7,777)a 0.149 0.081 0.010 0.685 0.195 0.023 0.365
Yes 56.6 62.0 66.5 71.3 89.7 92.1 93.1
No 54.7 59.7 63.1 70.8 90.7 93.8 93.8
Maternal age in years (n = 5,883)b 0.683 0.062 0.454 0.016 0.299 0.217 0.009
≤ 19 49.7 57.1 62.8 65.8 88.8 89.7 90.7
20–29 54.9 59.1 63.6 70.5 90.5 93.5 93.2
30–39 53.1 60.2 63.4 71.3 90.7 93.9 94.5
≥ 40 51.4 63.9 66.6 75.0 91.4 92.4 94.6
Maternal race (n = 5,861)a 0.040 0.008 0.001 0.459 0.084 0.114 0.220
White 52.0 57.4 60.9 70.0 90.1 93.1 93.2
Brown 57.0 61.5 67.2 72.2 89.2 91.9 92.7
Black 54.5 62.0 66.0 71.1 91.8 94.2 94.4
Maternal school education in years (n = 5,582)b 0.711 0.785 0.478 0.219 0.016 0.036 0.121
≤ 4 54.7 59.1 62.9 71.0 91.3 94.1 94.1
5–8 52.2 61.1 65.0 71.3 90.3 93.1 93.1
≥ 9 54.1 58.1 63.1 67.0 87.7 91.5 92.5
Presence of spouse/partner (n = 5,880)a 0.230 0.227 0.044 0.383 0.668 0.662 0.310
Yes 53.2 59.2 63.0 70.5 90.4 93.2 93.3
No 55.4 61.4 66.6 72.0 90.9 93.6 94.3
Number of live births (n = 5,893)b 0.446 0.536 0.892 0.457 0.074 0.023 0.235
1 53.3 58.5 64.0 70.7 90.8 93.7 93.7
2 53.4 61.8 63.4 71.9 91.5 94.2 94.4
≥ 3 54.8 58.9 63.8 69.0 88.4 91.2 92.2
Number of prenatal appointments (n = 7,102)b 0.526 0.038 0.025 0.781 0.016 < 0.000 < 0.000
≤ 5 53.4 63.5 67.6 70.1 87.7 89.7 90.0
≥ 6 54.6 59.4 63.2 70.6 90.6 93.6 93.9
Sex of the child (n = 7,915)a 0.319 0.783 0.970 0.229 0.301 0.524 0.080
Male 55.9 60.5 64.4 71.8 90.1 93.1 93.1
Female 54.6 60.8 64.4 70.4 90.9 93.5 94.2
Age of the child in years (n = 7,915)b 0.951 0.626 0.558 0.669 0.431 0.942 0.747
1 55.2 60.7 65.4 70.7 90.8 93.3 93.9
2 55.4 60.0 64.1 71.7 90.0 93.0 93.1
3 55.6 60.3 63.4 70.4 91.3 93.9 94.4
4 55.0 61.6 64.6 71.8 89.5 93.0 93.2
Race of the children (n = 7,825)a 0.001 0.005 0.001 0.361 0.506 0.132 0.246
White 53.3 58.8 62.3 70.4 90.1 92.9 93.2
Brown 56.5 62.4 66.5 72.5 91.1 93.1 94.0
Black 58.5 63.2 67.4 71.6 90.9 94.5 94.5
Total 55.3 60.6 64.4 71.1 90.4 93.3 93.6
50,000–99,999 inhabitants (PR = 1.20, 95%CI 1.09–1.34). he other variables of the model, when submitted to adjustment in each level among themselves and in the levels among those with p < 0.05, did not show association with the quality of childcare services (Table 4).
DISCUSSION
he prevalence of procedures and health instructions received in infant care services indicated, in most cases, that PHU and FHS in the Northeast and South regions of Brazil have conducted the recommended health actions. he higher prevalence for measures of weight and height, greater than 97.0%, for all visits, suggests that health professionals have performed the anthropometric measures, which are important for the evaluation of child growth23. In a country
where child obesity rates rise quickly, that practice reveals itself to be even more necessary and
propitious for preventing childhood and adult chronic diseases15,21. Vaccination, on its turn,
also stands out for presenting elevated prevalence, relecting a well-structured and organized National Immunization Policy (NIP), which has been providing Brazilians with all types of vaccines. he NIP displays an eicient coverage, represented by its high rates even among low
income populations4, which presupposes no obstacles to its access.
he low prevalence concerning instruction on breastfeeding carried out in the irst-week appointment is alarming, as it is a critical period for the consolidation of breastfeeding, with information on baby sucking and feeding on demand26. All this information is essential
to support the breastfeeding practice and to ensure proper weight gain to be evaluated in subsequent appointments. When that instruction is not considered, it deconstructs a preventive practice recommended over the years, which admittedly beneits the mother
and baby26. Although this study has not investigated the reasons for such low prevalence, it
represents a real drawback that seems to reside not in the absence of equipment but in the
incompleteness of the service.
he professional responsible for infant care must guide and instruct the mothers and families
of the children on the adoption of recommended behaviors23. he lack of professional training
and understanding about the importance of appropriate monitoring of child growth may relect gaps in service and result in failure to give instructions and guidelines to parents6,7,12.
In this study, the prevalence of instructions on the introduction of new foods met the standard
recommended for feeding infants aged under six months20, being reduced in the irst sessions,
and followed by an increase in the sixth-month visit. From the irst day of birth to the sixth month of the child’s life, health professionals should not advise the ingestion of food other than breast milk18; after this period, it is necessary to instruct parents about the transition
from exclusive breastfeeding to the beginning of ingestion of other foods18. It is noteworthy
that this study did not set out to identify the duration of breastfeeding but the instruction provided by health professionals to parents in infant care services.
Brazilian studies have assessed the quality of childcare by completing health booklets, recording information on files, counting anthropometric measures, and performing procedures according to service protocols, as well as by national research. An overview of this situation is displayed by the minor prevalence of the completion of growth charts1 and
health booklets9. he prevalence of appointments ofered to children has been less than
60%10,15, reaching less than 30% for the irst-week appointment of the newborn5,15. Blood
spot screening test has been carried out in 70.8% of the children and the three doses of the tetravalent vaccine has reached 75.9%15. In general, we observed little favorable conditions
for good quality of infant healthcare1,5,7–11,17,19.
When assessing the prevalence of high quality childcare throughout the seven sessions, in the irst-week, irst-, second- and fourth-month appointments, we observed that children were
not entirely covered by the recommended health actions in the period. Reduced prevalence
Table 4. Crude and adjusted analysis of factors associated with high quality infant care services. Southern and Northeastern Brazil, 2010.
Variable % Crude analysis
a Adjusted analysisa
RP (95%CI) p RP (95%CI) p
Region (n = 7,915)b < 0.000 < 0.000
Northeast 45.3 1.14 (1.06–1.22) 1.17 (1.09–1.26)
South 39.8 1.0 1.0
Municipality size in thousands of inhabitants (n = 7,915)b 0.017 0.018
10–29 47.3 1.17 (1.03–1.33) 1.17 (1.03–1.33)
30–49 42.4 1.05 (0.96–1.15) 1.03 (0.95–1.14)
50–99 46.2 1.14 (1.03–1.27) 1.20 (1.09–1.34)
100–999 40.4 1.0 1.0
Care model (n = 7,915)c 0.306
Family Health Strategy 42.4 1.05 (0.95–1.14)
Traditional care 40.5 1.0
Economic classification (n = 7,455)c 0.240
A or B 41.4 1.0
C 41.0 0.99 (0.91–1.08)
D or E 44.4 1.07 (0.97–1.19)
Income per capita in quartiles in minimum wage (n = 7.806)b 0.001 0.100
≤ 0.237 44.2 1.18 (1.06–1.32) 1.10 (0.96–1.26)
0.238–0.431 44.0 1.18 (1.06–1.31) 1.13 (1.00–1.27)
0.432–0.823 41.3 1.11 (0.99–1.23) 1.10 (0.99–1.22)
≥ 0.824 37.3 1.0 1.0
Social welfare program Bolsa Família (n = 7,777)b 0.189 0.745
Yes 43.4 1.05 (0.98–1.13) 0.98 (0.89–1.08)
No 41.3 1.0 1.0
Maternal age in years (n = 5,883)c 0.738
≤ 19 37.1 1.0
20–29 41.0 1.11 (0.92–1.32)
30–39 39.6 1.07 (0.89–1.29)
≥ 40 38.2 1.03 (0.82–1.31)
Maternal race (n = 5,861)b 0.148 0.961
White 38.6 1.0 1.0
Brown 43.0 1.11 (0.99–1.25) 1.02 (0.88–1.18)
Black 41.1 1.07 (0.97–1.17) 0.99 (0.89–1.12)
Maternal school education in years (n = 5,582)c 0.566
≤ 4 39.6 1.00 (0.87–1.16)
5–8 41.4 1.05 (0.96–1.15)
≥ 9 39.4 1.0
Presence of spouse/partner (n = 5,880)b 0.105 0.138
Yes 39.4 1.0 1.0
No 42.8 1.09 (0.98–1.20) 1.08 (0.97–1.21)
Number of live births (n = 5,893)c 0.956
1 38.8 1.0
2 43.6 1.05 (0.96–1.16)
≥ 3 40.8 0.98 (0.88–1.10)
Number of prenatal appointments (n = 7,102)c 0.258
≤ 5 39.5 1.0
≥ 6 41.6 0.94 (0.83–1.05)
Sex of the child (n = 7,915)b 0.122 0.074
Male 43.1 1.06 (0.99–1.13) 1.09 (0.99–1.19)
Female 40.8 1.0 1.0
Age of the child in years (n = 7,915)c 0.964
1 41.4 1.00 (0.91–1.11)
2 42.6 1.03 (0.94–1.14)
3 42.9 1.04 (0.94–1.15)
4 41.2 1.0
Race of the child (n = 7,825)b < 0.000 0.128
White 39.5 1.0 1.0
Brown 42.2 1.07 (0.97–1.18) 0.96 (0.82–1.12)
Black 47.2 1.20 (1.10–1.30) 1.11 (0.97–1.26)
Total 42.0
a Poisson Regression with robust variance.
It is also possible that health teams have failed to achieve certain basic procedures12. On
the other hand, it was clear that children experienced nearly all health actions listed in the sixth-, ninth-, and twelfth-month appointments.
In all seven recommended visits, the Northeast region stood out for demonstrating the highest prevalence of quality in childcare, contrary to the study hypothesis, and showing adequate performance of health services in the Brazilian territory. In the adjusted analysis, the high quality infant care outcome was also higher in the Northeast (PR = 1.17, 95%CI 1.09–1.26). he explanation for this inding may be the fact that the Northeast region was the irst to have the Program of Community Health Agents (PCHA) in the 1990s, and later the Family
Health Program (FHP), currently named FHS22.
Over the years, the consolidation of the FHS program in the Northeast may have contributed to the current evidence of higher quality childcare services in that region. Possibly, health professionals of the FHS have more training, such as continuous education and residency courses in family healthcare, which qualify them to ofer proper care and work in a multidisciplinary way, resulting in fulillment of protocols and better performance in
health services2. he expansion of the FHS program from 1999 to 2004 was more solid in the
Northeast, in comparison to the South13. According to the 2008 National Household Survey,
the proportion of residents enrolled in FHS units was higher in the Northeast (67.7%) rather than in the South (53.0%). According to the 2013 National Health Research, the Northeast region also had the highest percentage of residents in households registered in FHS units, 68.1%, in relation to other regions of Brazil; the South, for example, had 58.4%17.
he FHS contributed over the years to expand health services in small towns and outlying areas of major cities22, showing better results regarding the recommended actions carried out
in the family health program when compared to traditional primary care2,13. hese indings
meet the results described herein, which revealed the highest quality of childcare among smaller municipalities (PR = 1.17, 95%CI 1.03–1.33) and among those with 50,000–99,999 inhabitants (PR = 1.20, 95%CI 1.09–1.34).
When analyzing the (unpublished) data of 220 health units in the South and Northeast regions, there were no diferences in physical structure, inputs, human resources, and work process. he adjusted analysis did not demonstrate the association of high quality infant care with variables linked to economy, mothers, and children. his result indicates that, in primary care, especially in infant care services, there seems to be no inluence of these issues on the quality of infant healthcare, which strengthens health equity. his may be related to the expansion of the FHS throughout the country, which has particularly afected small municipalities, characterized by lower socioeconomic development22. According to Malta et al.17, in Brazil and
in all regions, the FHS coverage has been higher in lower education areas, both regarding the proportion of registered individuals and home visits by a community health worker or team member. However, there is no denying that the existence of barriers, triggered by inadequate organization of healthcare services and by regional diferences, interfere in the quality of care14.
It is important to underline that this study has limitations because of the research instrument, as it did not explore the reasons related to the low prevalence of some variables, such as instruction on breastfeeding, identiied in the irst-week appointment, and it does not address information about the neuropsychomotor development of the child. Another aspect to be observed is due to the sample procedure, since mothers of several children from the same family could get confused and switch information about their children. In order to minimize this problem, the interviewer was instructed to follow the individual script, according to the number of children in the residency. here is still the possibility of memory bias in the mothers’ interview. To avoid such risk, we collected only the information on appointments carried out with children aged under one year old.
and proper care services for children throughout their irst year of life. Moreover, they point out the Northeast region as the highest in quality of infant care, possibly inluenced by the consolidation of the FHS program in that territory.
REFERENCES
1. Alves CRL, Lasmar LMLBF, Goulart LMHF, Alvim CG, Maciel GVR, Viana MRA, et al. [Quality of data on the Child Health Record and related factors]. Cad Saude Publica. 2009;25(3):583-95. Portuguese. https://doi.org/10.1590/S0102-311X2009000300013
2. Arantes LJ, Shimizu HE, Merchán-Hamann E. The benefits and challenges of the Family Health Strategy in Brazilian Primary Health care: a literature review. Cienc Saude Coletiva. 2016;21(5):1499-510. https://doi.org/10.1590/1413-81232015215.19602015
3. Ashworth A, Shrimpton R, Jamil K. Growth monitoring and promotion: review of evidence of impact.
Matern Child Nutr. 2008;4 Suppl 1:86-117. https://doi.org/10.1111/j.1740-8709.2007.00125.x
4. Barata RB, Ribeiro MCSA, Moraes JC, Flannery B. Socioeconomic inequalities and vaccination coverage: results of an immunisation coverage survey in 27 Brazilian capitals, 2007-2008. J
Epidemiol Community Health. 2012;66(10);934-41.
5. Caldeira AP, Oliveira RM, Rodrigues OA. [Quality of maternal and child health care in different models of Primary Health Care]. Cienc Saude Coletiva. 2010;15 Supl 2:3139-47. Portuguese. https://doi.org/10.1590/S1413-81232010000800018
6. Carvalho MF, Lira PIC, Romani SAM, Santos IS, Veras AACA, Batista-Filho M. [Monitoring of infant growth by health services in Pernambuco State, Brazil]. Cad Saude Publica.
2008;24(3):675-85. Portuguese. https://doi.org/10.1590/S0102 311X2008000300021
7. Cesar JA, Chrestani MAD, Fantinel EJ, Gonçalves TS, Neumann NA. [Child health in poor areas: findings from a population-based study in Caracol, Piauí, and
Garrafão do Norte, Pará, Brazil]. Cad Saude Publica. 2009;25(4):809-18. Portuguese. https://doi.org/10.1590/S0102-311X2009000400012
8. Costa GD, Cotta RMM, Reis JR, Ferreira M LSM, Reis RS, Franceschini SCC. [Evaluating child healthcare in the context of Family Healthcare in the city of Teixeiras, Minas Gerais (MG, Brazil)]. Cienc Saude Coletiva. 2011;16(7):3229-40. Portuguese. https://doi.org/1590/S1413-81232011000800022
9. Costa JSD, Cesar JA, Pattussi MP, Fontoura LP, Barazzetti L, Nunes MF, et al. [Child healthcare: completion of health records in municipalities in the semiarid region of Brazil]. Rev Bras Saude Matern Infant. 2014;14(3):219-27. Portuguese. https://doi.org/10.1590/S1519-38292014000300003
10. Costa JSD, Cesar JA, Weber AP, Garcez AS, Nora CRD, Rower HB, et al. [The characteristics of children under five years of age receiving basic care services in two municipalities in the Northeast region of Brazil]. Rev Bras Saude Matern Infant. 2015;15(1):33-46. Portuguese. https://doi.org/10.1590/S1519-38292015000100003
11. Cunha CLF, Silva RA, Gama MEA, Costa GRC, Costa ASV, Tonial SR. [The use of primary attention services to health by the childhood population in a Brazilian northeast]. Cad Saude
Coletiva. 2013;21(2):115-20. Portuguese. https://doi.org/10.1590/S1414-462X2013000200003
12. Damasceno SS, Nóbrega VM, Coutinho SED, Reichert APS, Toso BRGO, Collet N. Children’s Health in Brazil: orienting basic network to Primary Health Care. Cienc Saude Coletiva. 2016;21(9):2961-73. https://doi.org/10.1590/1413-81232015219.25002015
13. Facchini LA, Piccini RX, Tomasi E, Thumé E, Silveira DS, Siqueira FV, et al. [Performance of the PSF in the Brazilian South and Northeast: institutional and epidemiological
assessment of Primary Health Care]. Cienc Saude Coletiva. 2006;11(3):669-81. Portuguese. https://doi.org/10.1590/S1413-81232006000300015
14. Fausto MCR, Giovanella L, Mendonça MHM, Seidl H, Gagno J. [The position of the Family Health Strategy in the health care system under the perspective of the PMAQ-AB participating teams and users]. Saude Debate. 2014;38 No Espec:13-33. Portuguese. https://doi.org/10.5935/0103-1104.2014S003
16. Kirkwood BR, Jonathan ACS. Essential medical statistics. 2.ed: Medford (Mass): Wiley-Blackwell; 2003.
17. Malta DC, Santos MAS, Stopa SR, Vieira JEB, Melo EA, Reis C, et al. Family Health Strategy Coverage in Brazil, according to the National Health Survey, 2013. Cienc Saude Coletiva. 2016;21(2):327-38. https://doi.org/10.1590/1413-81232015212.23602015
18. Marinho LMF, Capelli JCS, Rocha CMM, Bouskela A, Carmo CN, Freitas SEAP, et al. Situation of the supplementary diet of children between 6 and 24 months attended in the Primary Care Network of Macaé, RJ, Brazil. Cienc Saude Coletiva. 2016;21(3):977-86. https://doi.org/10.1590/1413-81232015213.06532015
19. Mesquita Filho M, Luz BSR, Araújo CS. [Primary health care and its attributes: the situation of children under two years of age according to their caregivers]. Cienc Saude Coletiva.
2014;19(7):2033-46. Portuguese. https://doi.org/10.1590/1413-81232014197.17322013
20. Ministério da Saúde (BR), Secretaria de Atenção à Saúde, Departamento de Atenção Básica. Saúde da criança: crescimento e desenvolvimento. Brasília (DF); 2012 [cited 2017 Oct 25]. (Cadernos de Atenção Básica, 33). Available from:
http://bvsms.saude.gov.br/bvs/publicacoes/saude_crianca_crescimento_desenvolvimento.pdf
21. Onis MD. Preventing childhood overweight and obesity. J Pediatr (Rio J). 2015;91(2):105-7. https://doi.org/10.1016/j.jped.2014.10.002
22. Paim J, Travassos C, Almeida C, Bahia L, Macinko J. The Brazilian health system: history, advances, and challenges. Lancet. 2011;377(9779):1778-97. https://doi.org/10.1016/S0140-6736(11)60054-8
23. Santos RCK, Resegue R, Puccini RF. Childcare and children’s healthcare: historical factors and challenges. J Hum Growth Dev. 2012 [cited 2017 Oct 25];22(2):160-5. Available from: http://pepsic.bvsalud.org/pdf/rbcdh/v22n2/06.pdf
24. Silva JM, Caldeira AP. [Health care model and quality indicators: perceptions of primary health care professionals]. Cad Saude Publica. 2010;26(6):1187-93. Portuguese. https://doi.org/10.1590/S0102-311X2010000600012
25. Victora CG, Aquino EM, Leal MC, Monteiro CA, Barros FC, Szwarcwald CL. Maternal and child health in Brazil: progress and challenges. Lancet. 2011;377(9780):1863-76. https://doi.org/10.1016/S0140-6736(11)60138-4
26. Victora CG, Bahl R, Barros AJ, França GV, Horton S, Krasevec J, et al. Breastfeeding in the 21st century: epidemiology, mechanisms, and lifelong effect. Lancet. 2016;387(10017):475-90. https://doi.org/10.1016/S0140-6736(15)01024-7
Authors’ Contribution: Design and planning of the study: LAF, ET. Analysis and interpretation of the data: ASS, SMSD, ET. Elaboration or revision of the study: ASS, SMSD, NVC, ET. Approval of the inal version: LAF, ET.